Sample Category Title
Yuan hits 32-month high against Dollar, but dives against Euro
Chinese Yuan edged higher against Dollar today, pushing to a fresh 32-month high and drawing renewed attention to Beijing’s currency stance. The move comes amid growing speculation that Chinese authorities may be quietly signaling greater tolerance for a firmer Yuan.
However, a broader look at currency markets suggests Yuan’s gains are far more a function of broad-based Dollar weakness than a deliberate shift in Chinese policy. The greenback has been under sustained pressure globally, and USD/CNH has largely followed that trend rather than leading it. Indeed, when compared with other major currencies, Yuan’s appreciation has been notably measured and controlled. This relative restraint argues against the idea that Beijing is prepared to allow a free or rapid strengthening.
Still, markets have taken note of subtle policy signals. Late last week, the People’s Bank of China set Yuan’s daily fixing at 6.9929 per Dollar, the first time the midpoint has been set stronger than the closely watched 7.00 level since May 2023. It also marked the largest one-day strengthening since August. China went a step further today. Before markets opened, the PBOC fixed the midpoint at 6.9843 per dollar, the strongest level since May 17, 2023. The move reinforced the perception that authorities are comfortable with some near-term Yuan strength, particularly against a weakening dollar.
That said, analysts remain wary of extrapolating too much. Expectations are building that authorities could push back if appreciation pressures intensify, using policy tools to smooth gains and preserve competitiveness. The prevailing view remains that any Yuan strength will be tightly managed rather than left to market forces.
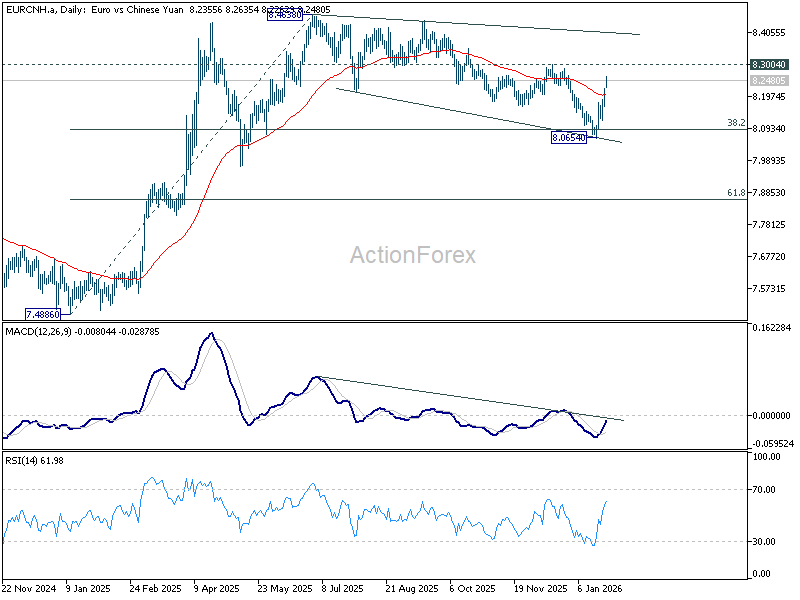
Technically, cross-rates echo that narrative. In EUR/CNH, the strong rally over the past two days and a clear break above the 55 Day EMA at 8.2025 suggest the corrective pullback from 8.4638 has completed at 8.0654, 38.2% retracement of 7.4886 (2025 low) to 8.4638 (2025 high) at 8.0913. Near-term focus is now on 8.3004, with a firm break there opening the door for a retest of 8.4638 high.
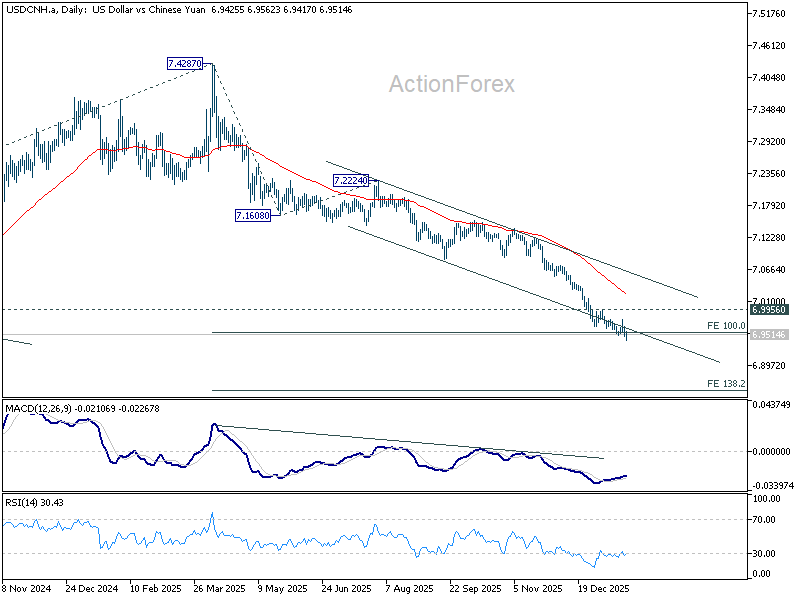
Meanwhile, USD/CNH continues to drift lower, but downside momentum is clearly waning. Daily MACD shows fading bearish pressure, while the pair has struggled to extend beyond the falling channel floor and 100% projection of 7.4287 to 7.1608 from 7.2224 at 6.9545.. A rebound from current levels, followed by break above 6.9956, would confirm short-term bottoming and reinforce the view that Yuan strength remains controlled rather than open-ended.
US durable goods orders surge 5.3% mom in November, led by transport strength
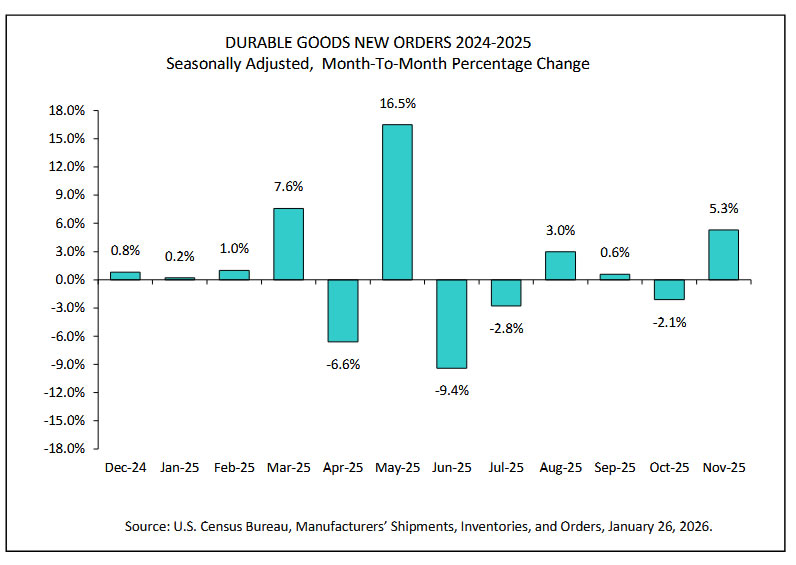
US durable goods orders posted a strong upside surprise in November, rising 5.3% mom to USD 323.8B, well above expectations for a 3.1% increase.
Excluding transportation, orders rose a solid 0.5% mom to USD 204.4B, also beating forecasts of a 0.3% increase. Ex-defense orders jumped an even stronger 6.6% mom to USD 286.9B.
Transportation equipment was the clear driver, surging 17.9% mom to USD 119.3B. While volatility in this category is common, the underlying gains in core orders suggest business investment remained resilient.
Japanese Yen Strengthens Sharply Amid Intervention Expectations
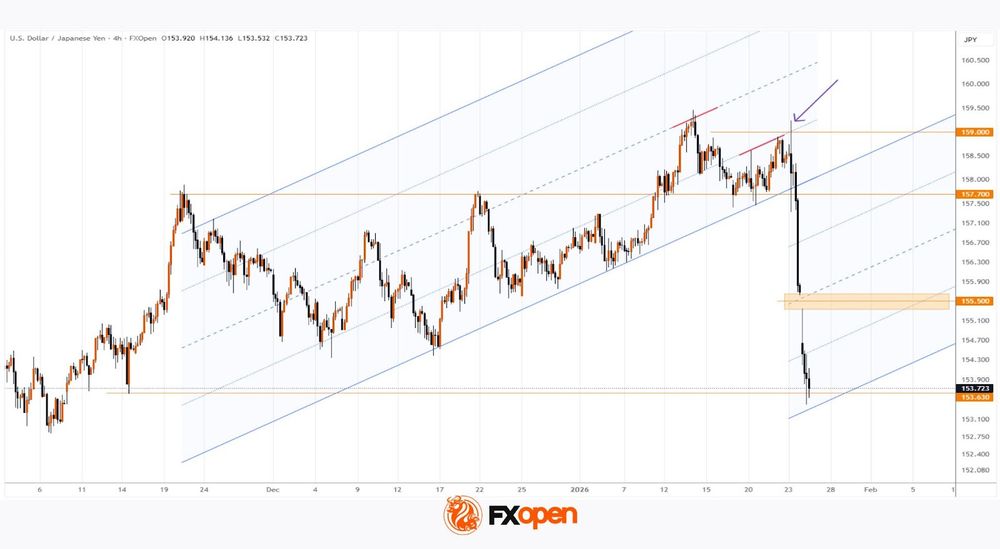
As the USD/JPY chart shows, the exchange rate fell sharply, reaching its lowest level since early November 2025.
The sudden strengthening of the yen has been driven both by expectations ahead of the upcoming Bank of Japan meeting and by growing speculation about a possible currency intervention, which could be carried out jointly by the Japanese authorities and the US Federal Reserve.
According to media reports:
→ on Friday, the New York Fed took specific actions that were interpreted as potential precursors to an actual intervention, providing the first bearish impulse;
→ on Sunday, Japanese Prime Minister Sanae Takaichi stated that the government would take “necessary steps” against speculative market movements — reinforcing the initial momentum at the market open on Monday.
Technical Analysis of the USD/JPY Chart
Last week, when analysing movements in the dollar–yen exchange rate, we identified a long-term ascending channel and also:
→ highlighted a number of bearish signals;
→ suggested that the lower boundary of the channel was at risk of a bearish break.
Notably, after that analysis, another bearish signal emerged on the USD/JPY chart — a bull trap (marked by the arrow) above the 159 level — followed by a break below the channel’s lower boundary.
At the same time, if a parallel channel of equal width is projected lower, its bottom boundary appears to be providing some support, slowing the pace of the decline.
It cannot be ruled out that emotions will subside and the market may attempt a rebound — for example, towards the bearish gap area around 155.5. However, the aggressive nature of the USD/JPY sell-off suggests that sellers are taking control after many months of sustained upward movement.
Trade over 50 forex markets 24 hours a day with FXOpen. Take advantage of low commissions, deep liquidity, and spreads from 0.0 pips (additional fees may apply). Open your FXOpen account now or learn more about trading forex with FXOpen.
This article represents the opinion of the Companies operating under the FXOpen brand only. It is not to be construed as an offer, solicitation, or recommendation with respect to products and services provided by the Companies operating under the FXOpen brand, nor is it to be considered financial advice.
Gold Breaches $5100/oz, Yen Intervention Risks Grow, Dollar Slides. USD/JPY Test 100-Day MA
Asia Market Wrap - Commodities Fly as Yen Intervention Risks Grow
Gold prices hit a new all-time high on Monday, climbing above $5,100 per ounce. Market participants continue to flock to safe havens as global uncertainty grows. This year alone, gold prices have jumped more than 18%.
Other precious metals like silver and platinum also saw significant price increases as part of this trend. Spot silver advanced 4.8% to $107.903, after hitting a record of $109.44. Spot platinum climbed 3.4% to $2,861.91 per ounce, after hitting a record high of $2,891.6 earlier in the session.
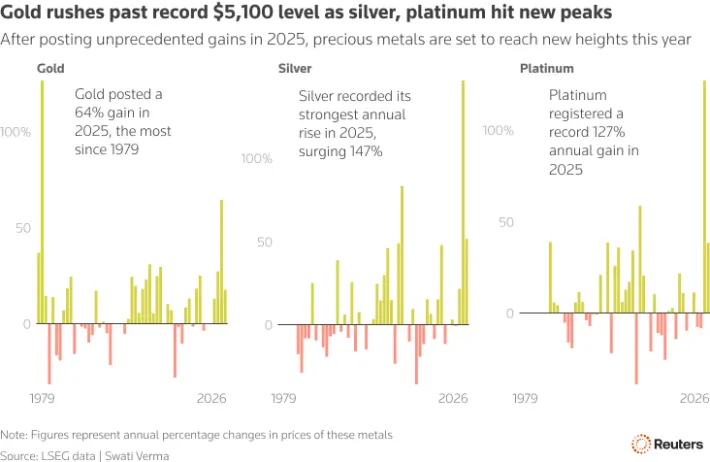
Source: LSEG
Geopolitical risks continue to grow and include a loss of confidence in the US government. Recent unpredictable decisions by President Trump regarding trade have made market participants nervous.
These include threats to put massive taxes (tariffs) on goods from Canada and France, as well as ongoing tensions with Iran. Because people are worried these political moves could harm the global economy, they are moving their money out of riskier investments and into gold.
In the currency world, the Japanese yen grew stronger against the US dollar. This happened because there are rumors that the US and Japan might step in together to help stabilize the currency market.
This potential intervention is big news because it hasn't happened in 15 years. Meanwhile, Japan is facing its own internal stress as its new Prime Minister, Sanae Takaichi, plans to increase spending and cut taxes, which has made market participants worried about Japan's national debt.
Because of all this uncertainty, global stock markets are struggling. Stock prices fell in Japan, and futures for markets in the US and Europe are also down.
European Session - European Shares Steady
European stock markets stayed mostly flat on Monday morning. Market participants were hesitant to make big moves because of recent global political tension and the upcoming meeting of the US Federal Reserve later this week.
While the main European index (the STOXX 600) rose very slightly, different industries saw mixed results; insurance companies saw some gains, while travel and leisure companies saw their stock prices drop.
Much of this caution comes from the market's reaction to President Trump’s recent threats regarding trade and taxes (tariffs). Even though those specific threats were taken back, markets are still worried that using tariffs as a bargaining tool could become a common trend that hurts global trade in the long run.
Additionally, while most people expect the US Federal Reserve to keep interest rates the same this week, there is a lot of talk about whether the central bank is able to make decisions independently from political pressure.
In specific company news, car manufacturers saw a small dip in their stock prices, even though reports suggested India might significantly lower the taxes it charges on cars imported from Europe.
Meanwhile, the French food company Danone saw its shares drop after it announced a recall of certain baby formula products in specific markets.
On the FX front, The US dollar index weakened on Monday, hitting its lowest level in four months.
At the same time, the Japanese yen surged to its strongest point since November, jumping more than 1% against the dollar. The euro also performed well, reaching a four-month high.
These big moves happened because of reports that the New York Federal Reserve was checking USD/JPY currency rates, an action usually seen as a sign that the US and Japan might step in together to control the market.
Japanese officials have been careful with their words. While the Finance Minister, Satsuki Katayama, refused to comment on whether they were checking rates, another top official, Atsushi Mimura, confirmed that Japan is working closely with the US and will take the necessary steps to manage the currency.
Because the dollar was losing value, other currencies like the British pound, the Australian dollar, and the New Zealand dollar also climbed to their highest levels in months.
Currency Power Balance
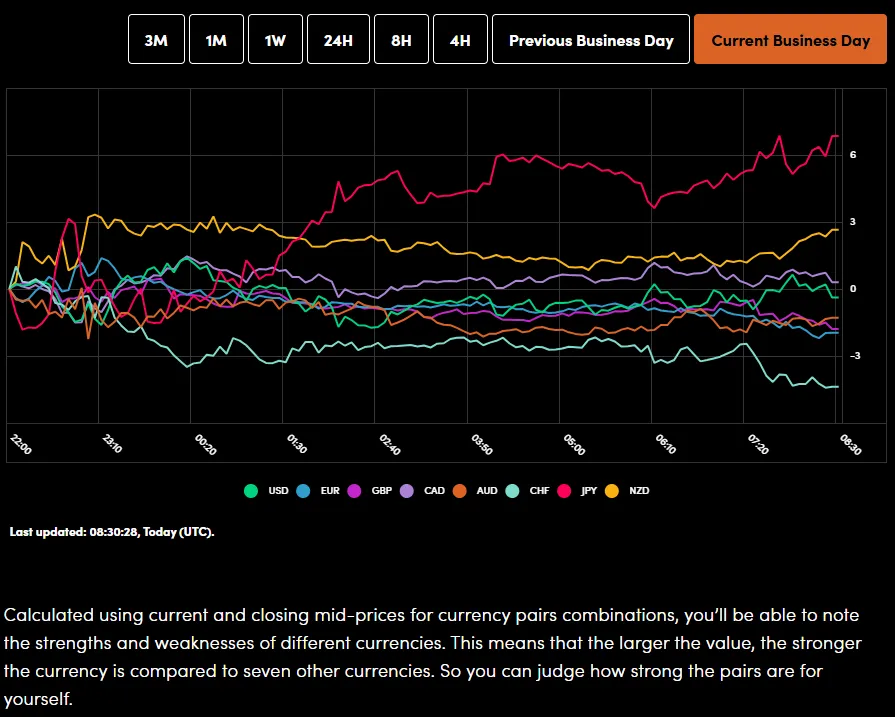
Source: OANDA Labs
Oil prices reached their highest levels in over a week this past Friday.
This jump happened because US President Donald Trump increased pressure on Iran by placing new sanctions on the ships that carry its oil. He also announced that a group of US warships, which he called an "armada," is moving toward the Middle East.
These political tensions have made market participants worried that the global supply of oil could be interrupted.
At the same time, oil production in the US has been slowed down by severe weather. A major event called Winter Storm Fern hit the country, forcing many oil and natural gas facilities to shut down. This storm has put a lot of stress on the power grid and reduced the amount of oil being produced.
As a result of both the situation in Iran and the storm at home, the prices for Brent crude and US West Texas Intermediate (WTI) oil both rose by nearly 3% by the end of the week last week with further gains in early trade today.
Economic Calendar and Final Thoughts
Data is largely thin today with Geopolitical developments likely to remain key. Greenland, tariffs, US-Iran among other discussions may be key drivers today.
On the European front we do have German IFO expectations and a host of ECB policymakers on the docket.
Heading into the US session, it is a quiet one with focus likely to be on US-Japan intervention developments while the US dollar risk premium remains elevated.
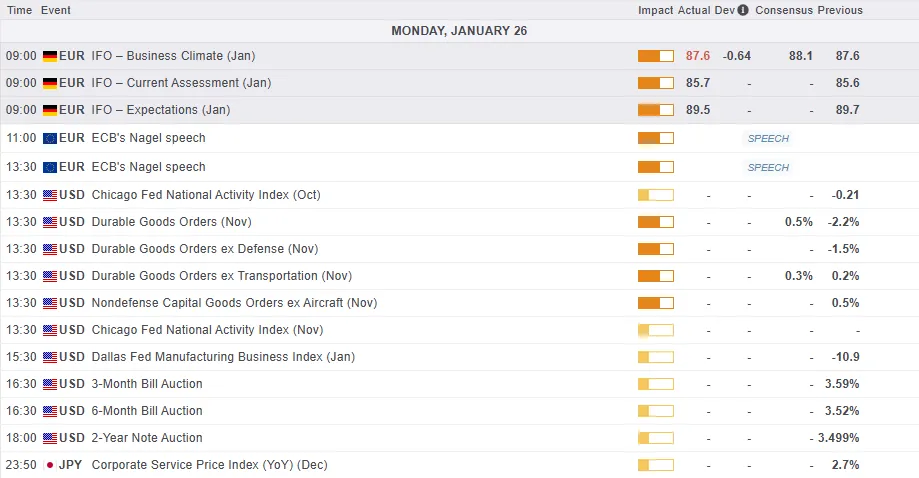
For all market-moving economic releases and events, see the MarketPulse Economic Calendar. (click to enlarge)
Chart of the Day - USD/JPY
From a technical standpoint, USD/JPY has finally had a deep pullback after edging higher since the October 2025 low around the 146.60 handle.
The pullback has materialized thanks to a weaker US Dollar and growing fears of joint intervention between the US and Japan. This would be the first intervention of its kind in 15 years.
Markets have grown weary of the BoJ issuing intervention comments in recent years but the rumors of US involvement have added further credence to the reports this time around.
USD/JPY is down some 600-odd pips since Friday but is currently testing the 100-day MA. The question is can this level or is a retest of 150.00 incoming?
Time will tell.
Key levels of support on the downside include the 100-day MA at 153.57 before the 151.53 and 150.00 levels come into focus.
A recovery from here may face opposition around the 154.60 handle before the 156.27 and 157.90 handles come into focus.
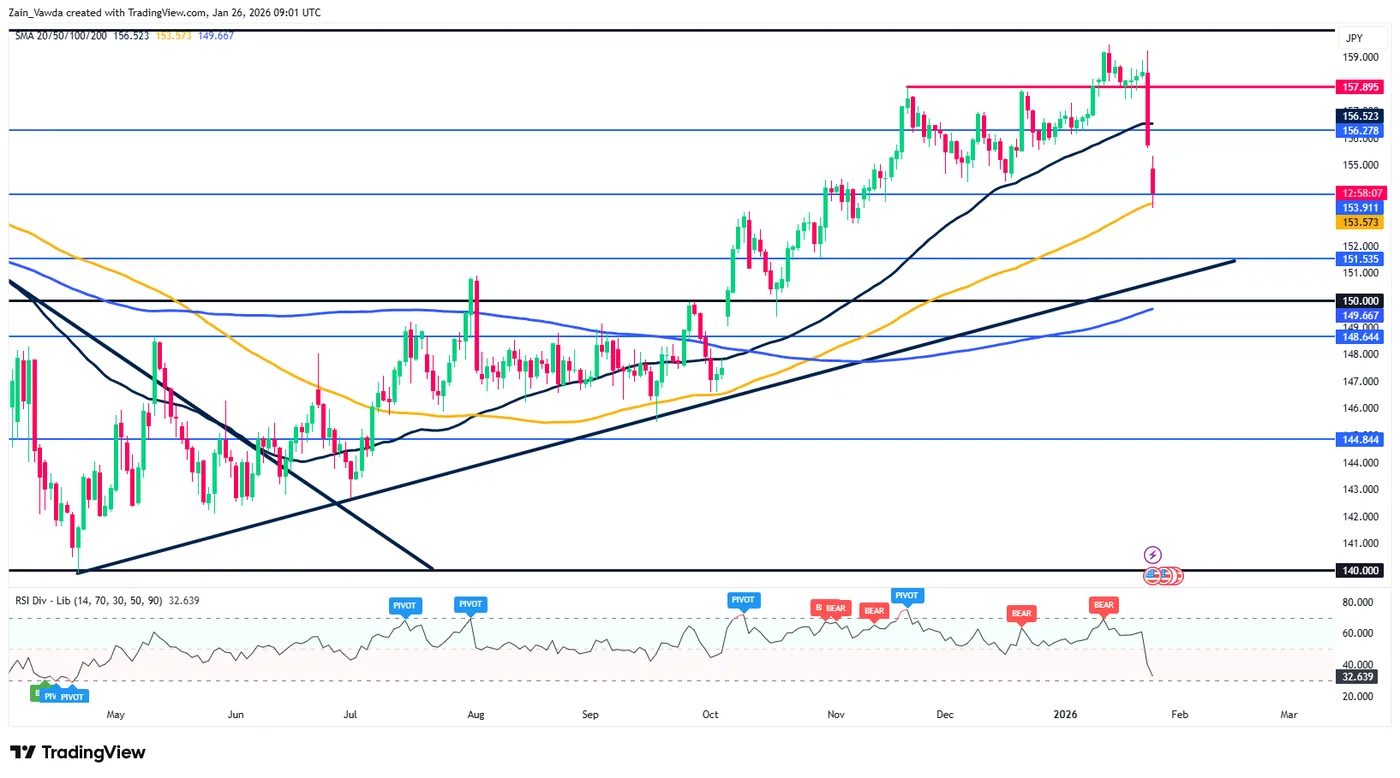
Source: TradingView.com (click to enlarge)
Wishing you all a positive trading week ahead.
Gold Price Breaks Above $5,000 for the First Time
At the market open on Monday, 26 January, gold prices (XAU/USD) formed a bullish gap and moved above the psychological $5,000 level. The rally then continued, with prices climbing close to $5,100.
Strong bullish momentum across precious metals markets has pushed gold up by around 18% since the start of the year, while silver has surged by approximately 50%.
Why Is Gold Rising?
The bullish tone is being driven by a combination of a weaker US dollar and heightened demand for safe-haven assets, shaped by the current environment:
→ The “Greenland issue”: renewed attempts by the Trump administration to acquire Greenland have escalated into a standoff with the EU, bringing the risk of a trade war.
→ Growing concerns about political pressure on the Federal Reserve and the stability of US monetary policy, given the US President’s intention to push for lower interest rates.
→ Central bank demand, harsh rhetoric from the White House towards Canada following its agreement with China, and ongoing tensions surrounding Iran.
All of this is fuelling an unstoppable bullish market. Under such conditions, is a decline in gold prices even possible?
Technical Analysis of the XAU/USD Chart
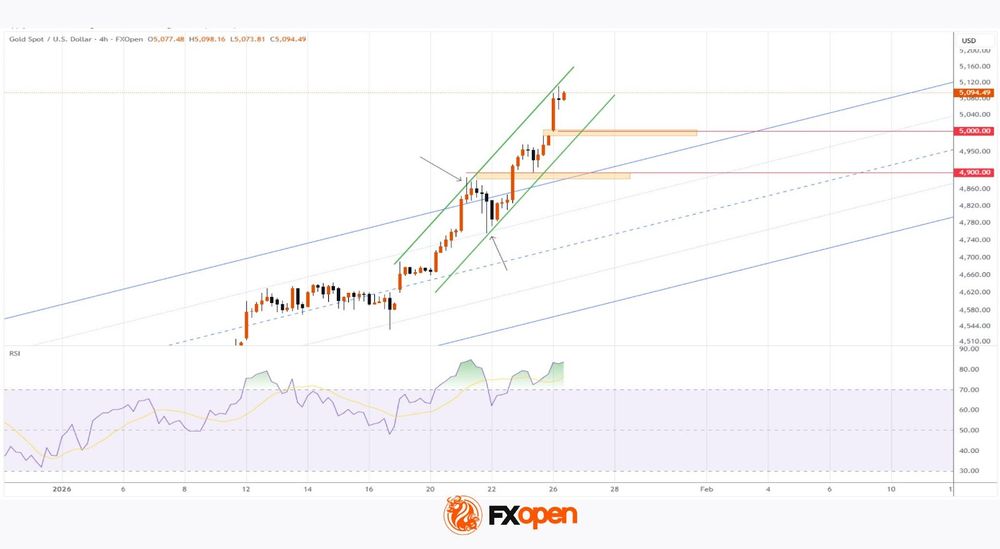
Six days ago, on 20 January, when analysing the gold chart, we:
→ constructed an ascending channel;
→ highlighted signs of market overbought conditions;
→ maintained a bullish outlook, suggesting that even if pullback attempts occurred, they were unlikely to be deep and that the boundaries of the rising channel would continue to define the market’s trajectory.
Since then, gold prices have exceeded even the boldest expectations:
→ after reaching overbought levels near the upper boundary (indicated by the first arrow), the market formed only a shallow correction;
→ bulls stepped in near the line dividing the upper half of the channel into quarters (indicated by the next arrow), then demonstrated their strength by pushing prices firmly above the upper boundary.
The steeper angle formed by the green trendlines points to the speculative and euphoric nature of demand.
From a technical perspective, the XAU/USD market is extremely overbought, as confirmed by the RSI indicator, creating the conditions for a corrective move — for example, a retest of the $5,000 psychological level or the bullish gap area around $4,900.
However, against an exceptionally strong fundamental backdrop, revising expectations seems premature. A reversal of the prevailing trend would require truly major and transformative events.
Start trading commodity CFDs with tight spreads (additional fees may apply). Open your trading account now or learn more about trading commodity CFDs with FXOpen.
This article represents the opinion of the Companies operating under the FXOpen brand only. It is not to be construed as an offer, solicitation, or recommendation with respect to products and services provided by the Companies operating under the FXOpen brand, nor is it to be considered financial advice.
Crypto Market Rose Due to Dollar Weakness
Market Overview
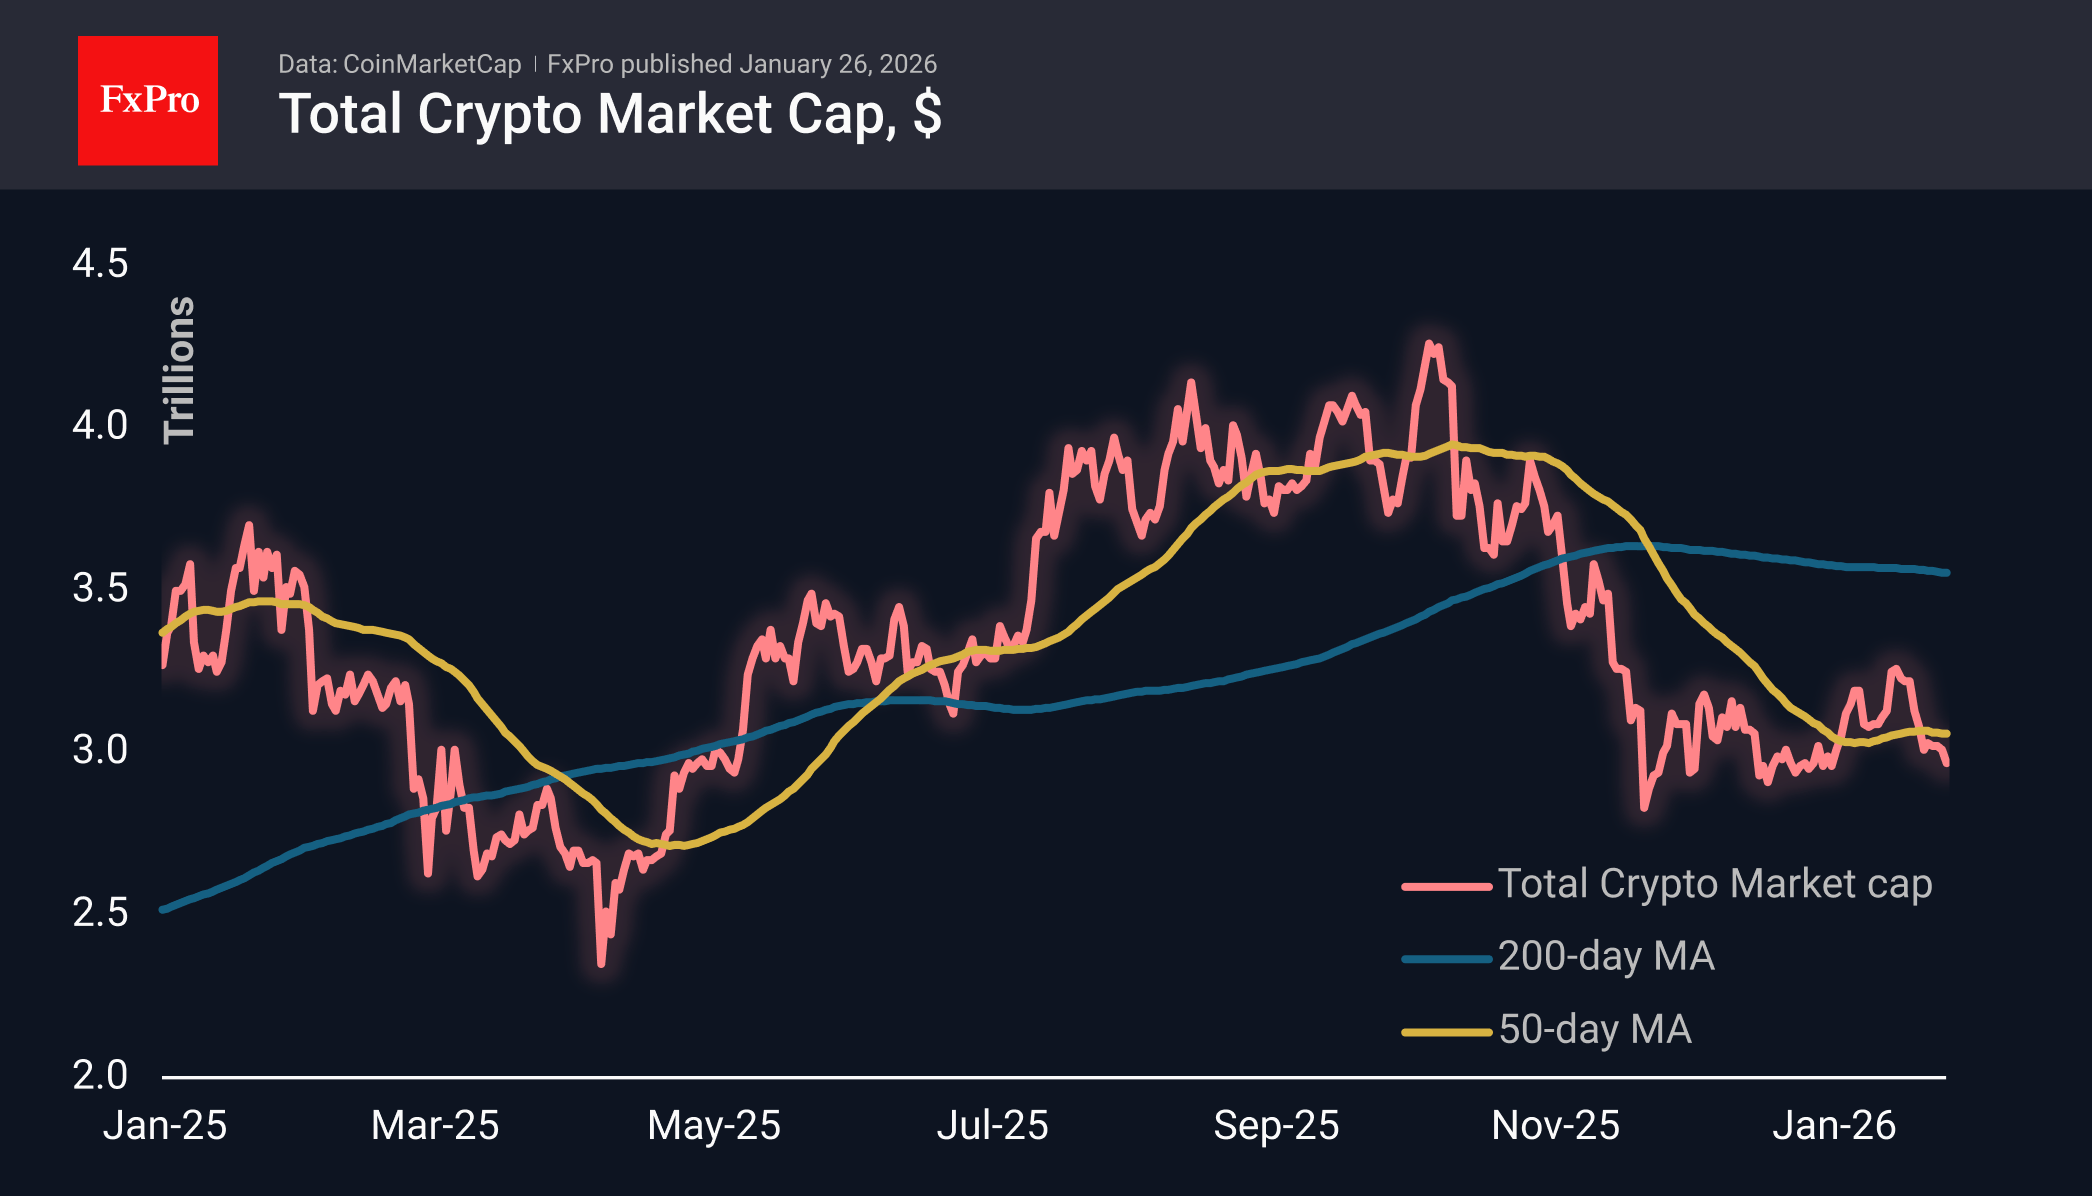
The crypto market cap has fallen by 5% over the past seven days. The decline resumed at the start of the new week, with total capitalisation falling to $2.9T amid slippage in an illiquid market. In recent hours, however, positive momentum has prevailed, bringing the market back to $2.97T due to the weakness of the US dollar and global purchases of risky assets. But even now, cryptocurrencies remain a lagging class of risk-sensitive assets, falling short of metals and the strongest global currencies.
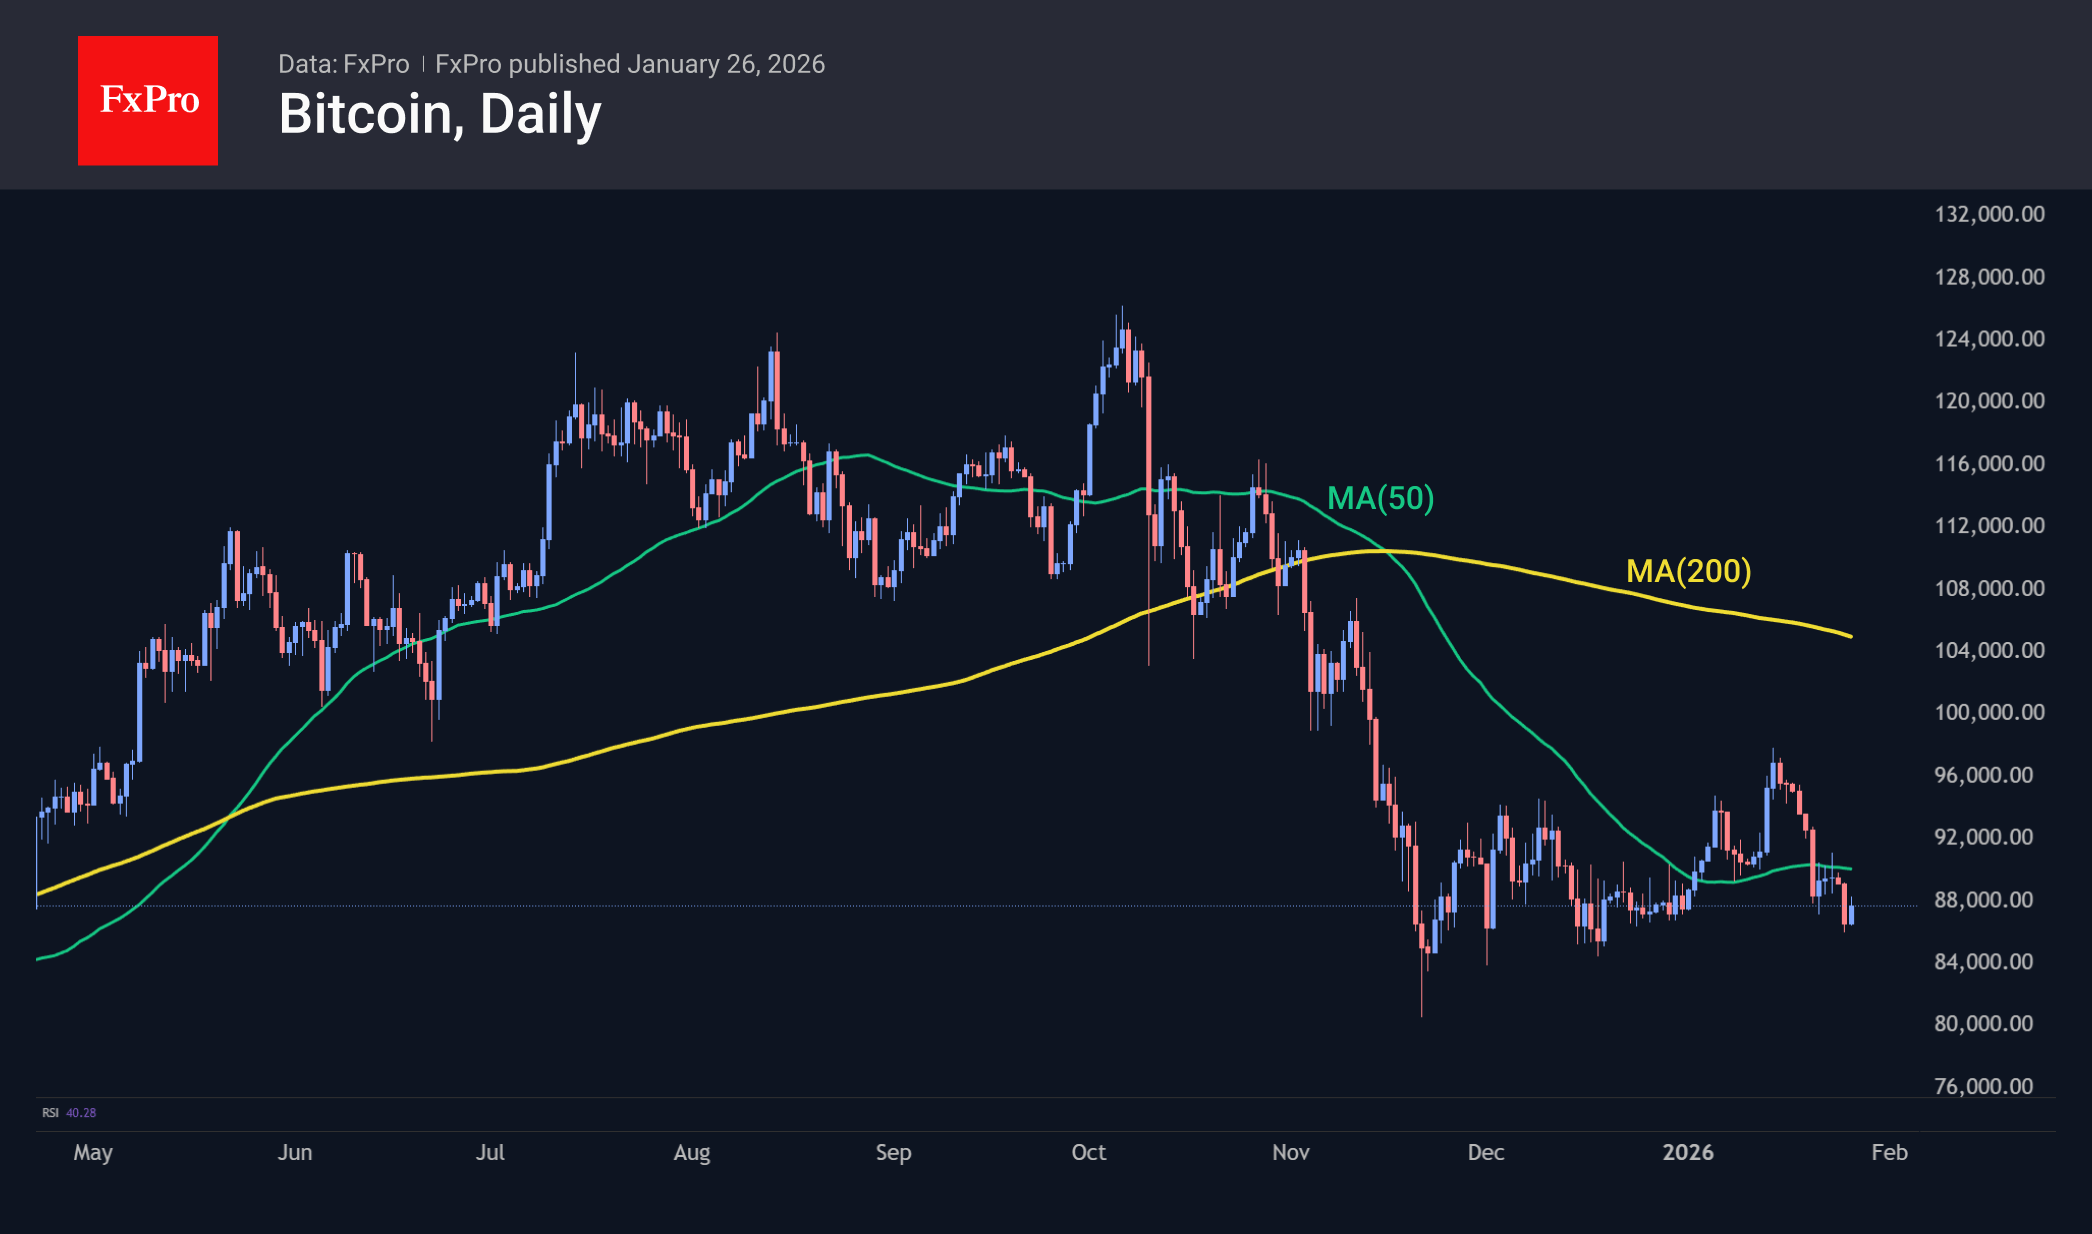
Bitcoin hit a low for the day near $86K, its lowest level since December. After that, the market received support from the weak dollar, which, like a tide, lifted all boats at once. The technical bearish picture remains relevant, despite the gains in recent hours. BTC remains below its key moving average lines and has not attempted to break through the support of the last two months.
News Background
Outflows from spot Bitcoin ETFs in the US over the past shortened week nearly offset the previous week’s inflows, reaching their highest level in almost 11 months. According to SoSoValue, net outflows from spot BTC ETFs amounted to $1.33 billion. Net weekly outflows from spot Ethereum ETFs in the US exceeded $611 million.
Bitcoin holders began to record net losses for the first time since October 2023, signalling the asset’s entry into an ‘early bear market.’ Bitcoin is now trading below the acquisition price of 75% of the total supply, signalling growing pressure from sellers, Glassnode notes.
The main reason for BTC’s weakness is large-scale sales by long-term holders, rather than concerns about quantum computing, according to Checkonchain.
Activity on the Ethereum mainnet has exceeded that of layer 2 (L2) solutions since the Fusaka upgrade. Token Terminal has called this trend a ‘return to the mainnet.’ At the same time, there has been an outflow of liquidity from ‘add-ons.’
The adoption of cryptocurrencies by banks, large corporations and investment companies is no longer an ‘optional or peripheral’ process, notes auditing firm PwC in its report on global cryptocurrency regulation for 2026. ‘Institutional participation has passed the point of no return.’
DAT companies accumulating cryptocurrencies on their balance sheets will face ‘severe consolidation’ in the coming year — only a few of the largest players with Bitcoin and Ethereum on their balance sheets will survive, warns Pantera Capital.
GBP/JPY Daily Outlook
Daily Pivots: (S1) 211.42; (P) 213.14; (R1) 214.18; More...
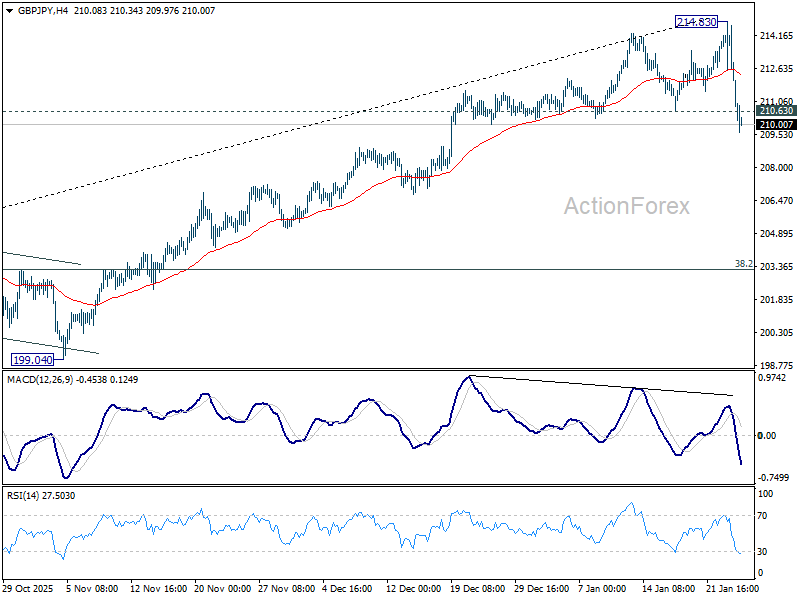
GBP/JPY's break of 210.63 support indicates that a short term top was at least formed at 214.83. Intraday bias is back on the downside for 55 D EMA (now at 208.90). Sustained break there will argue that it's correcting whole rise from 184.35 and target 38.2% retracement of 184.35 to 214.83 at 203.18. For now, risk will stay on the downside as long as 214.83 holds, in case of recovery.
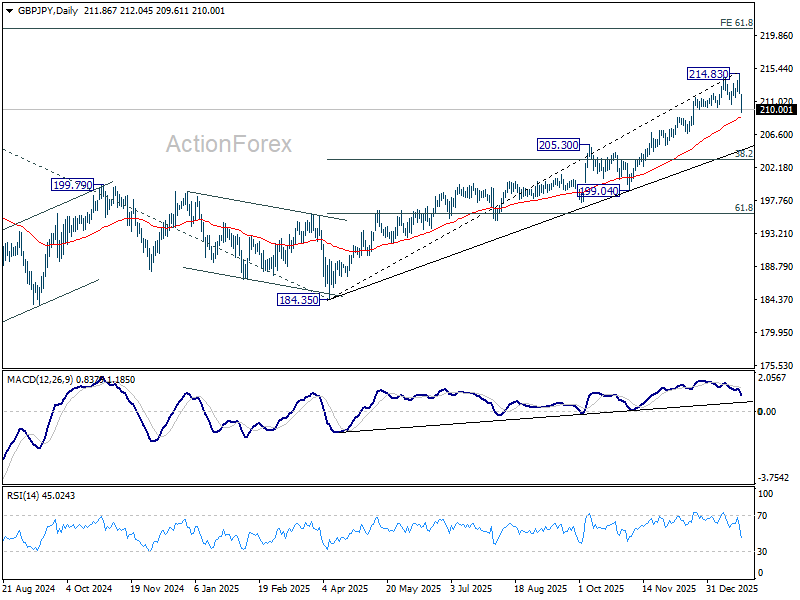
In the bigger picture, up trend from 123.94 (2020 low) is in progress. Next target is 61.8% projection of 148.93 (2022 low) to 208.09 (2024 high) from 184.35 at 220.90. On the downside, break of 205.30 resistance turned support is needed to indicate medium term topping. Otherwise, outlook will stay bullish even in case of deep pullback.
EUR/JPY Daily Outlook
Daily Pivots: (S1) 183.02; (P) 184.95; (R1) 186.10; More...
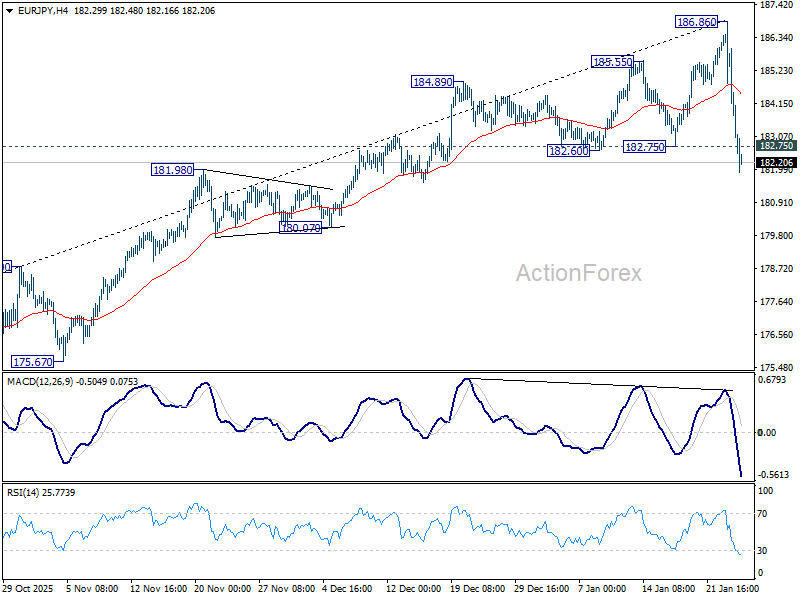
EUR/JPY's break of 182.75 support suggests medium term topping at 186.86 on bearish divergence condition in D MACD. Intraday bias is back on the downside. Sustained trading below 55 D EMA (now at 181.99) will solidify the case that it's already correcting whole rise from 154.77. Deeper fall should then be seen to 38.2% retracement of 154.77 to 186.86 at 174.60. For now, risk will stay on the downside as long as 186.86 holds, in case of recovery.
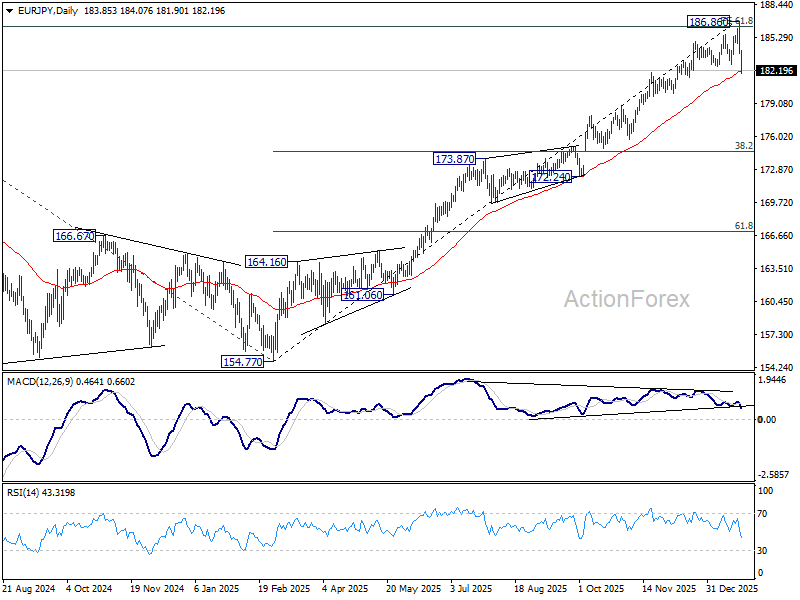
In the bigger picture, up trend from 114.42 (2020 low) is in progress and and met 61.8% projection of 124.37 to 175.41 from 154.77 at 186.31. Considering bearish divergence condition in D MACD, upside could be capped by 186.31 on first attempt. Still, outlook will stay bullish as long as 55 W EMA (now at 173.32) holds, even in case of deep pullback. Sustained break of 186.31 will pave the way to 78.6% projection at 194.88 next.
EUR/GBP Daily Outlook
Daily Pivots: (S1) 0.8649; (P) 0.8681; (R1) 0.8705; More…
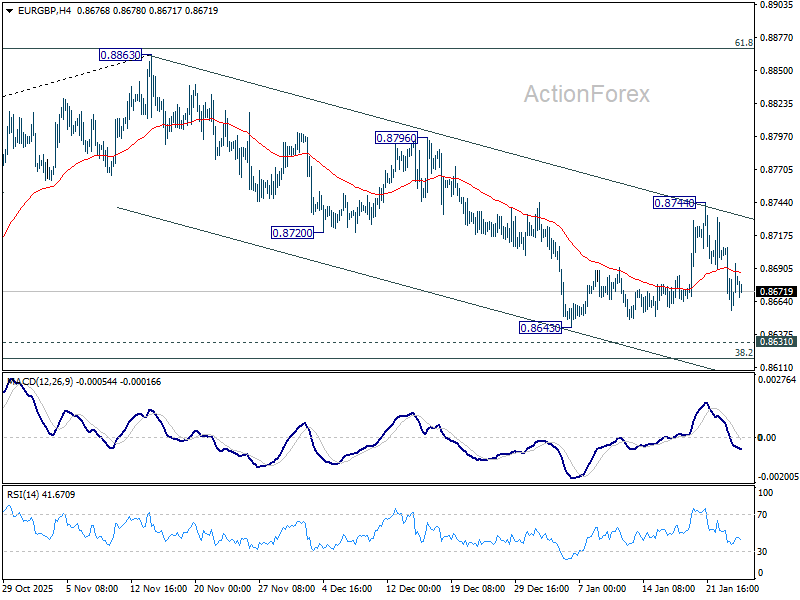
Intraday bias in EUR/GBP stays on the downside and deeper fall should be seen to 0.8631 cluster support (38.2% retracement of 0.8221 to 0.8663 at 0.8618). Decisive break there will carry larger bearish implications and pave the way to 61.8% retracement at 0.8466. Risk will now stay on the downside as long as 0.8744 resistance holds, in case of recovery.
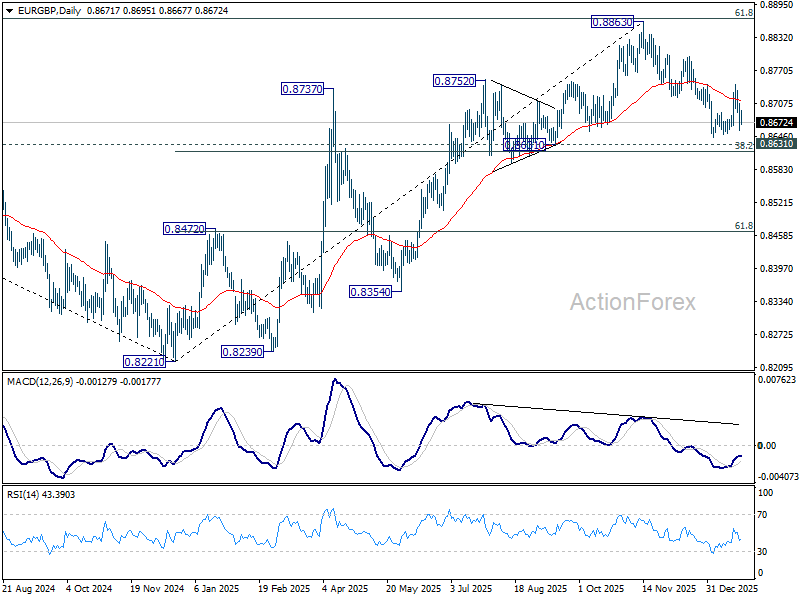
In the bigger picture, rise from 0.8221 medium term bottom (2024 low) is seen as a corrective move. Upside should be limited by 61.8% retracement of 0.9267 to 0.8221 at 0.8867. Sustained trading below 55 W EMA (now at 0.8625) should confirm that this corrective bounce has completed. In this case, deeper fall would be seen back to 0.8201/21 key support zone. However, decisive break of 0.8867 will suggest that EUR/GBP is already reversing whole decline from 0.9267 (2022 high). That should pave the way back to 0.9267.
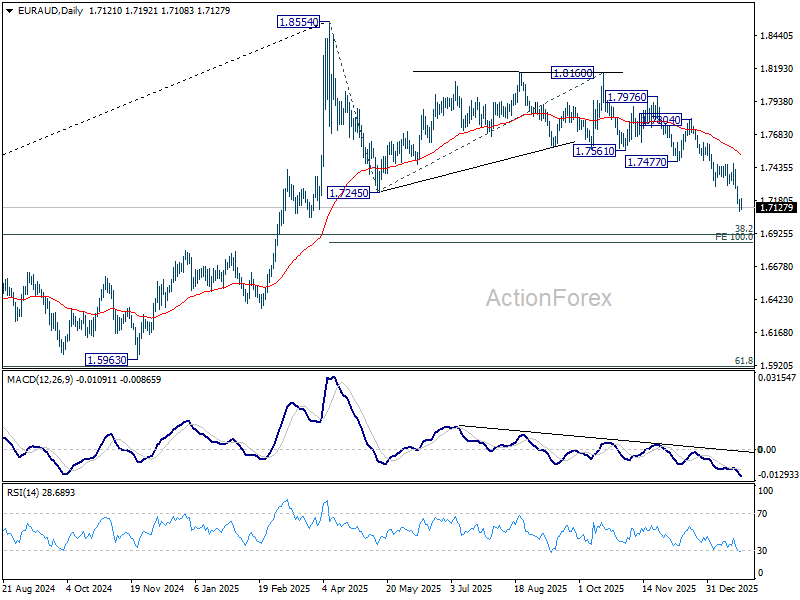
EUR/AUD Daily Outlook
Daily Pivots: (S1) 1.7102; (P) 1.7154; (R1) 1.7209; More...
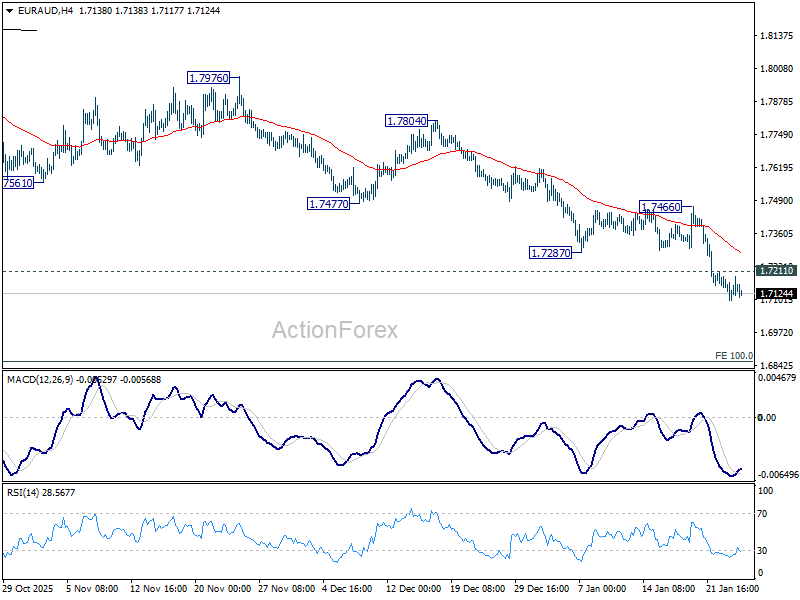
Intraday bias in EUR/AUD remains on the downside for the moment. Current fall is seen as the third leg of the pattern from 1.8554. Deeper decline should continue to 100% projection of 1.8554 to 1.7245 from 1.8160 at 1.6851. On the upside, above 1.7211 support turned resistance will turn intraday bias neutral first, and bring consolidations, before staging another decline.
In the bigger picture, the break of 55 W EMA (now at 1.7464) argues that fall from 1.8554 medium term top is correcting whole up trend from 1.4281 (2022 low). Deeper decline is in favor to 38.2% retracement of 1.4281 to 1.8554 at 1.6922, and possibly below. Risk will stay on the downside as long as 55 D EMA (now at 1.7537) holds, in case of strong rebound.