Sample Category Title
GBPUSD Struggles Withing Short-term SMAs; Neutral Bias
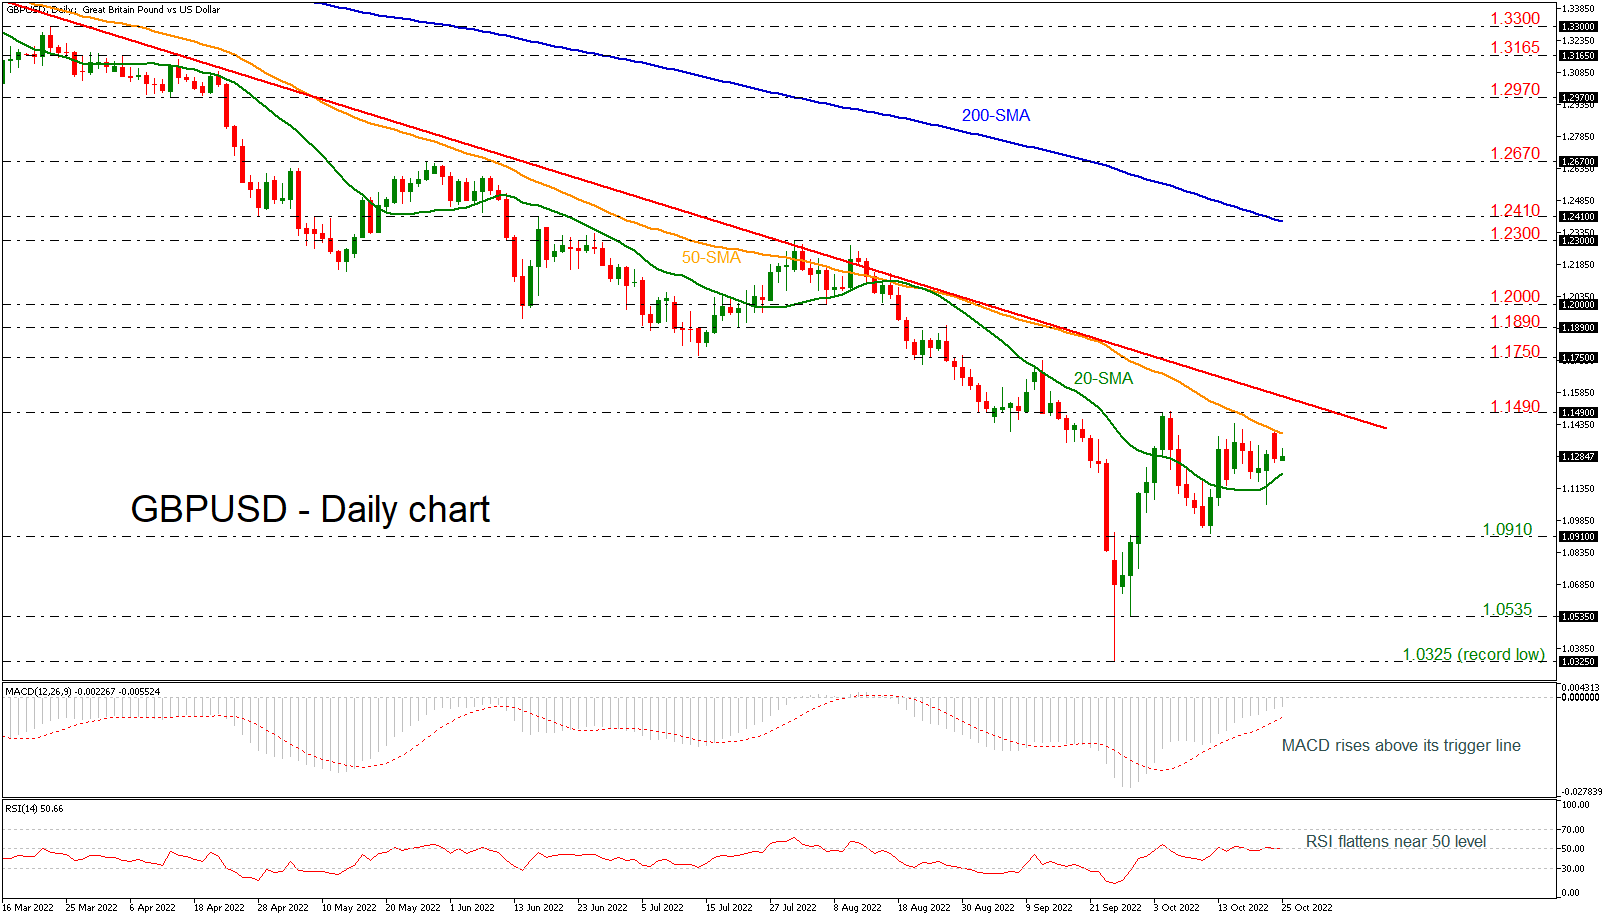
GBPUSD is hovering within the 20- and 50-day simple moving averages (SMAs) after the bearish movement from the 1.1400 mark on Monday. In the short-term, the price is failing to endorse a bullish correction and is shifting the bias to neutral.
Technically, the MACD oscillator is still strengthening its positive momentum, while the RSI is moving sideways near the neutral threshold of 50.
Should prices reverse lower, immediate support could come from the 20-day SMA at 1.1205. Below that, the 1.0910 barrier is another major support ahead of the 1.0535 level. Further losses would open the way towards the record low of 1.0325.
In the event of an upside reversal, the 50-day SMA at 1.1400 could act as a barrier before being able to re-challenge the 1.1490 resistance level. A break above this line would test the long-term downtrend line around 1.1550. Further gains would lead the way to a more bullish outlook in the near-term meeting the next resistance levels such as 1.1750 and 1.1890.
In the bigger picture, the pair is bearish as long as it holds below the 200-day SMA and the falling trend line. In case it violates these lines, bulls could take the upper hand.
US Oil: Bulls Continue to Strengthen Their Positions
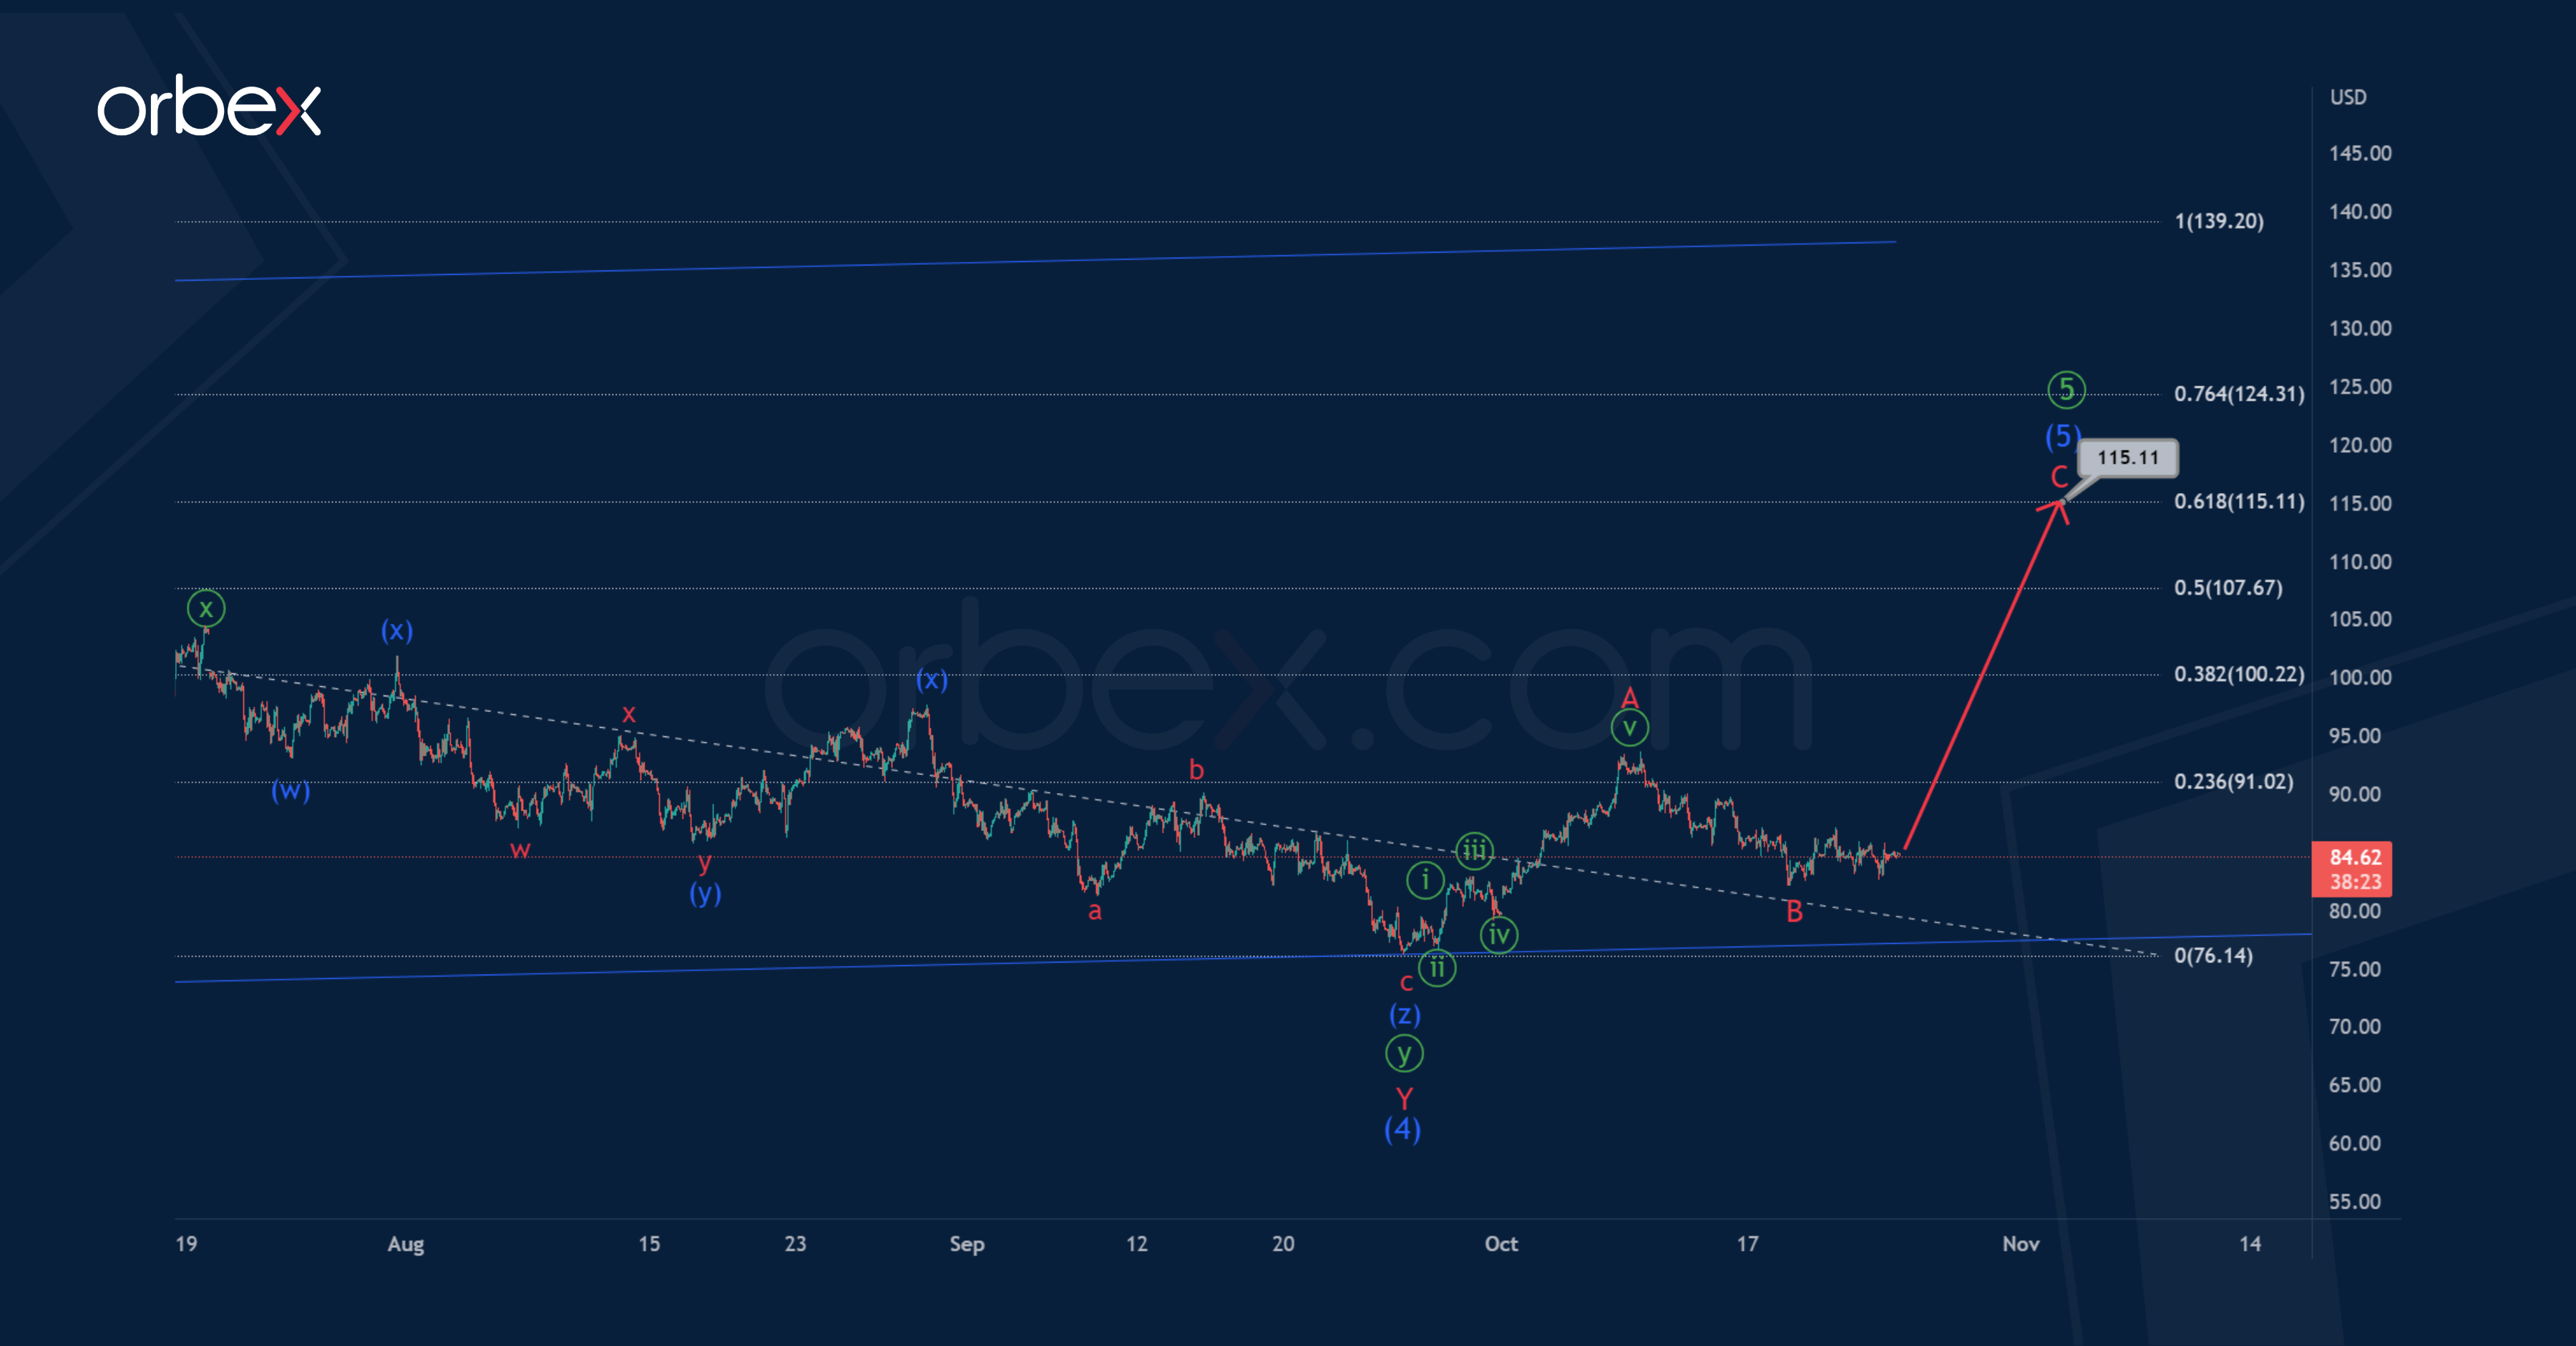
In the long term, USOIL seems to be forming a primary wave ⑤, which takes the form of an intermediate ending diagonal. On the 1H timeframe, we see its second half.
An intermediate correction (4) in the form of a minor double zigzag may have been completed recently.
Thus, at the moment the price may move within the intermediate wave (5). It is assumed that the intermediate wave (5) will take the form of a standard 3-wave zigzag A-B-C
The end of this construction is possible near 115.11. At that level, wave (5) will be at the 61.8% Fibonacci extension of impulse (3).
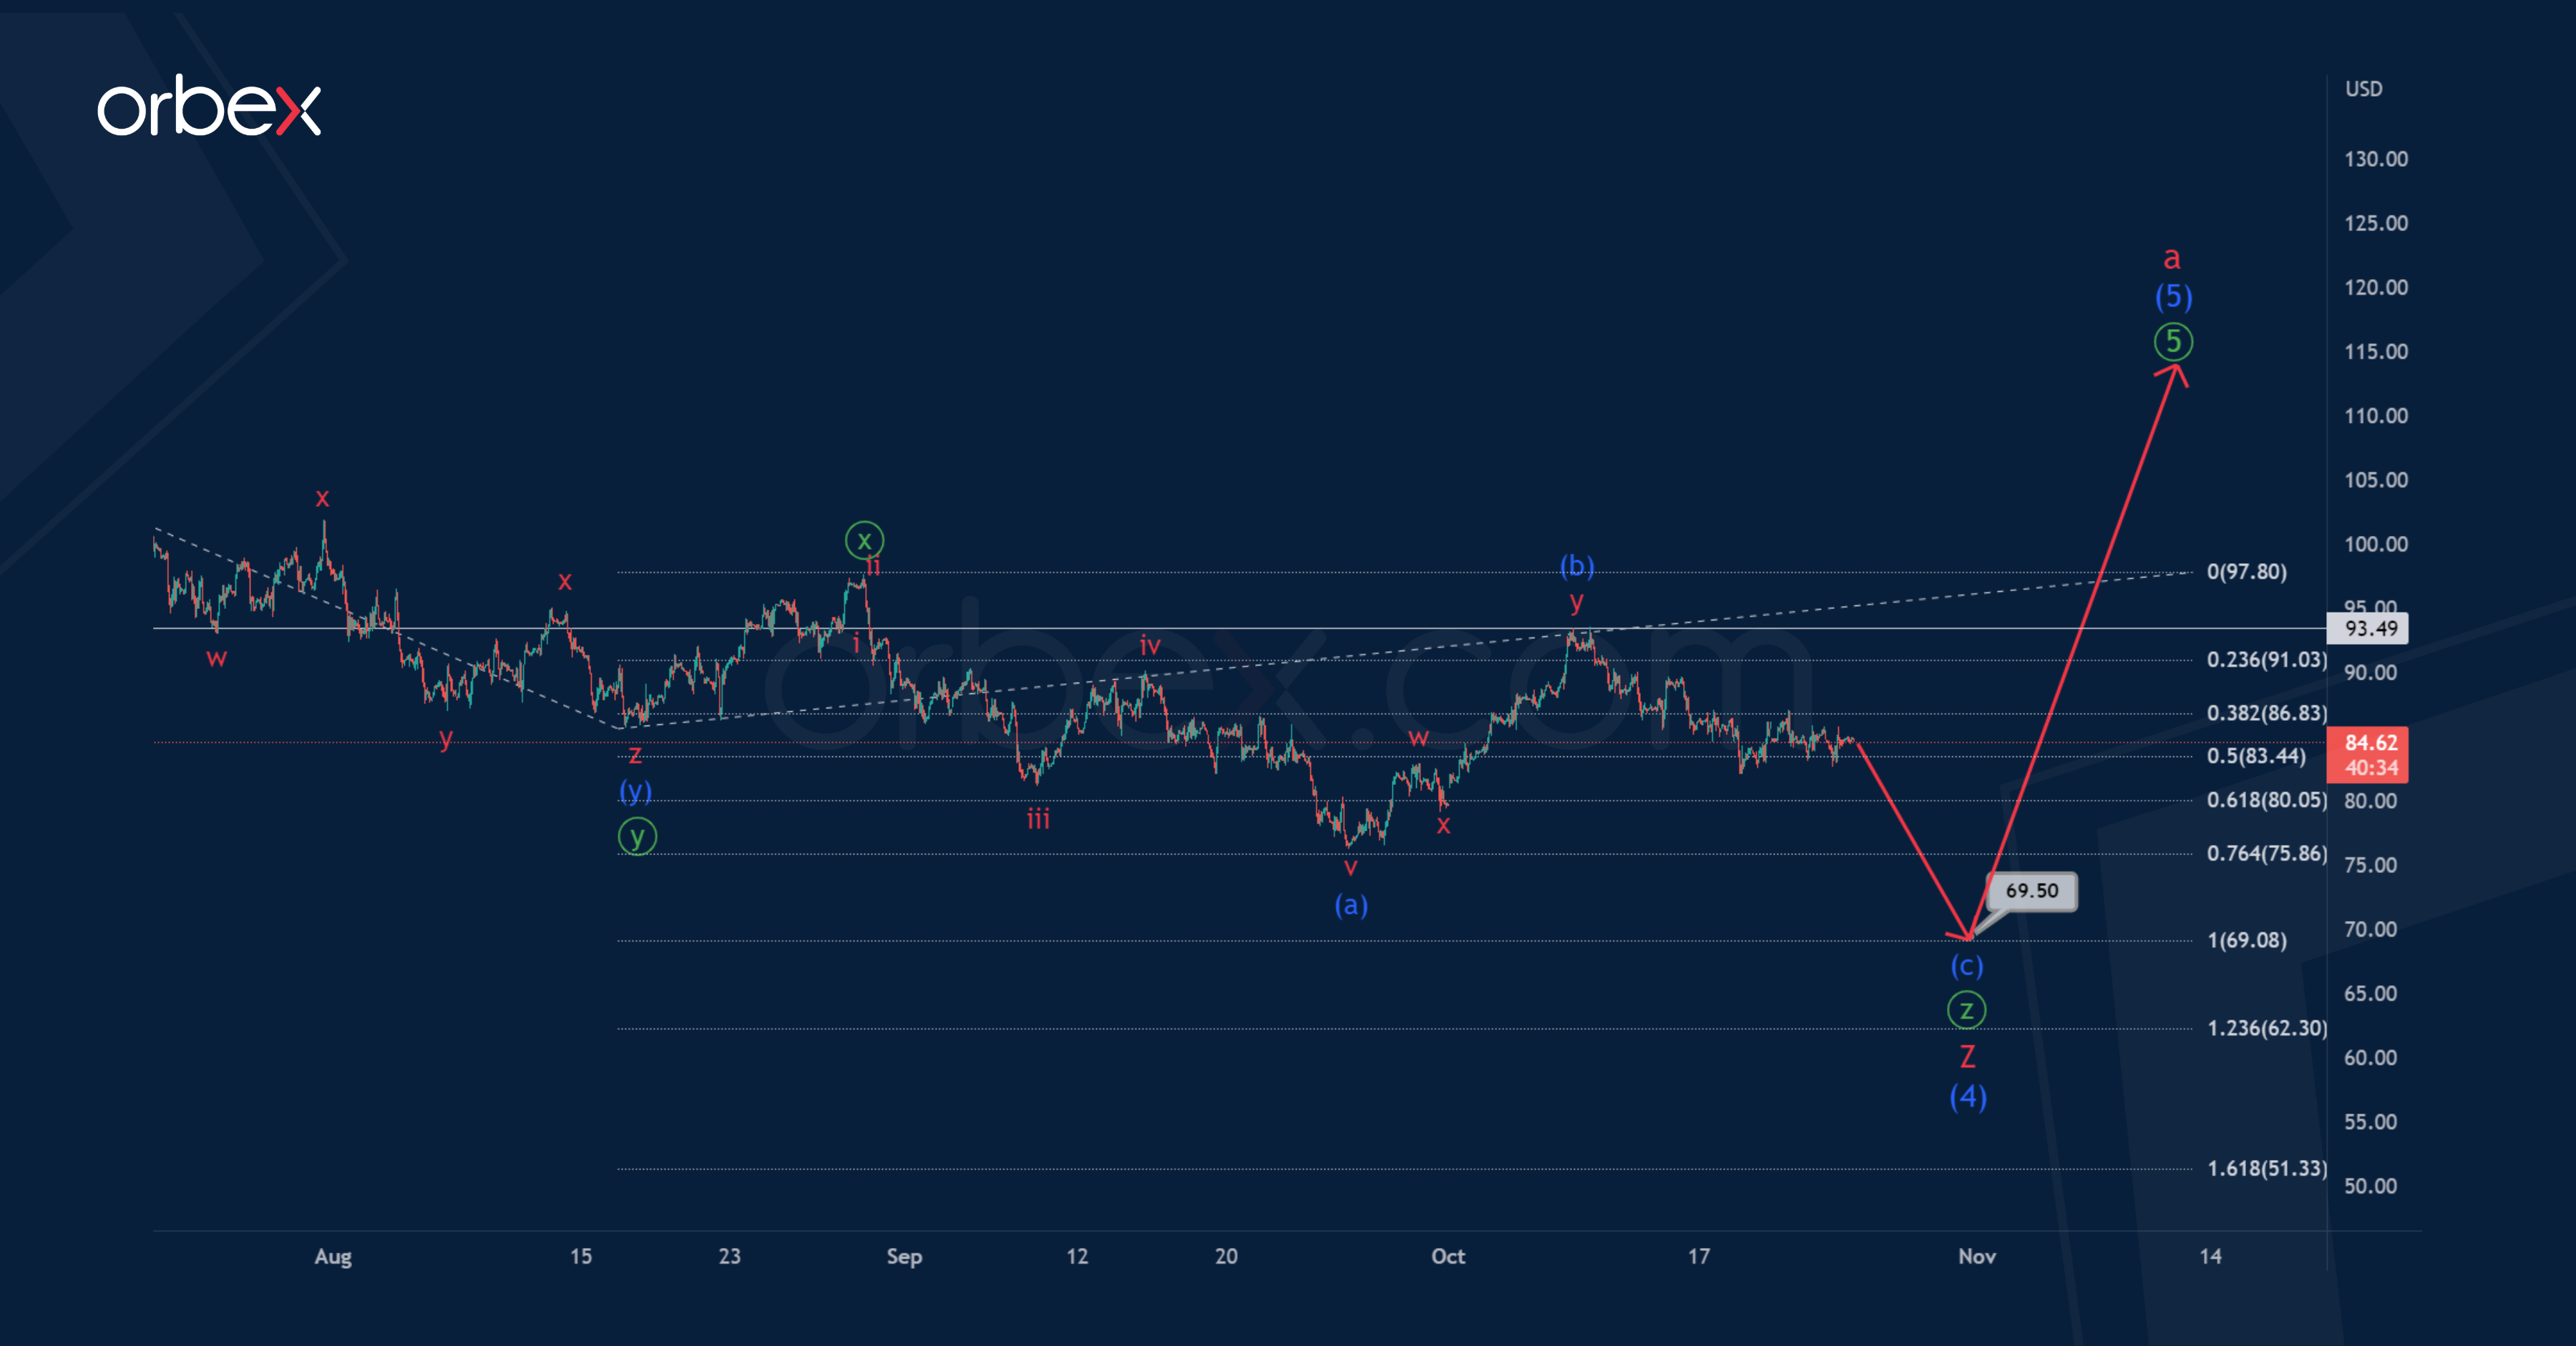
Alternatively, the construction of the intermediate correction (4) can be continued. Perhaps it will have the form of a triple zigzag W-X-Y-X-Z, where the minor sub-waves W-X-Y-X can be completed.
Thus, in the near future, the downward movement is expected to continue in the final actionary sub-wave Z, which can be completed in the form of a minute triple zigzag ⓦ-ⓧ-ⓨ-ⓧ-ⓩ.
The oil price may fall to 69.50, at which the minute waves ⓨ and ⓩ will be equal.
After reaching this level, the market is expected to grow above the maximum – 123.72.
Dow Jones 30 Gains Momentum
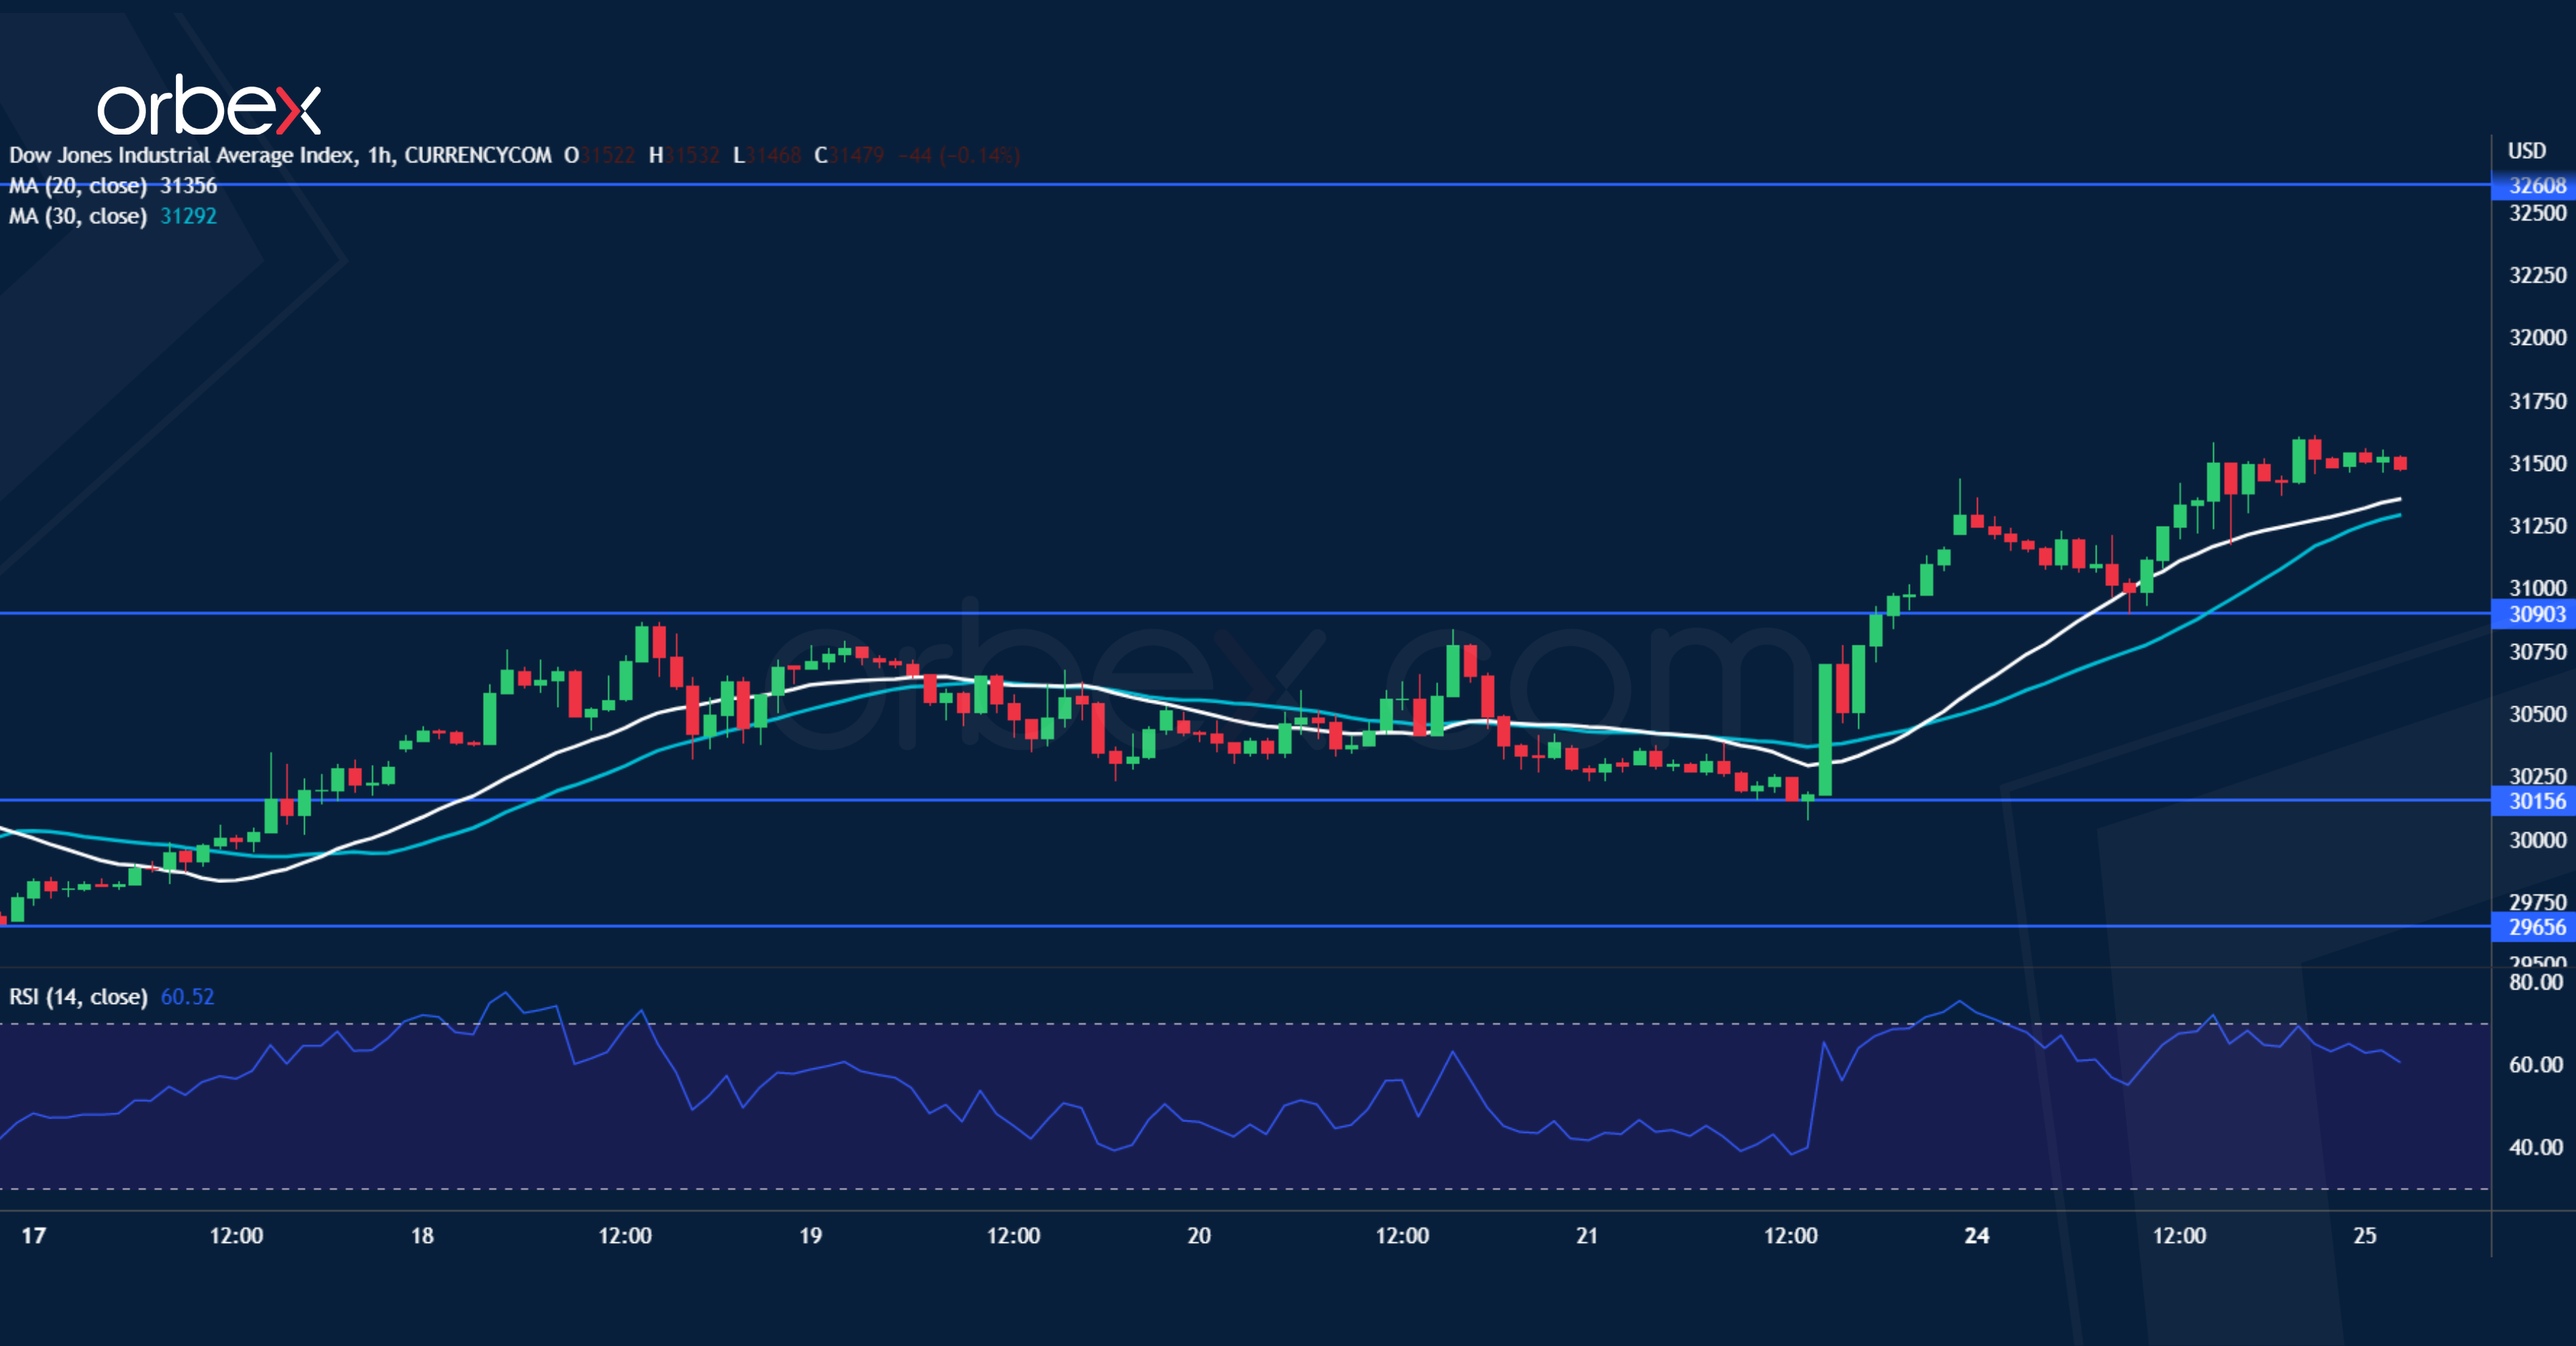
The Dow Jones 30 rallies as weaker US business activity in October rekindles hopes of a dovish Fed. From the daily chart’s perspective, a pop above the support-turned-resistance at 31000 is a sign of strong buying interest in the short-term. A series of higher lows may encourage the bulls to extend upwards, further squeezing the short side. After clearing 31300, the index is heading to September’s high at 32600. The RSI’s overbought condition may cause a limited retracement with 30900 as the first support.
EUR/GBP Heads Lower
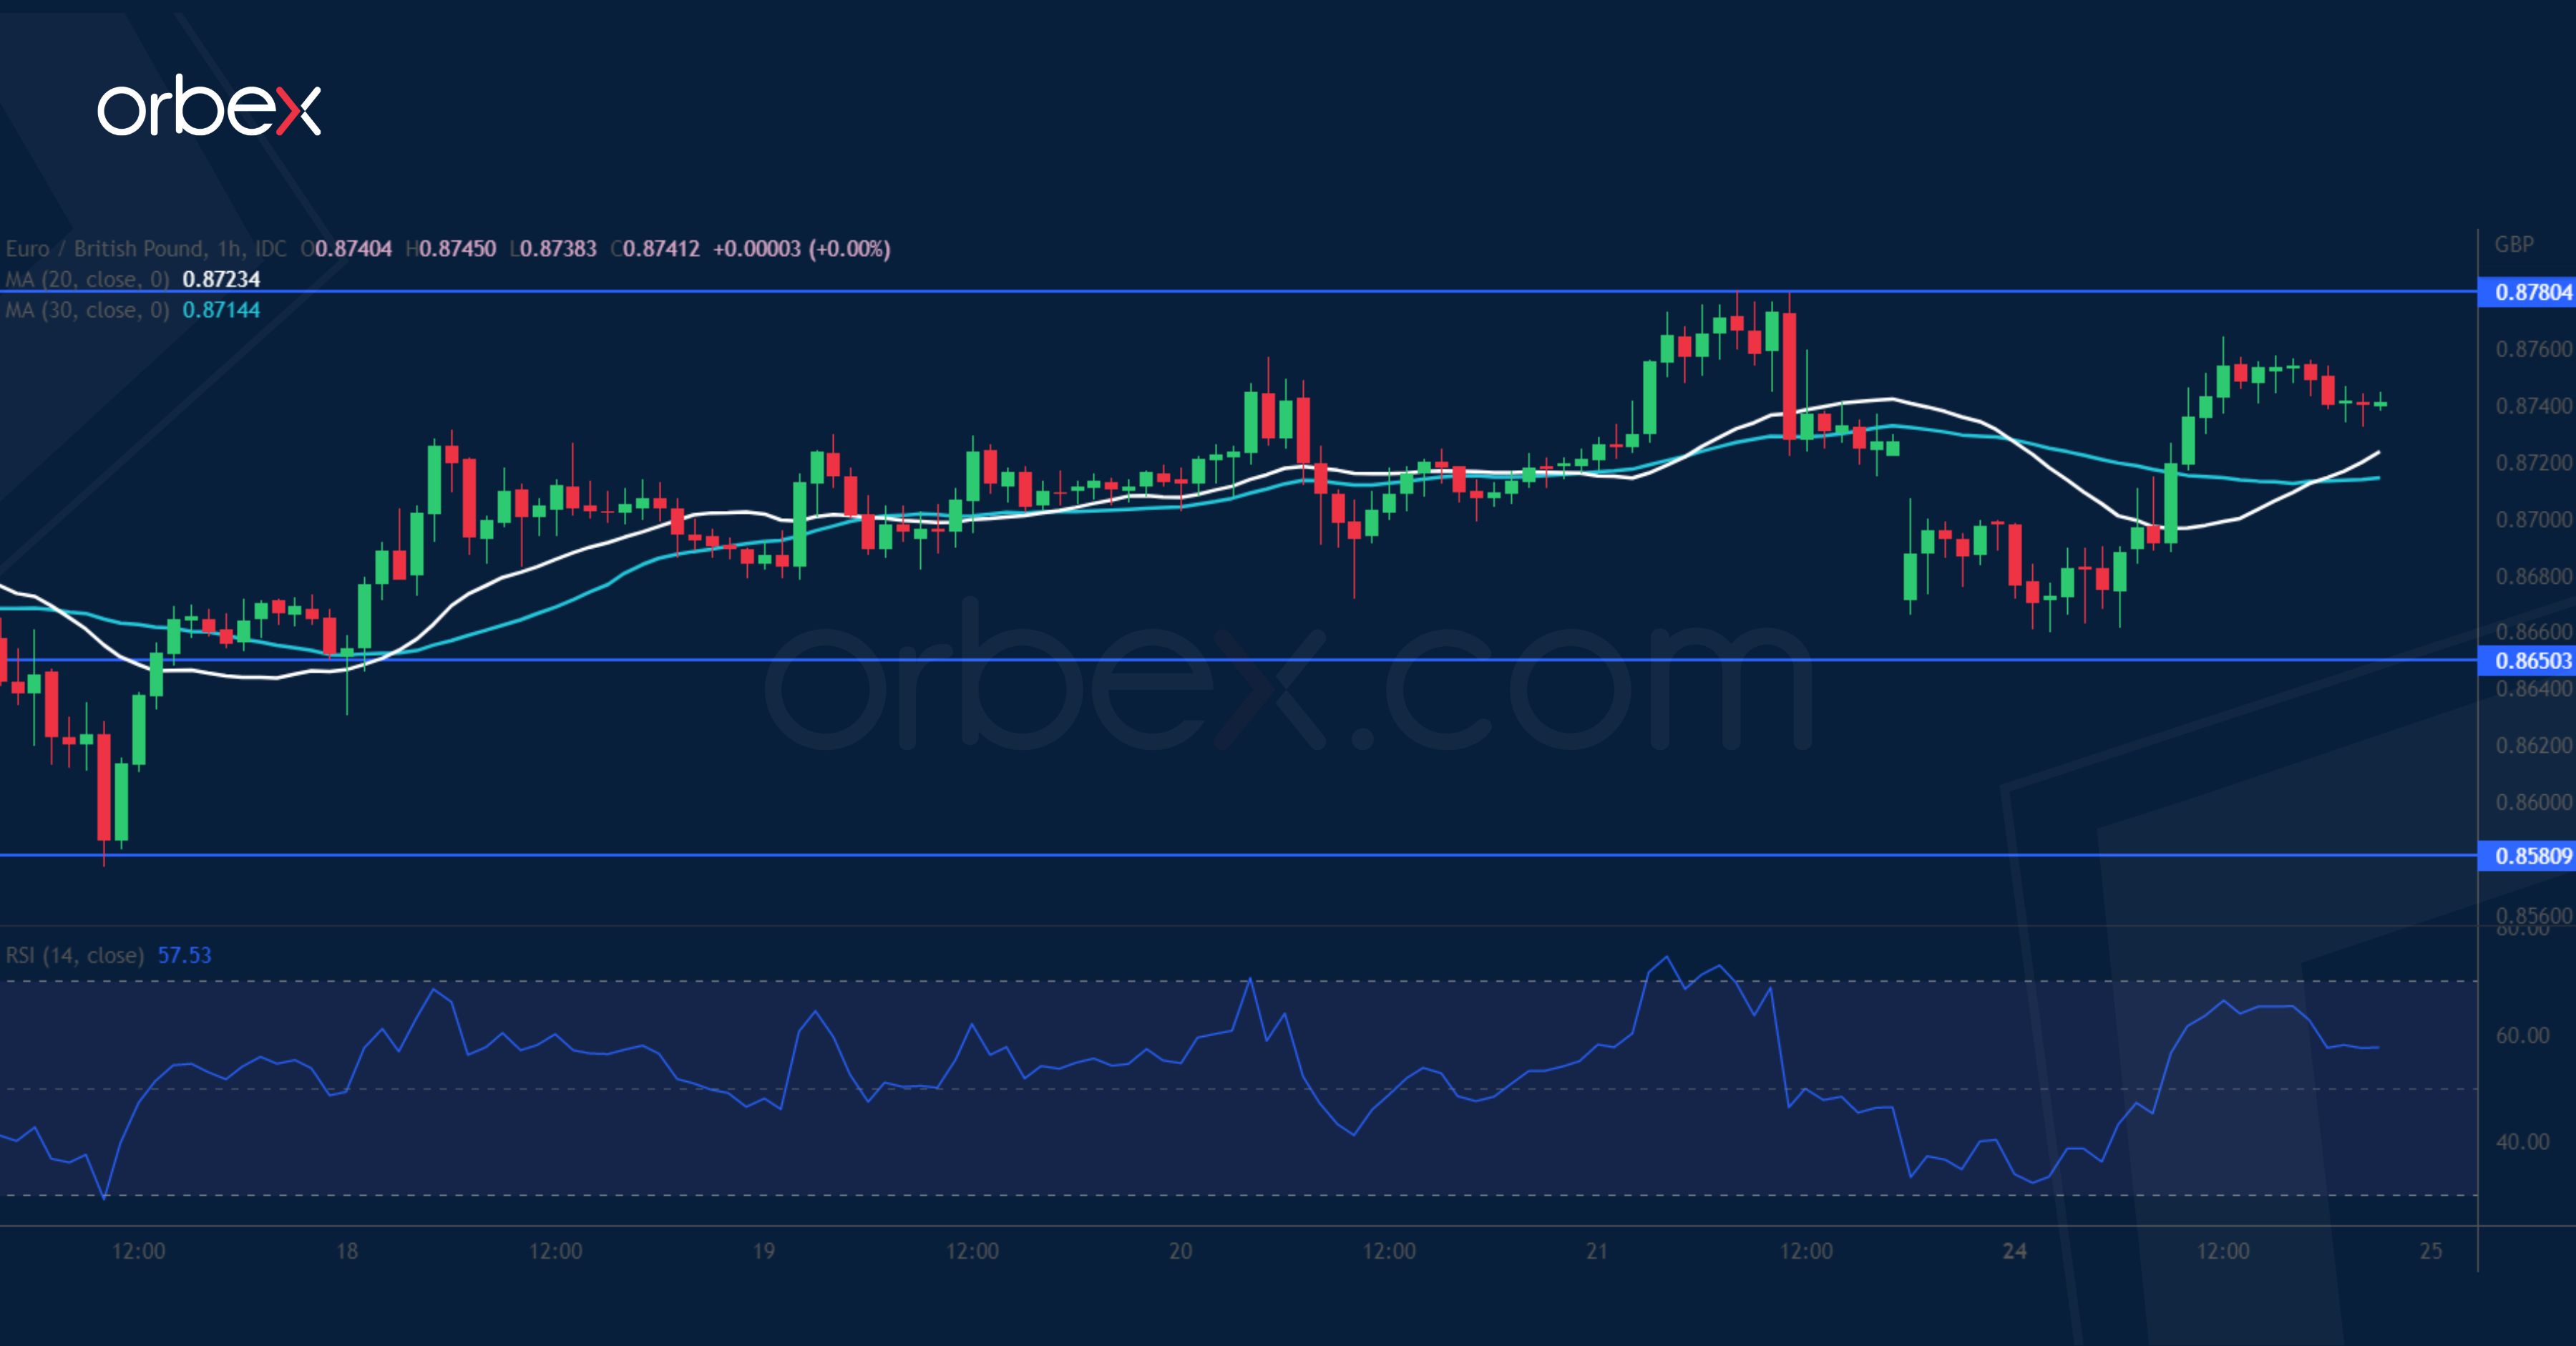
The pound weakens as traders stay wary of political and economic uncertainties in Britain. The rebound came under pressure at 0.8780 at the origin of a mid-August sell-off. A bearish MA cross on the daily chart suggests a shift in sentiment, and the euro could be vulnerable unless it clears the said resistance. A bullish breakout may trigger an extended rally above 0.8850. The demand zone between 0.8580 and 0.8650 is a major level to keep the single currency afloat, or a deeper correction might send it below 0.8450.
USD/CHF in Consolidation
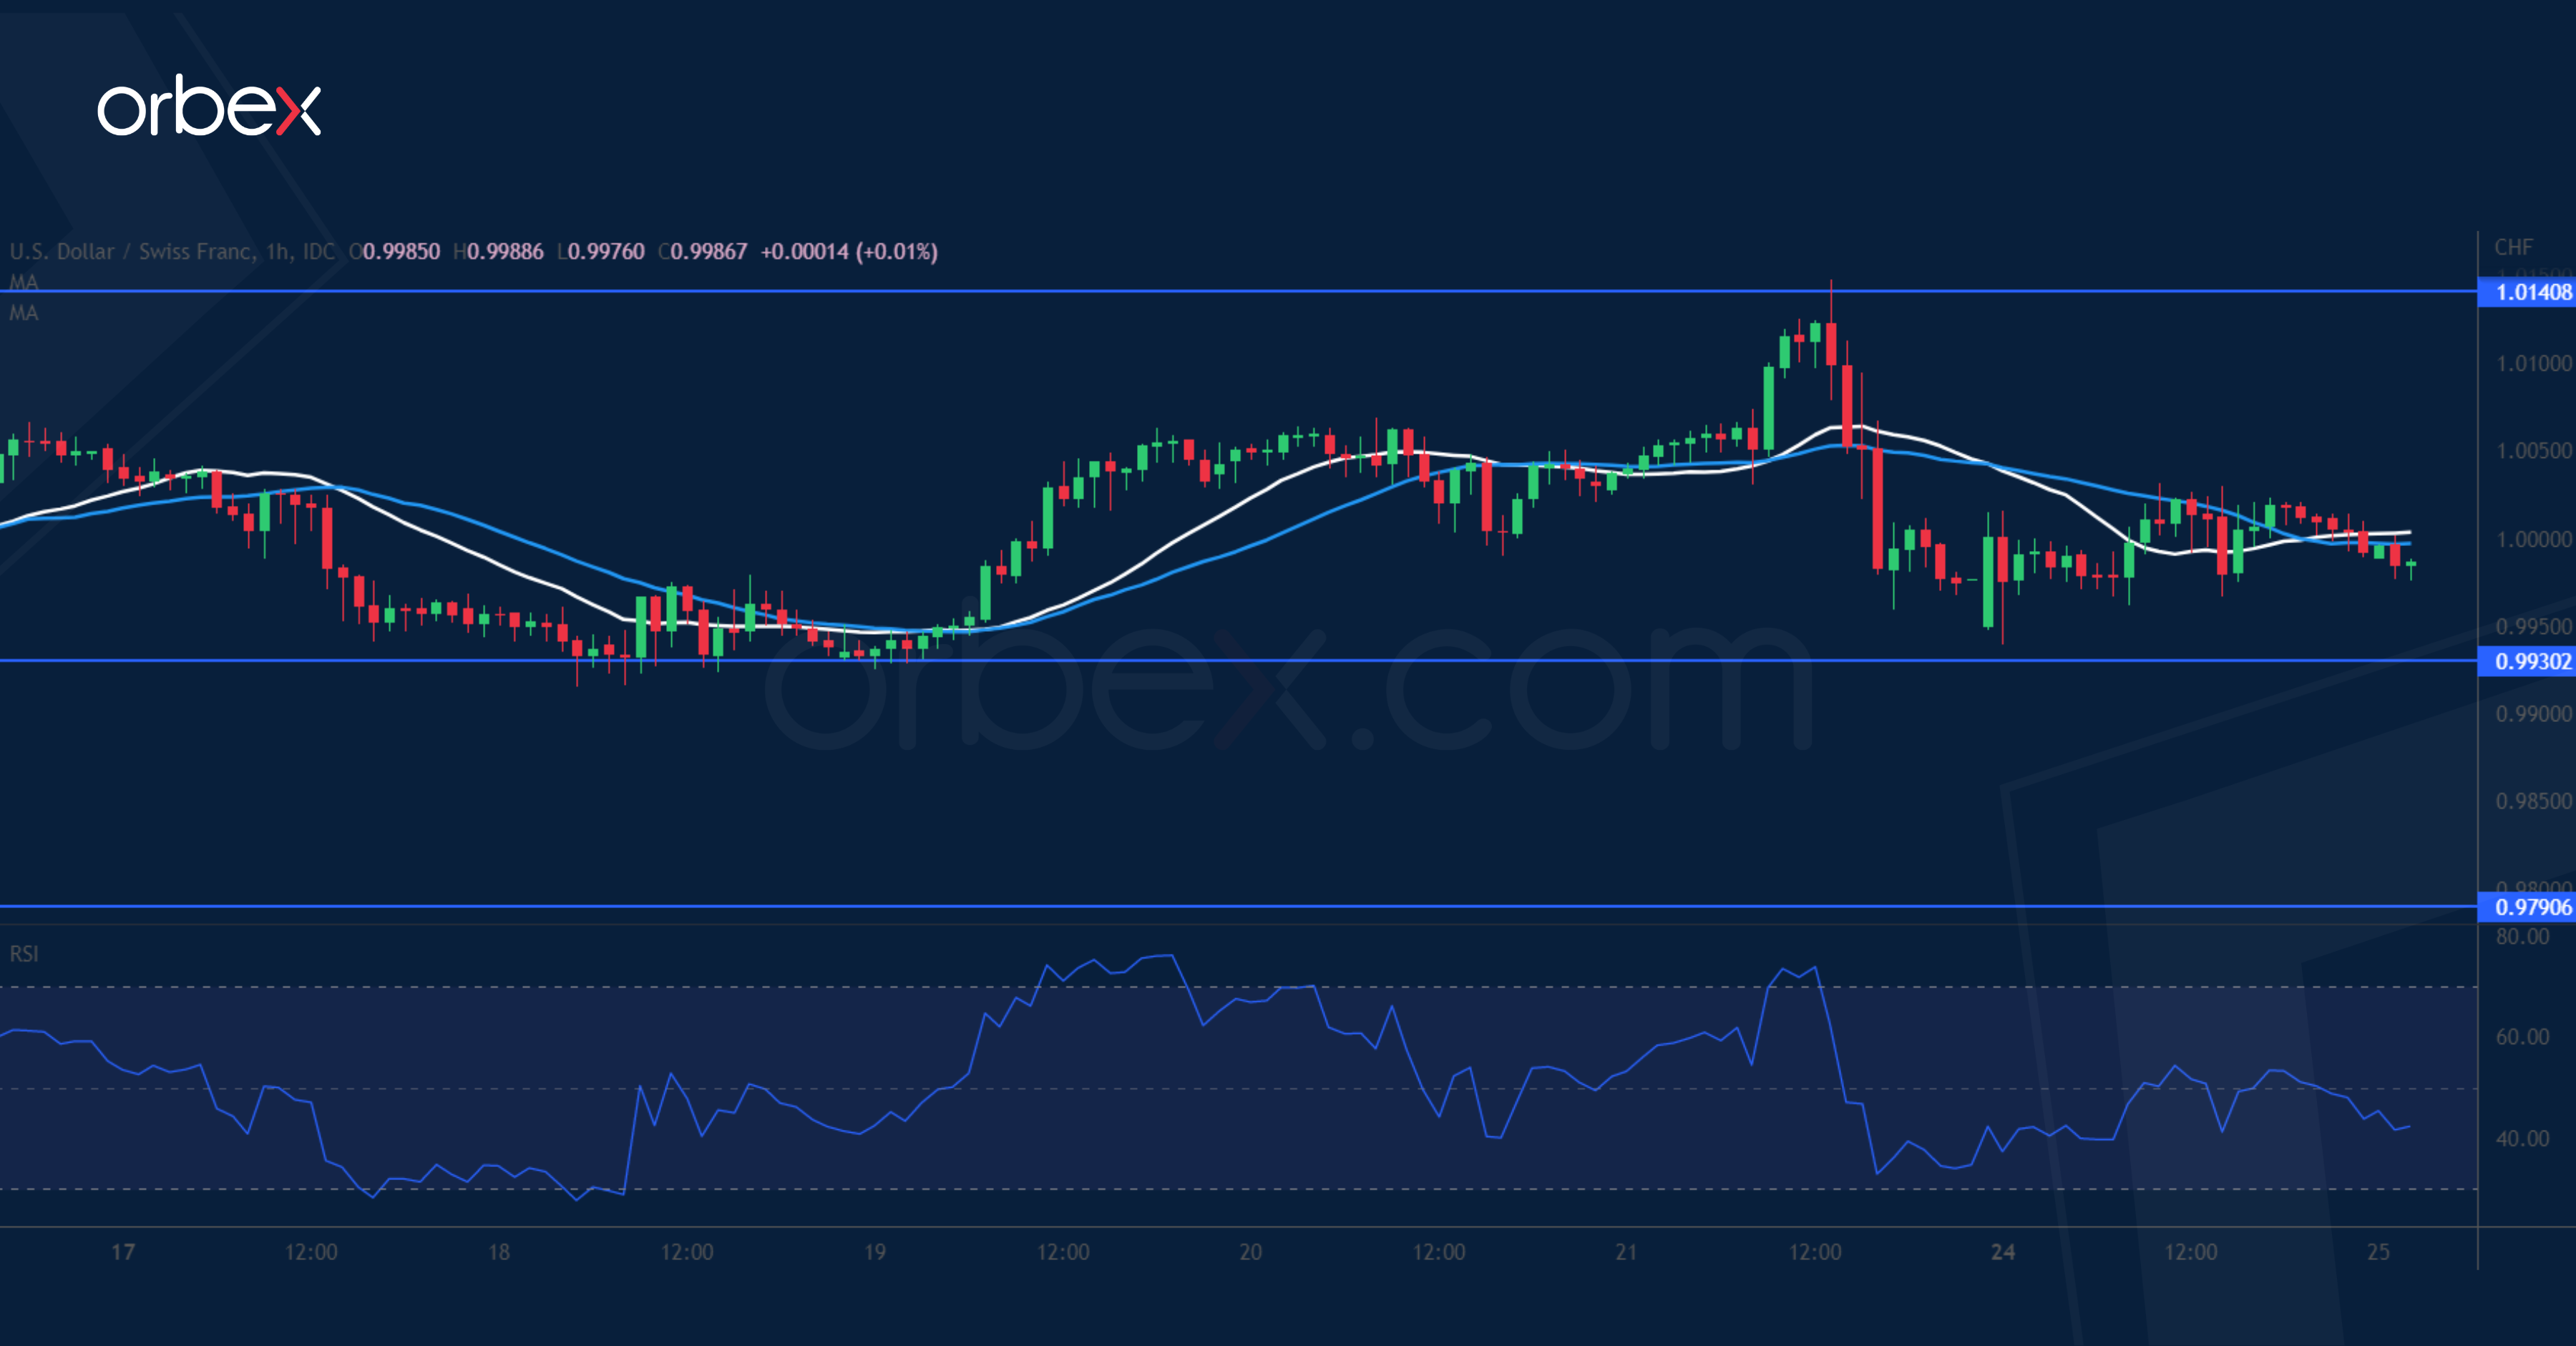
The US dollar stays muted over lacklustre manufacturing and services PMI. The bullish bias remains intact as the greenback consolidates its gains around parity. Buyers may see the sideways action as an opportunity to accumulate at a better price. 0.9930 at the base of the previous breakout coincides with the 20-day moving average, making it a congestion area. Further down, the daily support at 0.9790 would be the bulls’ second level of defence. A close above 1.0140 may attract momentum buying and send the pair towards 1.0300.
UK Money Markets Discount consecutive 75 bps Rate Hikes in Nov, Dec, Feb
Markets
UK Gilts hugely outperformed German Bunds and US Treasuries as it became clear that Rishi Sunak would become the next Prime Minister. The main move occurred at the start of trading after ex-PM Johnson dropped out of the race over the weekend before even getting in. UK yields fell around 30 bps across the curve. Sunak is rumoured to stick to the previous government’s October 31 deadline to present the long term fiscal outlook, allowing the Bank of England to take this into account when setting policy on November 3rd. Today’s speech by Bank of England chief economist could perhaps already give some insight in the central bank’s thinking. UK money markets currently discount consecutive 75 bps rate hikes at the November, December and February policy meetings. Sterling’s “relief rally” rapidly fainted with EUR/GBP closing at 0.8754.
US Treasuries ended 1.3 bps (3-yr) to 4.2 bps (30-yr) higher. We stick to our view that Treasuries’ are up for a correction higher on market talk (WSJ, Fed Daly) about the Fed slowing down it’s tightening pace from December onwards. Yesterday’s US PMI’s added a bit to this feeling with the composite dropping from 49.5 to 47.6 (vs 49.2 expected). On a sectoral level, the manufacturing PMI now fell below the 50 boom/bust mark (first time since June 2020) with the services PMI sinking deeper (46.6 from 49.3 vs 49.5 expected). The downward lurch in services activity was fuelled by the rising cost of living and tightening financial conditions. October saw a steep drop in demand for manufactured goods, meaning current output is only being maintained by firms eating into backlogs of previously placed orders. Chief business economist at S&P Global Market Intelligence Williamson, responsible for the surveys, says that there is an increased risk of economic contraction in Q4 while at the same time inflationary pressures remain stubbornly high. However, there are clearly signs that weakening demand is helping to moderate the overall rate of inflation, which should continue to fall in the coming months, especially if interest rates continue to rise.
The disappointing US PMI’s followed on the heels of weak numbers in EMU and the UK earlier on the day. They didn’t left instant traces on markets though. The German yield curve bull flattened with yields ending 3.8 bps (2-yr) to 10.4 bps (30-yr) lower. The same doji-like patterns that appeared on US charts on Friday, are now there for Germany as well. With Thursday’s ECB meeting approaching soon, the case for a short term correction is less strong than in the US though. EUR/USD closed a tad higher at 0.9874. Stocks gained up to 2% in Europe and 1.5% in the US. Bad economic news is good news… Today’s eco calendar probably won’t impact trading with German Ifo Business Climate, US consumer confidence and Richmond Fed Manufacturing.
News Headlines
Polish president Duda signed the extension of the anti-inflation shield to end 2022 into law yesterday. The measures include a reduced 8% VAT on fuels, an exemption for select fuels from a retail sales tax, keep a 0% VAT on fertilizers and food that was previously subject to a 5% VAT rate and hold excise taxes on electricity, some fuels and light heating oil at the minimum EU level. The decision was widely expected. Some policy members of the National Bank of Poland have already said it will be critical what will happen with the shield next year as it currently curbs some of the inflationary pressures. Inflation stood at 17.2% y/y in September – already the highest since 1996. Core measures came in at 10.7% y/y.
China’s central bank raised the so-called macro-prudential parameter for companies and bank’s cross-border financing from 1 to 1.25. Doing so allows them to borrow more from overseas and may enable more foreign capital to flow in. It is doing so at a time the (onshore) Chinese yuan tumbled to the lowest level since 2008 against the USD. The announcement also came shortly before the PBOC set the daily reference rate for the yuan at the weakest level since 2008. USD/CNY gaps higher at the Asian open, to 7.30.
GBP/JPY Daily Outlook
Daily Pivots: (S1) 165.84; (P) 167.82; (R1) 170.12; More...
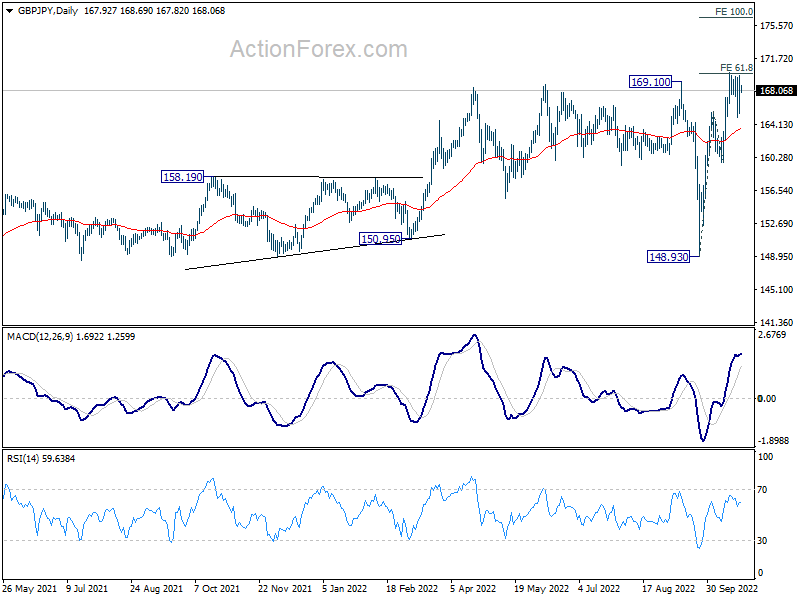
Intraday bias in GBP/JPY remains neutral as consolidation from 170.07 is extending. In case of another retreat, downside should be contained above 159.71 support to bring another rally. On the upside, sustained trading above 169.10 resistance will confirm larger up trend resumption.
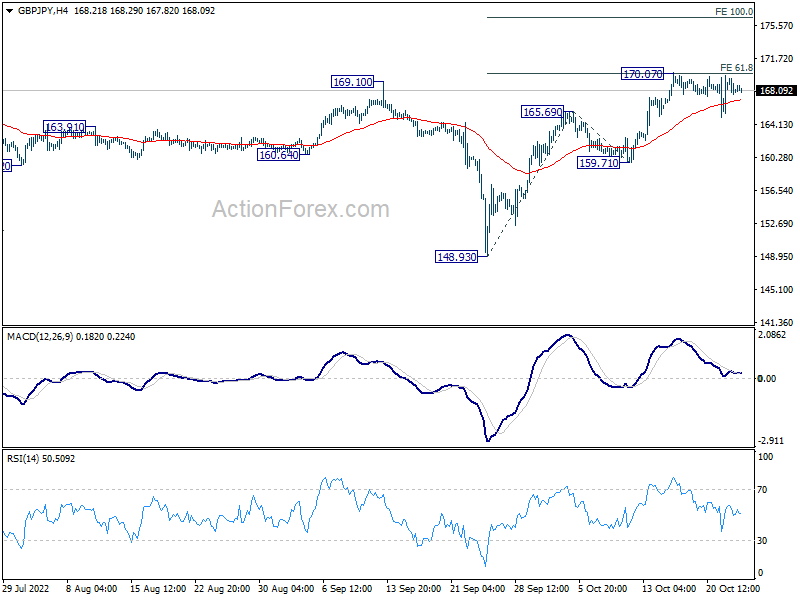
In the bigger picture, current development suggests that up trend from 123.94 (2020 low) is still in progress. Sustained break of 61.8% retracement of 195.86 (2015 high) to 122.75 (2016 low) at 167.93 will pave the way to retest 195.86 high. This will now remain the favored case as long as 148.93 support holds.
EUR/JPY Daily Outlook
Daily Pivots: (S1) 144.84; (P) 146.12; (R1) 148.45; More....
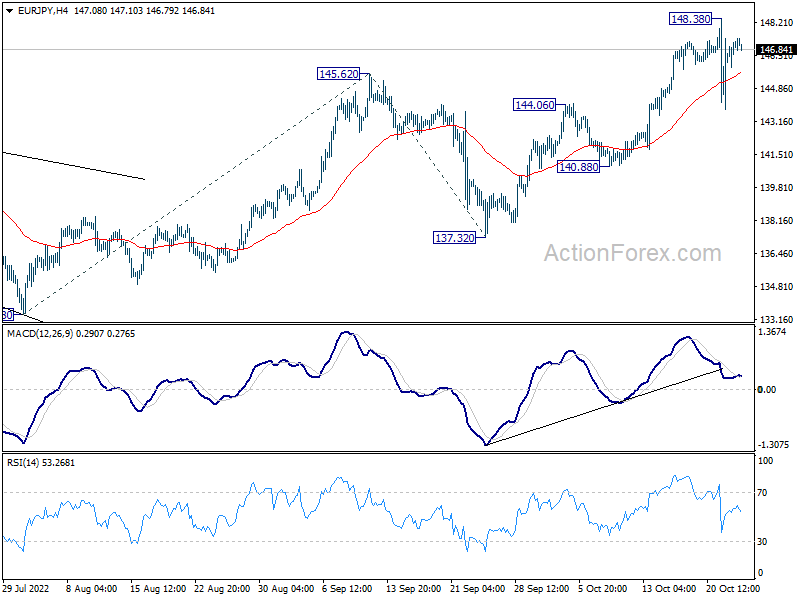
EUR/JPY is staying in consolidation below 148.48 short term top and intraday bias remains neutral. Downside of retreat should be contained by 140.88/144.06 support zone to bring another rally. Break of 148.38 will resume larger up trend to 100% projection of 133.38 to 145.62 from 137.32 at 149.56, which is close to 149.76 long term resistance.
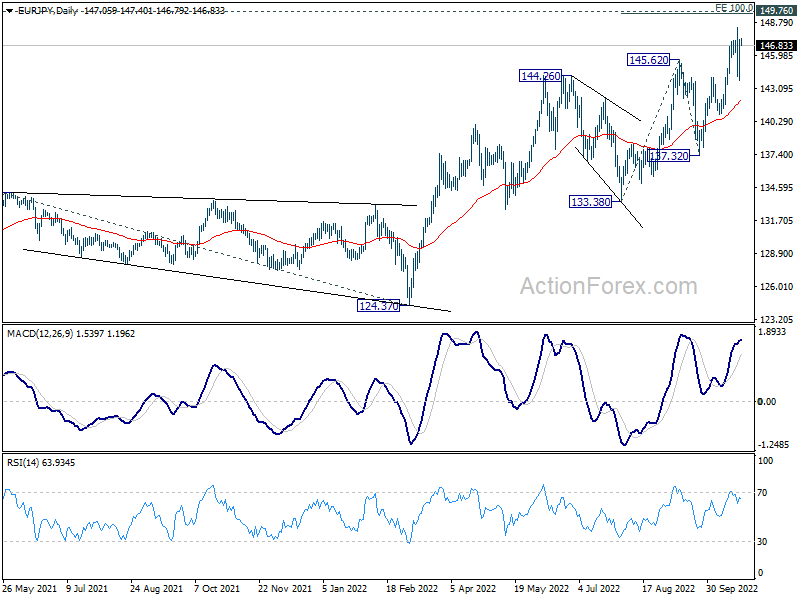
In the bigger picture, the up trend from 114.42 (2020 low) is still in progress for 149.76 (2014 high). Decisive break there will pave the way to 161.8% projection of 114.42 to 134.11 from 124.37 at 156.22. This will now remain the favored case as long as 137.32 support holds.
EUR/GBP Daily Outlook
Daily Pivots: (S1) 0.8689; (P) 0.8726; (R1) 0.8791; More...
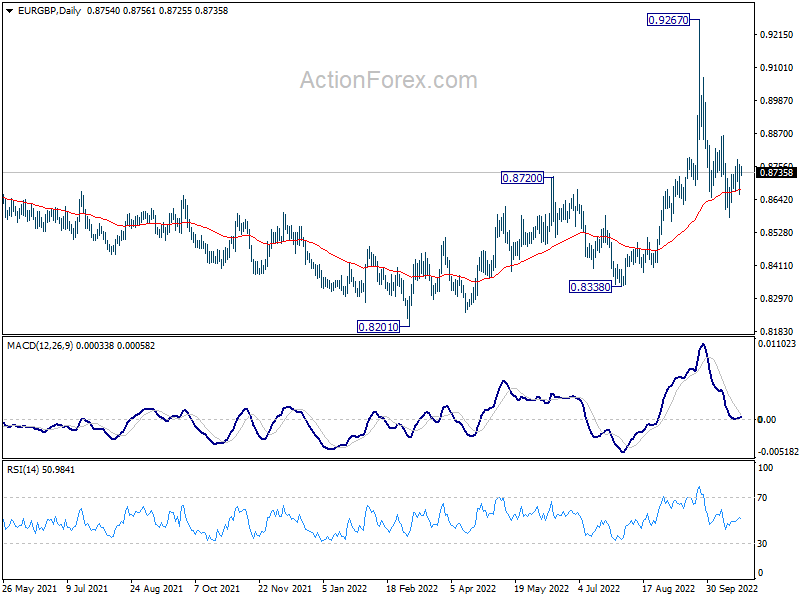
Range trading continues in EUR/GBP and intraday bias stays neutral. Further decline is expected with 0.8869 resistance intact. On the downside, break of 0.8577 will resume the fall from 0.9267, towards 0.8201/8388 support zone. However, firm break of 0.8869 will indicate that such decline has completed after defending 55 day EMA. Intraday bias will be back on the upside for retesting 0.9267 instead.
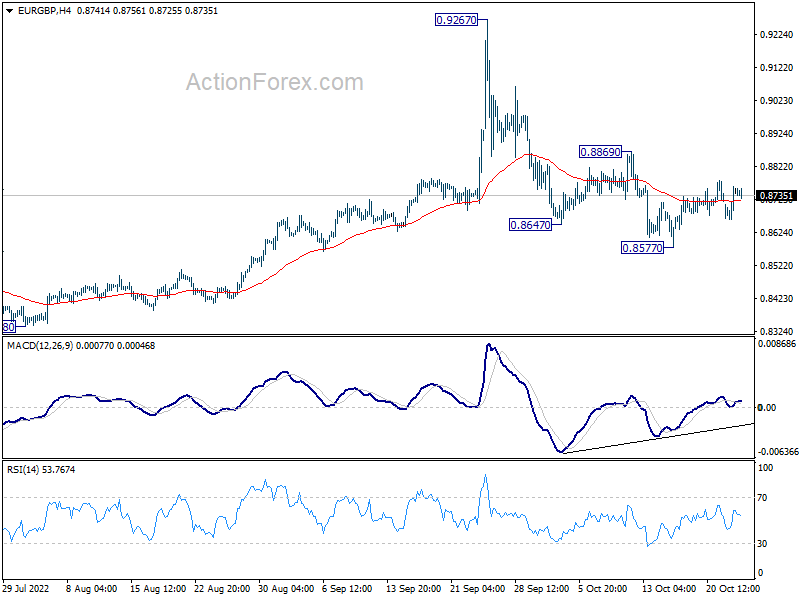
In the bigger picture, current development suggests that fall from 0.9267 is a down leg inside long term range pattern. Deeper fall could be seen towards 0.8201/8338 support zone. But strong support should be seen there to bring reversal.
EUR/AUD Daily Outlook
Daily Pivots: (S1) 1.5472; (P) 1.5589; (R1) 1.5764; More...
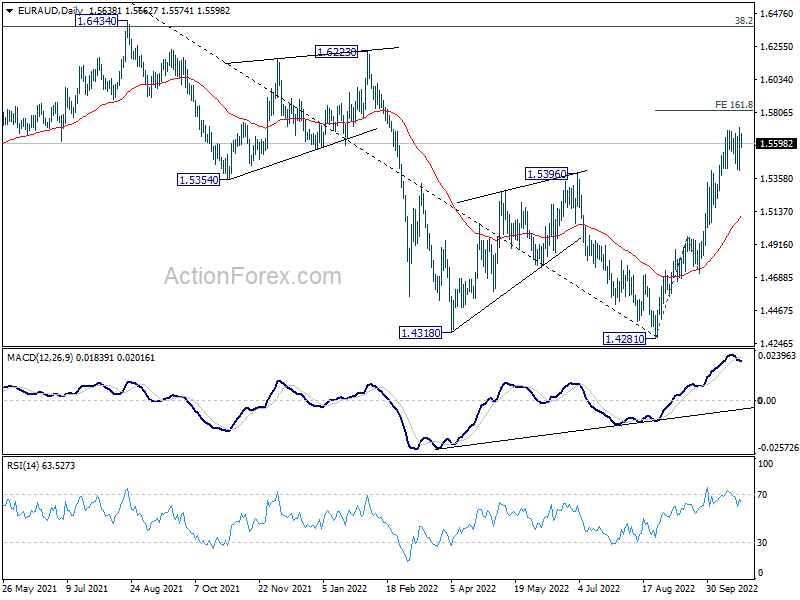
EUR/AUD edged higher to 1.5704 but quickly retreated. Intraday bias stays neutral first. Break of 1.5704 will resume the rally from 1.4281 to 161.8% projection of 1.4281 to 1.4965 from 1.4716 at 1.5823. However, on the downside, break of 1.5412 minor support will turn bias to the downside for deeper pull back.
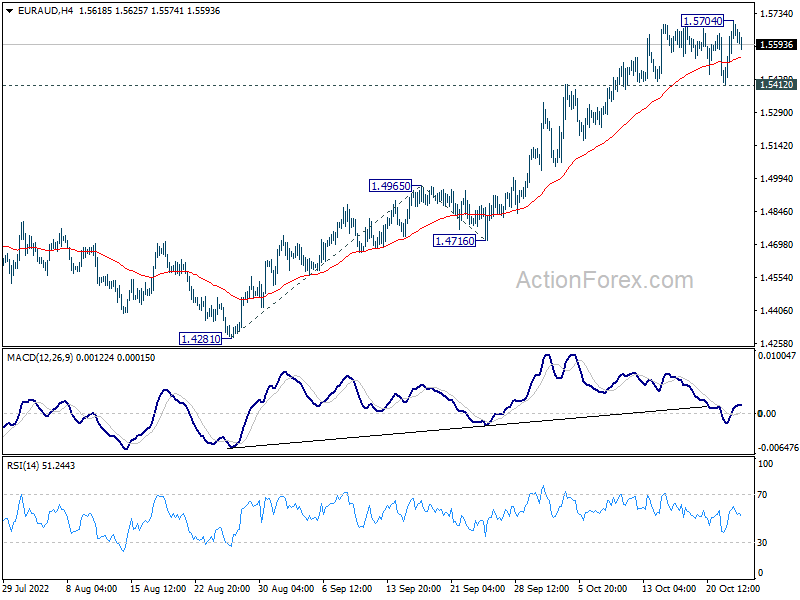
In the bigger picture, a medium term bottom should be in place at 1.4281, on bullish convergence condition in daily MACD. Further rise would be seen back to 1.6434 key resistance next. Break of 1.4965 resistance turned support is needed to indicate reversal. Otherwise, further rally will remain in favor.