Sample Category Title
EUR/CHF Daily Outlook
Daily Pivots: (S1) 0.9837; (P) 0.9865; (R1) 0.9910; More....
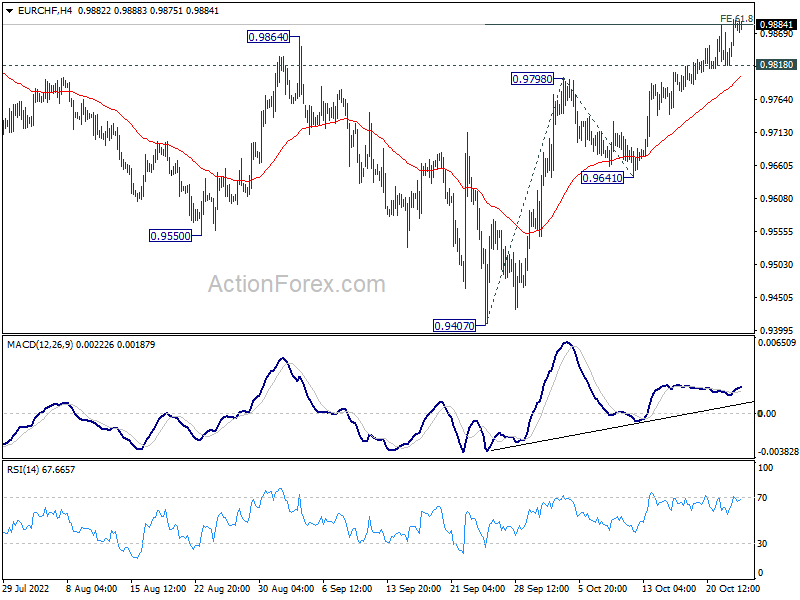
Intraday bias in EUR/CHF stays on the upside as rise from 0.9407 is extending. Sustained break of 61.8% projection of 0.9407 to 0.9798 from 0.9641 at 0.9883 will solidify the case of medium term bottoming. Further rally should then be seen to 100% projection at 1.0032. On the downside, however, break of 0.9818 minor support will turn intraday bias neutral first.
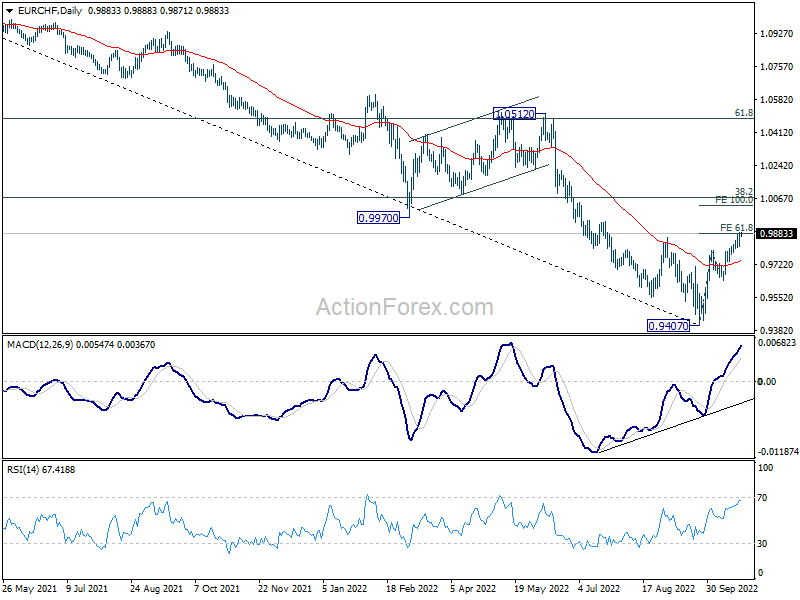
In the bigger picture, considering bullish condition in daily MACD, firm break of 0.9864 resistance will confirm medium term bottoming at 0.9407. Stronger rally should then be seen to 55 week EMA (now at 1.0128), even as a corrective rebound. Nevertheless, rejection by 0.9864 will bring down trend resumption through 0.9407 next.
EUR/USD Daily Outlook
Daily Pivots: (S1) 0.9821; (P) 0.9860; (R1) 0.9913; More...
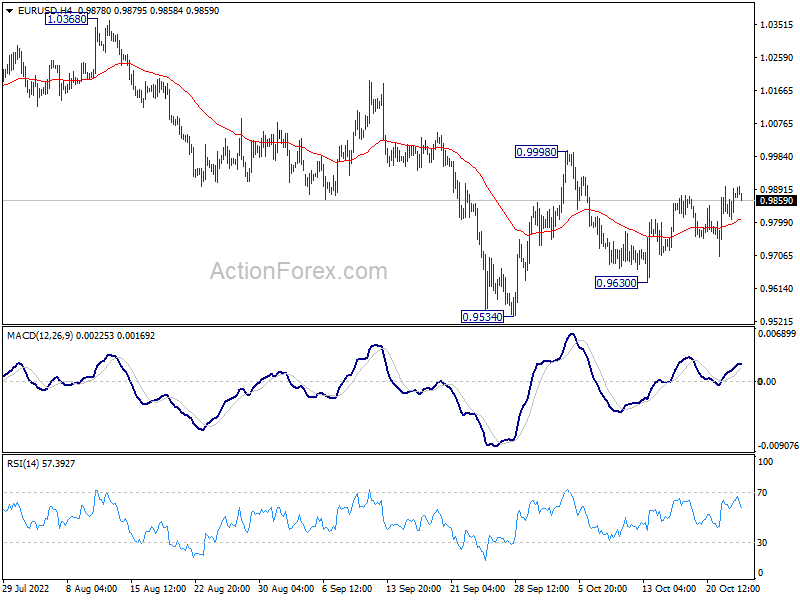
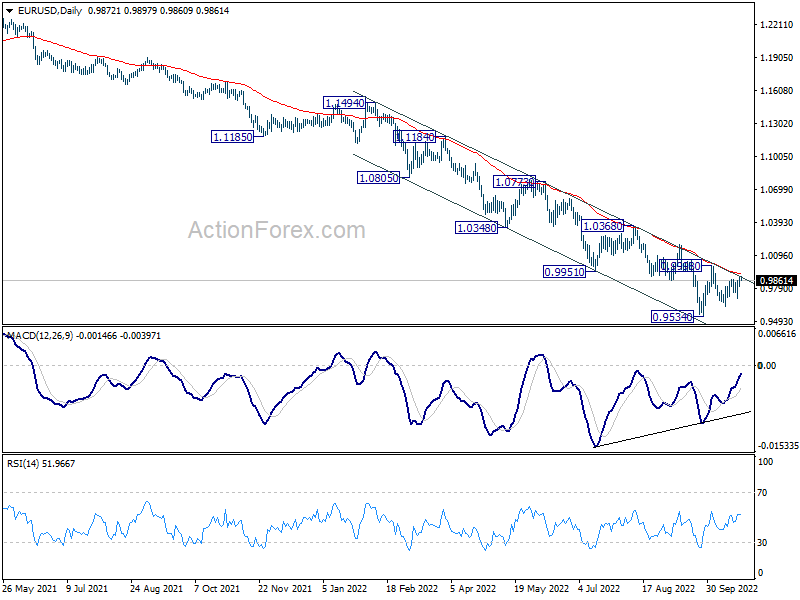
Intraday bias in EUR/USD stays neutral at this point. And further decline will remain in favor with 0.9998 resistance intact. On the downside, break of 0.9630 bring retest of 0.9534 first. Firm break there will resume larger down trend. However, break of 0.9998 resistance will resume the rise from 0.9534, and carry larger bullish implications.
In the bigger picture, down trend from 1.6039 (2008 high) is still in progress. Next target is 100% projection of 1.3993 to 1.0339 from 1.2348 at 0.8694. In any case, break of 0.9998 resistance is needed to be the first sign of medium term bottoming. Otherwise, outlook will stay bearish even with strong rebound. However, considering bullish convergence condition in daily MACD, firm break of 0.9998 will confirm medium term bottoming, and bring further rise back to 1.0368 resistance first.
GBP/USD Daily Outlook
Daily Pivots: (S1) 1.1222; (P) 1.1316; (R1) 1.1373; More...
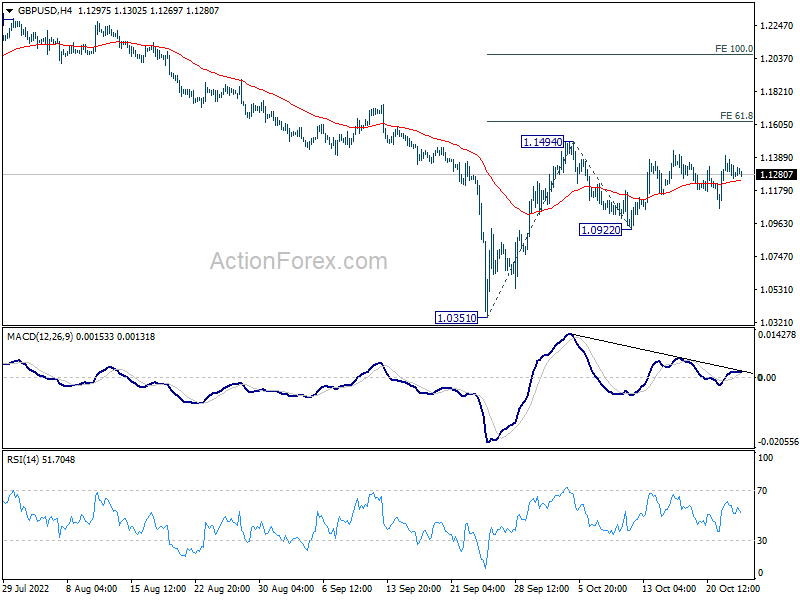
Intraday bias in GBP/USD stays neutral and further rally is in favor with 1.0922 minor support intact. On the upside, break of 1.1494 will resume the rise from 1.0351 to 61.8% projection of 1.0351 to 1.1494 from 1.0922 at 1.1628. On the downside, below 1.0922 will turn bias back to the downside for 1.0351 low instead.
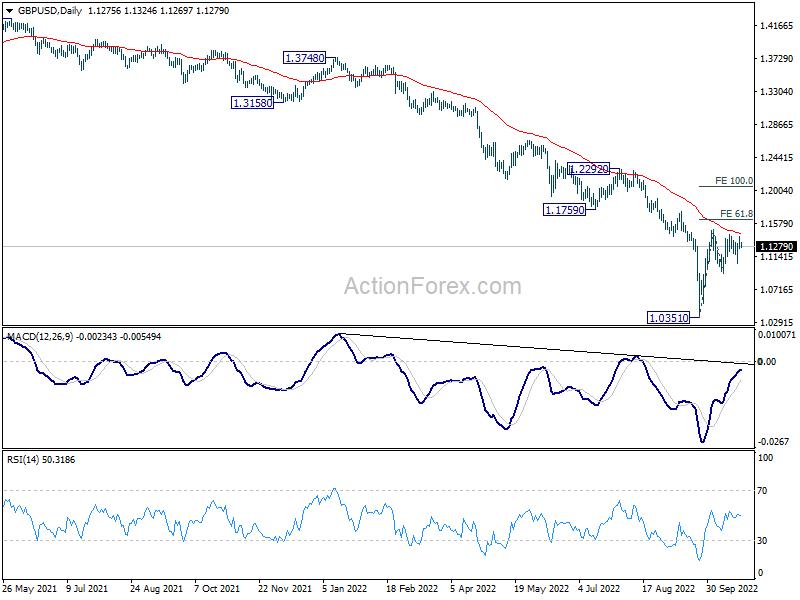
In the bigger picture, fall from 1.4248 (2018 high) is resuming long term down trend from 2.1161 (2007 high). Next target is 100% projection of 2.1161 to 1.3503 from 1.7190 at 0.9532. There is no scope of a medium term rebound as long as 1.1759 support turned resistance holds.
USD/CHF Daily Outlook
Daily Pivots: (S1) 0.9961; (P) 0.9996; (R1) 1.0047; More...
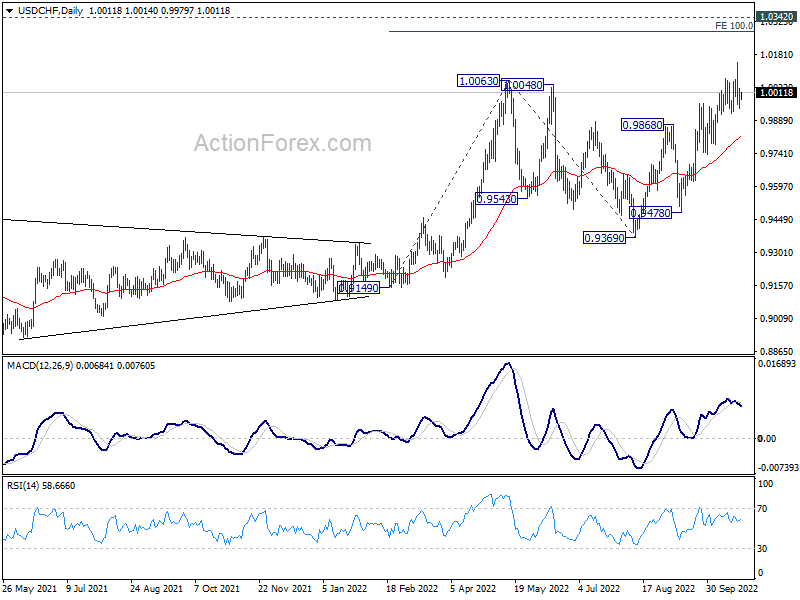
Intraday bias in USD/CHF remains neutral as consolidation from 1.0146 is extending. Deeper retreat cannot be ruled out, but downside should be contained above 0.9799 support. On the upside, break of 1.0146 will resume larger up trend to 1.0283 projection level.
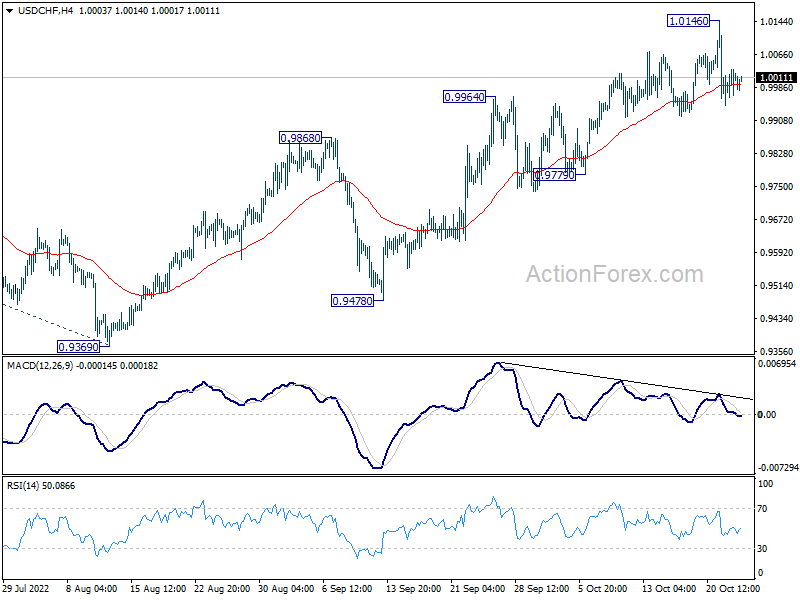
In the bigger picture, current development suggests that up trend from 0.8756 (2021 low) is still in progress. Sustained break of 1.0063 will target 100% projection of 0.9149 to 1.0063 from 0.9369 at 1.0283, and then 1.0342 (2016 high). For now, this will remain the favored case as long as 0.9779 support holds, even in case of deep pull back.
USD/JPY Daily Outlook
Daily Pivots: (S1) 146.49; (P) 148.10; (R1) 150.62; More...
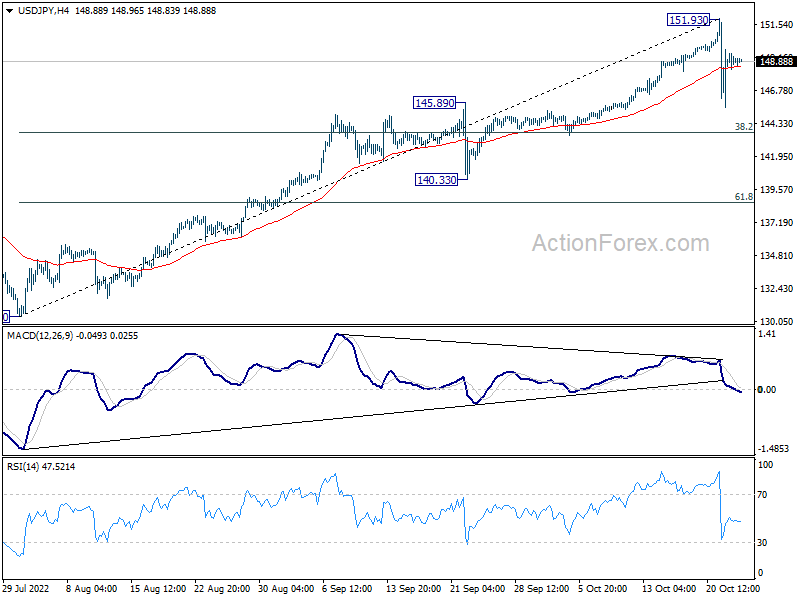
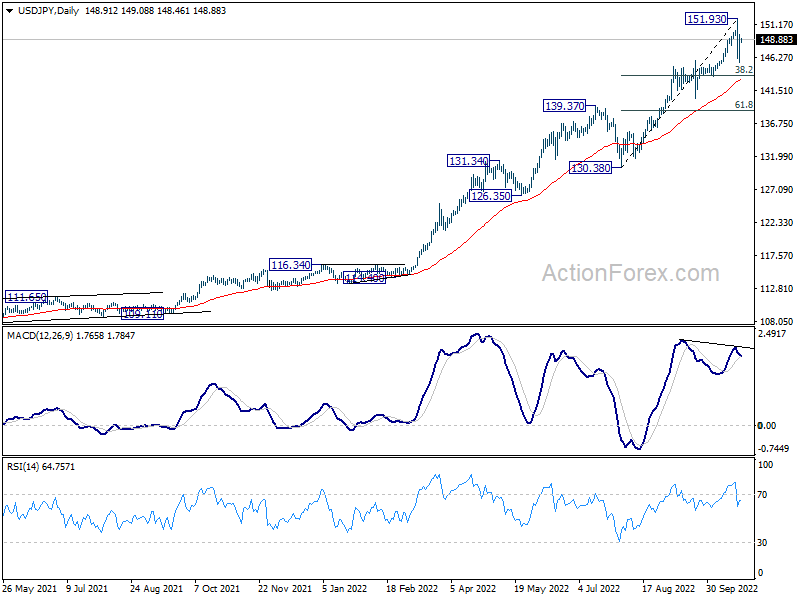
Range trading continues in USD/JPY and intraday bias remains neutral. More consolidation would be seen for the near term. In case of another fall, downside should be contained by 38.2% retracement of 130.38 to 151.93 at 143.69 to bring rebound. Upside of rally attempt should be limited by 151.39 resistance.
In the bigger picture, up trend from 101.18 is still in progress, as part of the whole up trend from 75.56 (2011 low). 147.68 (1998 high) was already met and there is no clearly sign of topping yet. In any case, break of 140.33 support is needed to be the first sign of medium term topping. Otherwise, further rise is in favor to next target at 160.16 (1990 high).
AUD/USD Daily Report
Daily Pivots: (S1) 0.6253; (P) 0.6333; (R1) 0.6392; More...
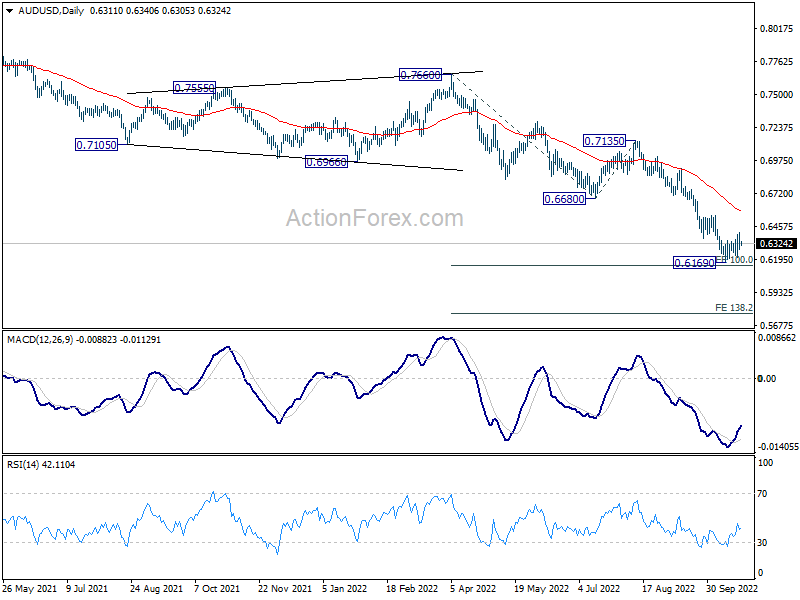
AUD/USD's recovery lost momentum and intraday bias is turned neutral again. Stronger rise could still be seen towards 0.6539. And firm break there will target 55 day EMA (now at 0.6602). However, firm break of 0.6169 support will now confirm down trend resumption.
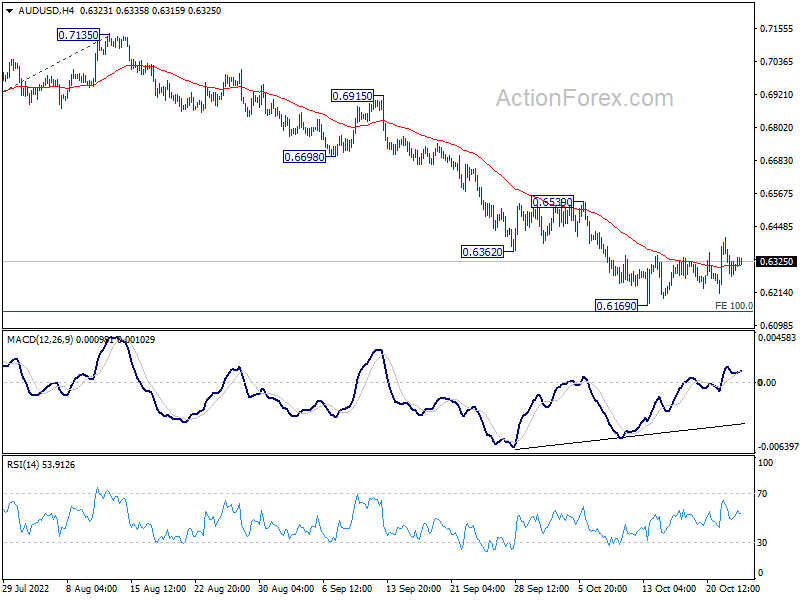
In the bigger picture, down trend form 0.8006 (2021 high) is expected to continue as long as 0.6680 support turned resistance holds. Next target is 0.5506 low. Medium term momentum will now be closely monitored to gauge the chance of break of 0.5506.
Ready for Rishi
After both Boris Johnson and Penny Mordaunt pulled out of the British PM race, Rushi Sunak cried victory on Monday afternoon, and markets cried ‘Ready for Rishi’.
The British sovereign bonds posted one of the biggest gains on record, the 10-year gilt yield tanked 8.50%, the 30-year yield dived 8.40%, sterling gained, but Cable remained offered near its 50-DMA, that stood around 1.14 level yesterday.
In plain English, it means that investors bet that Rishi Sunak could restore confidence and credibility that the country lost in just about 6 weeks under Liz Truss’ disastrous rule, but there is a lot to do still.
One thing is positive, though. Sunak has an opposite view on how to do things compared to Liz Truss. While Truss aimed for big spending and energy credits, Sunak opts for financial austerity, as the country’s debt-to-GDP went through the roof due to the pandemic spending. Therefore, Sunak wants to reduce debt - of course at a very bad time with the war and the energy crisis.
But that’s the thing! If he had become PM 6 weeks earlier, he would’ve seen political opposition to his austere point of view regarding the country’ finances. Yet today, Liz Truss and her mini budget’s massive failure gives him reason, the much-needed support of the market, and some political support as well, as many colleagues have seen that the idea of big spending pushed the country into a historical financial chaos.
Xi didn’t see the same enthusiasm
Investors loved seeing Sunak become the new UK Prime Minister, they, however, hated seeing Xi Jinping confirm a third term.
Nasdaq’s Golden Dragon China index lost more than 20% yesterday and closed the session more than 14% down. Direxion’s FTSE China Bear times 3 ETF jumped almost 30% in the session.
An analyst at JP Morgan said the market action is ‘disconnected from fundamentals’ and could present a dip buying opportunity. But one needs solid nerves to go long in Chinese assets right now.
Slowing
PMI data revealed yesterday did little good to the mood in Europe. The composite PMI fell to 47.1, which is the lowest level since April 2013. And unsurprisingly, the worst downturn was seen in manufacturing, especially in energy intensive sectors.
European natural gas prices fell below 100 euro per megawatt-hour thanks to unusually warm October and projections of a mild winter. But a mild winter alone can’t save the day in Europe. Growth is slowing, the European Central Bank (ECB) is tightening, while the single currency remains weak. The EURUSD is again testing the 50-DMA offers to the upside, near 0.99 level. And only the dollar bulls could decide whether the euro could gain some more field against the greenback.
In the US, the services sector saw a sharp, and an unexpected decline to 46.6, from 49.3 printed a month earlier, and 49.6 expected by analysts.
Japanese core CPI advanced to 2% versus 1.9% expected by analysts. The dollar-yen trades touch below the 149 mark after the Bank of Japan (BoJ) intervened to slowdown the depreciation in yen.
But the BoJ’s neutral policy stance could hardly prevent the yen from falling further against the US dollar, therefore, the outlook remains tilted to the upside for the USDJPY, while the risk of further BoJ intervention looms.
Alphabet & Microsoft rely on cloud revenue
In the corporate space, two big US tech giants are due to announce earnings: Alphabet and Microsoft.
Alphabet’s revenue is expected to rise, but slower than recent quarters, while earnings per share is expected to be negatively impacted by the challenging advertisement business, and the rising competition from TikTok. If there is one thing that could save the day is the cloud revenue, which has been one of the key growth drivers. But even that is expected to reveal a slower growth compared to previous quarters.
For Microsoft, the picture is not rosy either. Microsoft is expected to reveal the 5th consecutive quarter of slowing revenue, due to a steep decline in PC demand, the strong US dollar, and unideal macroeconomic conditions. As for Google, investors will focus on how Microsoft’s cloud segment did last quarter. Growth in Azure is also expected to slow but remain at around 20%.
It’s important to remember that soft results don’t necessarily mean negative market reaction. If the soft results still beat the market estimates, we could see Google, and Microsoft shares rally.
Too Soon for Fed to Pivot
Market movers today
In Germany, the IFO survey of business expectations is expected to show further declines mirroring yesterday's weak PMI report for the manufacturing sector. This supports our view that the German economy is likely to fall into recession in Q3, which together with high inflation makes it difficult for both the ECB and the government in Berlin to deal with.
The US Conference Board survey of consumer confidence should show a small decline amid higher interest rates and declining asset prices. Yet, the measure remains much higher than the Michigan survey as it takes the strong labour market into account.
In the US, house price developments in October will also get more attention than usual given concerns that the sharp spike in mortgage rates is hitting housing demand and prices, which could initiate a broader downturn in the economy.
The 60 second overview
Markets: While many important macro stories are unfolding right now the most important one is in our view market speculations that the Fed could be closer to a policy pivot in a more dovish direction. Notably, despite the recent move lower in natural gas prices longer-term market based inflation expectations continue to creep higher. In our view, that highlights that it is still too early for central banks including the Fed to turn into a more accommodative mode since this risks jeopardizing the fight against higher inflation. That said, since Friday's Wall Street Journal article lifted the pivot-speculations we have seen US rates come lower and US equity prices rally.
Of other important stories Chinese equities have rebounded this morning following some otherwise very sour sessions with markets digesting President Xi Jinping's consolidation of power over the weekend. The CNY has this morning hit new lows and it seems Chinese policy makers increasingly accept and/or welcome currency weakness in the current environment.
In Japan, FX intervention risks remain but we highlight that Japanese policy makers face a decision between sticking to yield-curve control and/or credibly fighting JPY-strength.
UK: Yesterday, former chancellor Rishi Sunak was elected new prime minister of the UK, set to formally replace Liz Truss later today. This was broadly welcomed by markets given Sunak's firmer stance on fiscal discipline. At present, we see low likelihood of the medium-teem fiscal plan being further delayed and high likelihood that Jeremy Hunt will be staying on as chancellor in a bid to reassure markets.
PMIs: Yesterday's bunch of preliminary PMIs were generally disappointing reading both in terms of headlines but also when it comes to the details. In Europe the manufacturing PMIs hit new lows at 46.6 highlighting how the downturn seems to have gathered pace heading into Q4 with increasing strains on competitiveness from rising energy, wage and borrowing costs. Although supply bottlenecks showed further signs of easing, inflationary pressures remained stubbornly high and the weaker demand environment does not yet seem to have weakened firms' pricing power noticeably.
The US PMIs also fell short of expectations with the flash manufacturing estimate falling below the 50 threshold indicating falling activity levels ahead. Notably, the details also showed that the drop was driven by new orders. Importantly, the employment indices for both manufacturing and services fell below 50 indicating a drop in employment ahead - albeit other indicators paint a more positive outlook for the labour market. Meanwhile, output prices remained elevated highlighting the difficult balancing act that central banks face in stagflationary environments.
Equities: Equities started the week higher, lifted by yields plunging in the UK on the back of Rishi Sunak becoming the new PM. Interesting to see equities higher on a day with macro being exceptionally weak. A look at the underling sector/industry story suggest this is a low conviction rally. In the US defensives outperformed with the top five performing industries being defensives. Equity relief is coming as yields, inflation and CB's scare is fading but recession risk is increasing and hence investors buying the least earnings sensitive stocks. In US Dow +1.3%, S&P 500 +1.2%, Nasdaq +0.9%, Russell 2000 +0.4%. Asia is higher this morning with a little comeback to China after yesterday's massive sell-off. European and US futures marginally higher.
FI: European rates generally declined in yesterday's session with the longer end falling more than the short end driving a generally flattening of curves. UK rates moved lower on Sunak becoming the new PM but also Italian government bonds had a good session with spreads narrowing to Germany.
FX: Implied volatilities in major G10 crosses, in particular USD/JPY and GBP/USD, came lower on Monday after last week's yen interventions and with the new UK PM in place. USD/JPY post-intervention price action similar to when BoJ intervened last time. Meanwhile, there was no follow-through to the no-Boris rally in sterling. A green day in equities eventually pulled Scandies lower with EUR/SEK around 11.00 and EUR/NOK around 10.37. EUR/USD slightly bid, yet below 0.99.
Credit: Credit markets were in a cheery mood on Monday, following along the relief rally in major western equity indicies. Itrax main tightened 3.6bp to close at 121.5bp. Itrax Xover tightened 15.2bp to close at 587bp. Despite the good tone in secondary markets, primary market activity was relatively muted.
Technical Outlook and Review
USD/JPY:
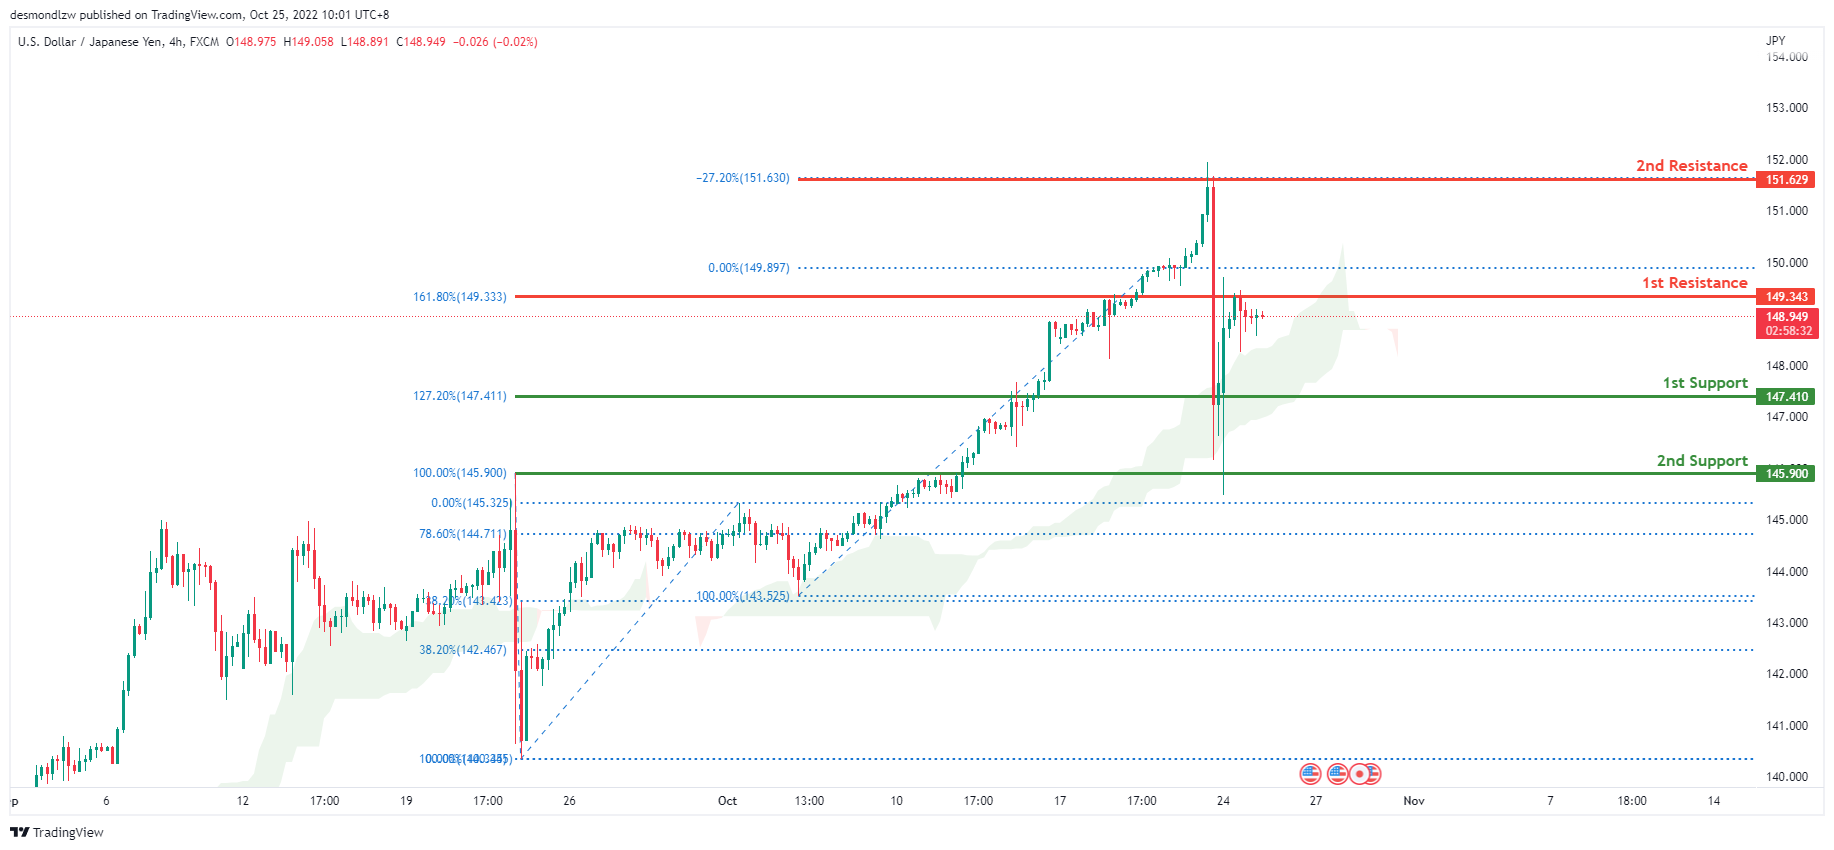
The current general bias for USDJPY on the H4 chart is bullish. To add to this bias, the price is currently trading above the Ichimoku cloud, indicating a bullish market. Last Friday the Bank of Japan intervened causing prices to be extremely volatile. Price hit the 1st resistance at 151.629 where the -27.2% Fibonacci expansion is located before coming right down to the 2nd support at 145.900 and then bounced back up with price currently trading at 148.943 at time of writing. Expecting price to retest the 1st resistance at 149.343 if this bullish momentum continues.
Areas of consideration:
- H4 time frame, 1st resistance at 151.629
- H4 time frame, 1st support at 149.313
DXY:
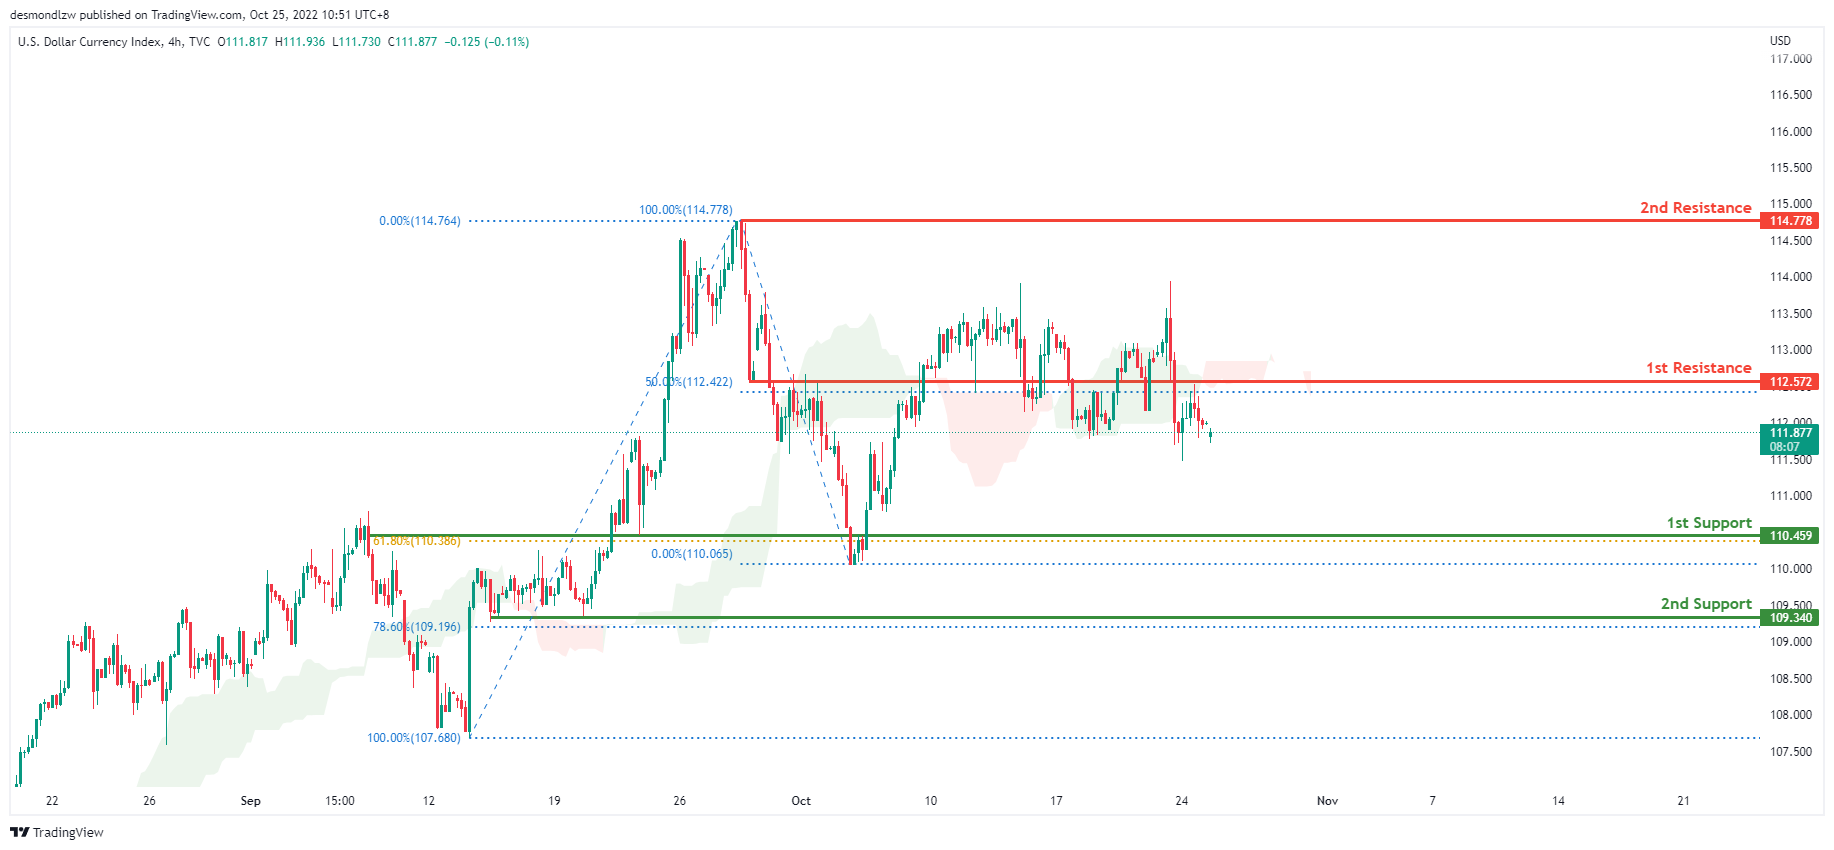
On the H4 chart, the overall bias for DXY is bearish. To add confluence to this, the price is below the Ichimoku cloud which indicates a bearish market. If this bearish momentum continues, expect price to possibly head towards the 1st support at 110.459 where the 61.8% Fibonacci line is located.
Areas of consideration:
- H4 time frame, 1st resistance at 114.759
- H4 time frame, 1st support at 110.084
EUR/USD:
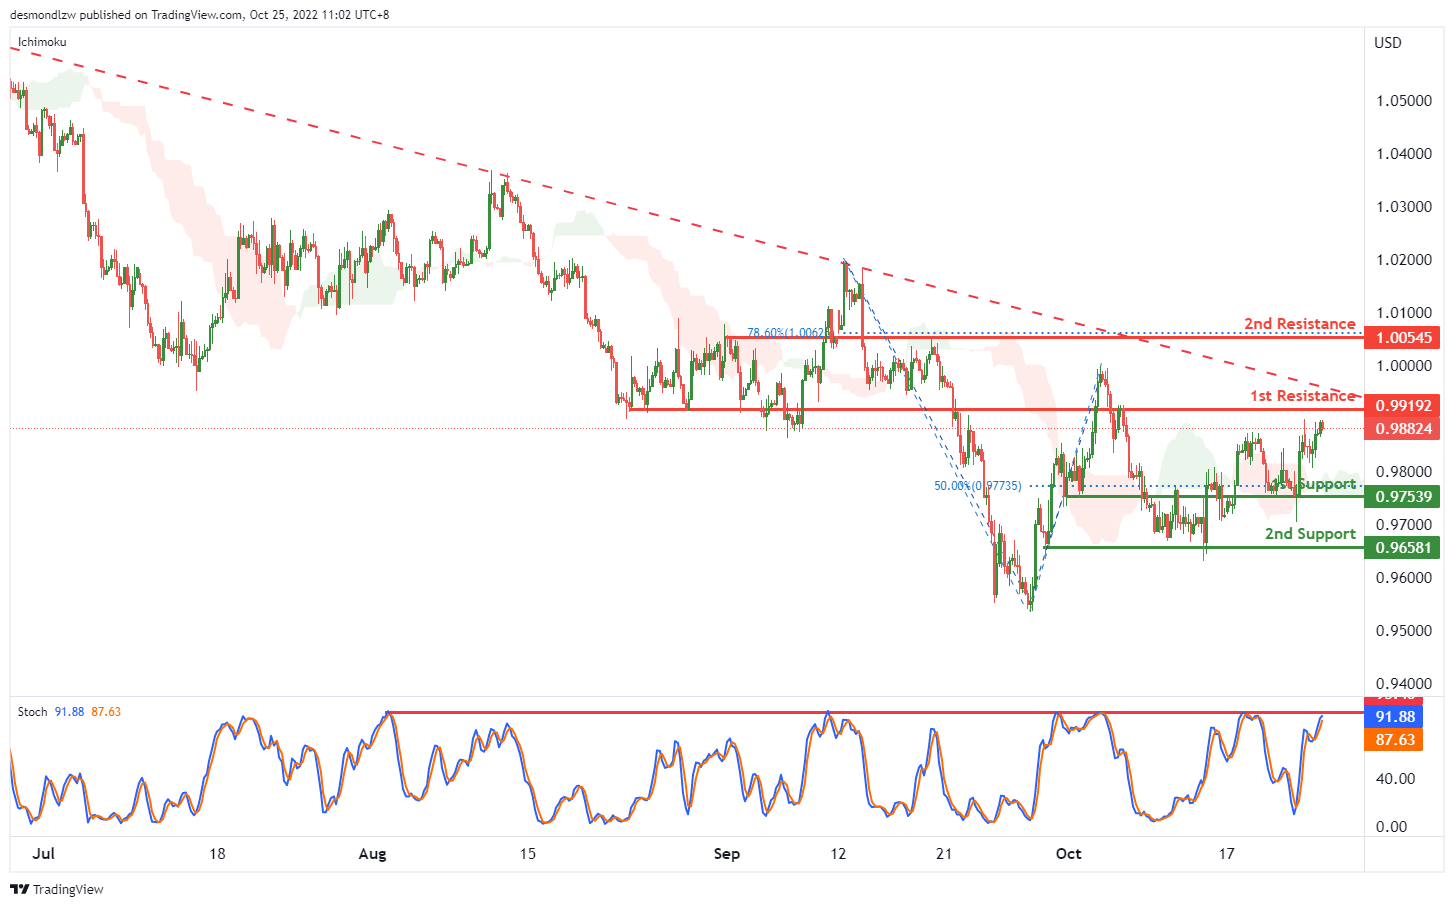
On the H4, price is moving within the descending trendline in a descending manner, with the stoch is testing the resistance, the price may drop from the 1st resistance at 0.99192, which is in line with the overlap resistance to the 1st support at 0.97539, where the overlap support and 50% fibonacci retracement are. If the 1st support is broken, the 2nd support is at 0.96581, which is in line with the swing low. Alternatively, the price may break the 1st resistance and rise to the 2nd resistance at 1.00545, where the 78.6% fibonacci retracement sits.
Areas of consideration :
- H4 1st resistance at 0.99192
- H4 1st support at 0.97539
GBP/USD:
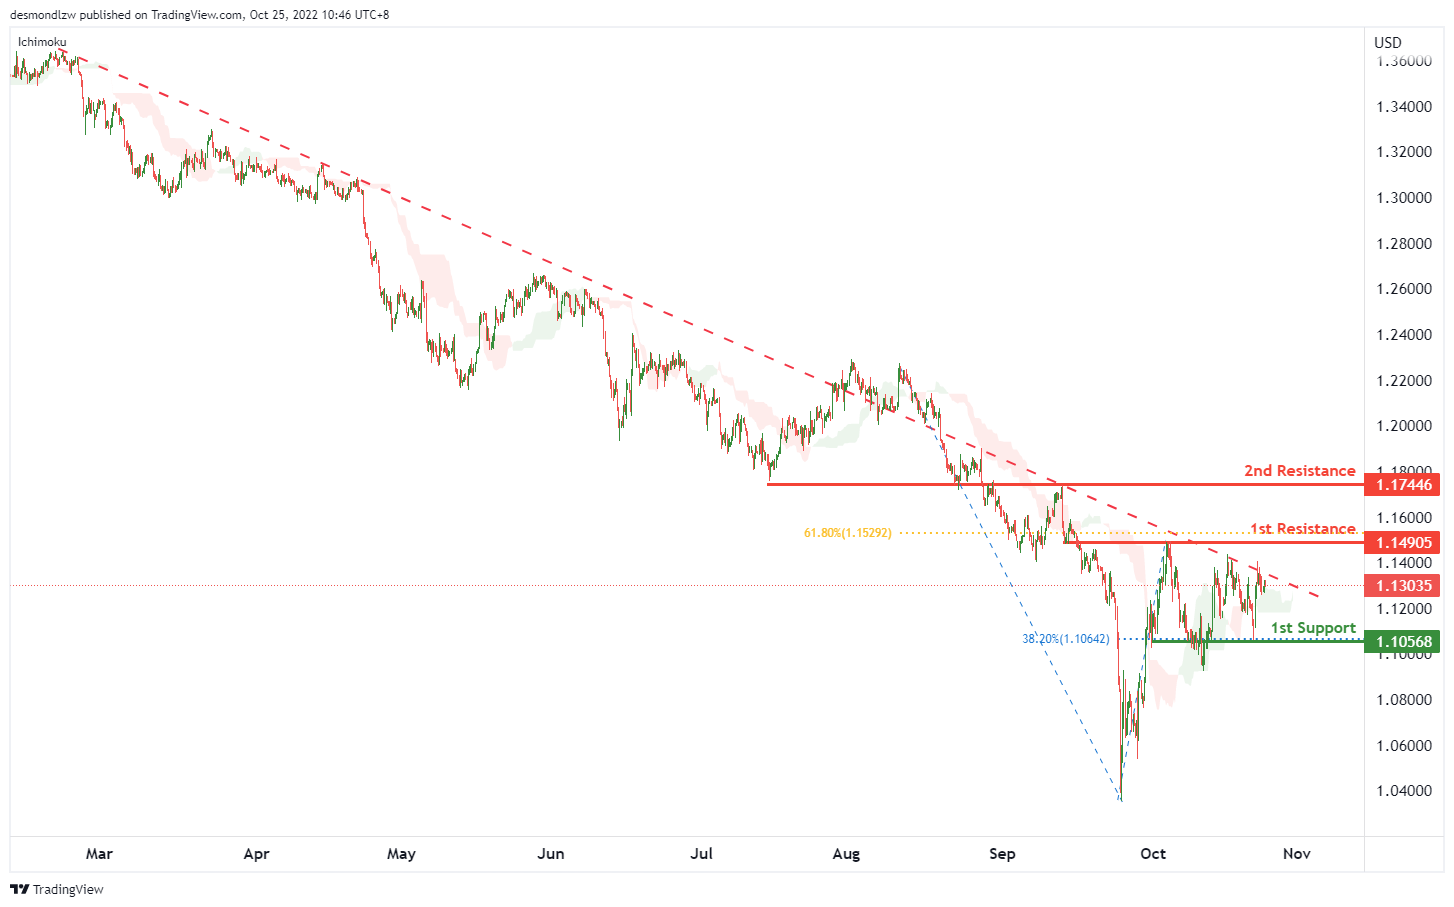
On the H4, price is crossing ichimoku cloud and testing the descending trendline, we have a bullish bias that the price may test the 1st resistance at 1.14905, which is in line with the overlap resistance and 61.8% fibonacci retracement. If the 1st resistance is broken, the 2nd resistance is at 1.17446, where the overlap resistance is. Alternatively, the price may drop to the 1st support at 1.10568, where the swing low support and 38.2% fibonacci retracement are.
Areas of consideration:
- H4 1st resistance at 1.14905
- H4 1st support at 1.10568
USD/CHF:
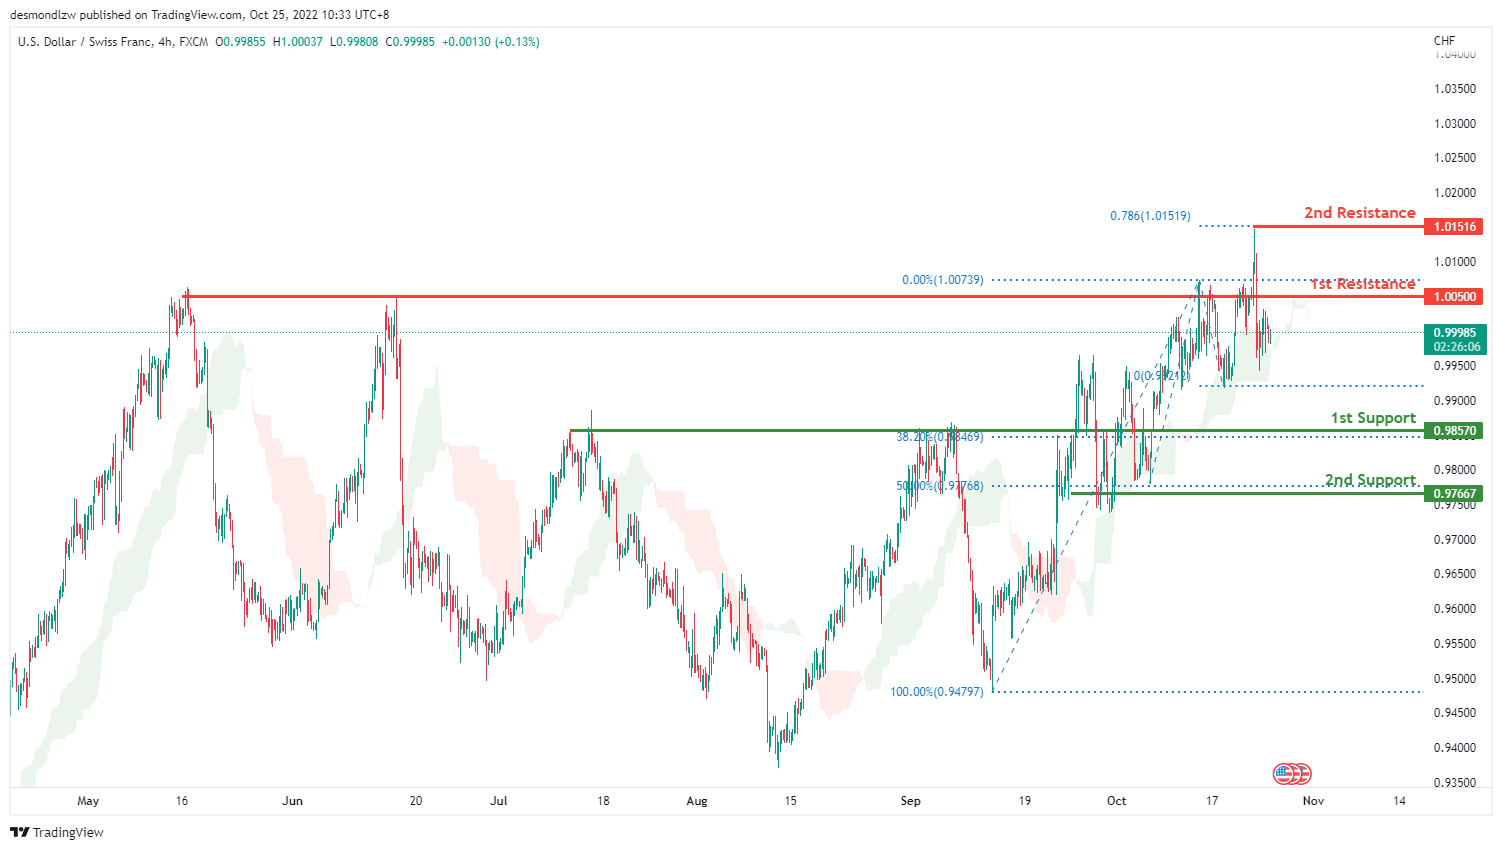
On the H4 chart, the overall bias for USDCHF is bullish. To add confluence to this, the price is above the Ichimoku cloud which indicates a bullish market. Price has tapped the 2nd resistance at 1.01516 before reflecting back down below the 1st resistance. Expecting price to go back up to retest the 1st resistance at 1.00500 if this bullish momentum continues.
Areas of consideration
- H4 1st support at 0.9857
- H4 1st resistance at 1.0050
XAU/USD (GOLD):
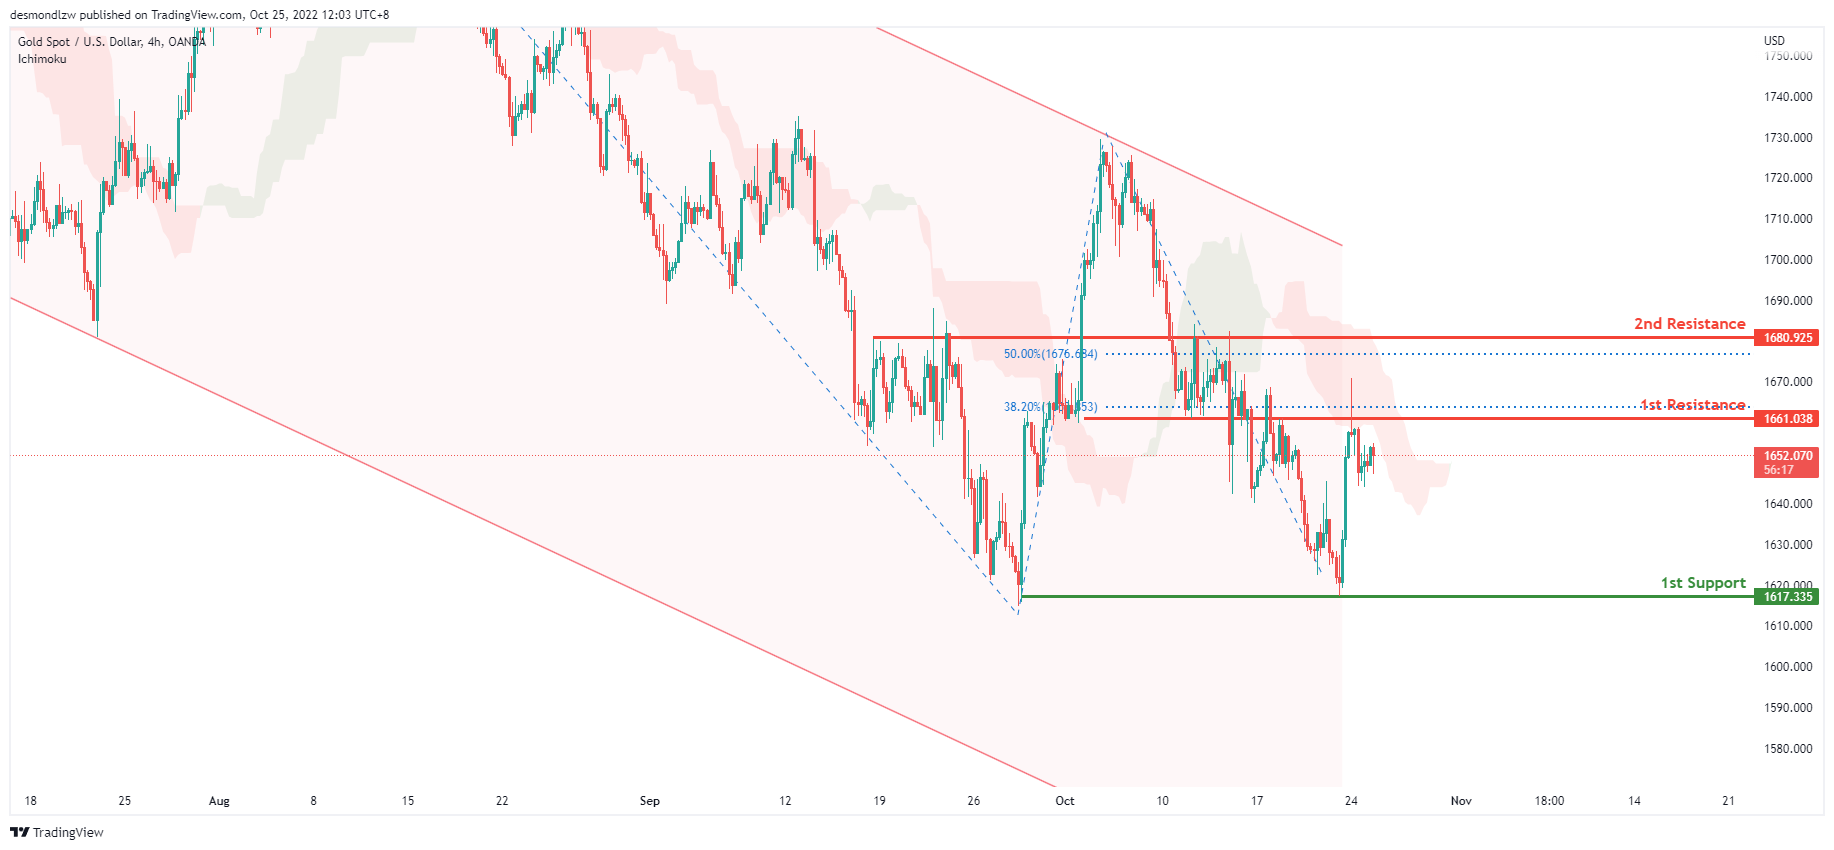
On the H4 chart, the overall bias for XAUUSDis bearish. To add confluence to this, the price is below the Ichimoku cloud which indicates a bearish market. Price has tapped onto the 1st resistance at 1661.038 where the 38.2% Fibonacci line is located before reflecting back down. Expecting price to possibly head back up to retest the 1st resistance.
Areas of consideration:
- H4 time frame, 1st support at 1617.335
- H4 time frame, 1st resistance at 1661.038
AUD/USD:
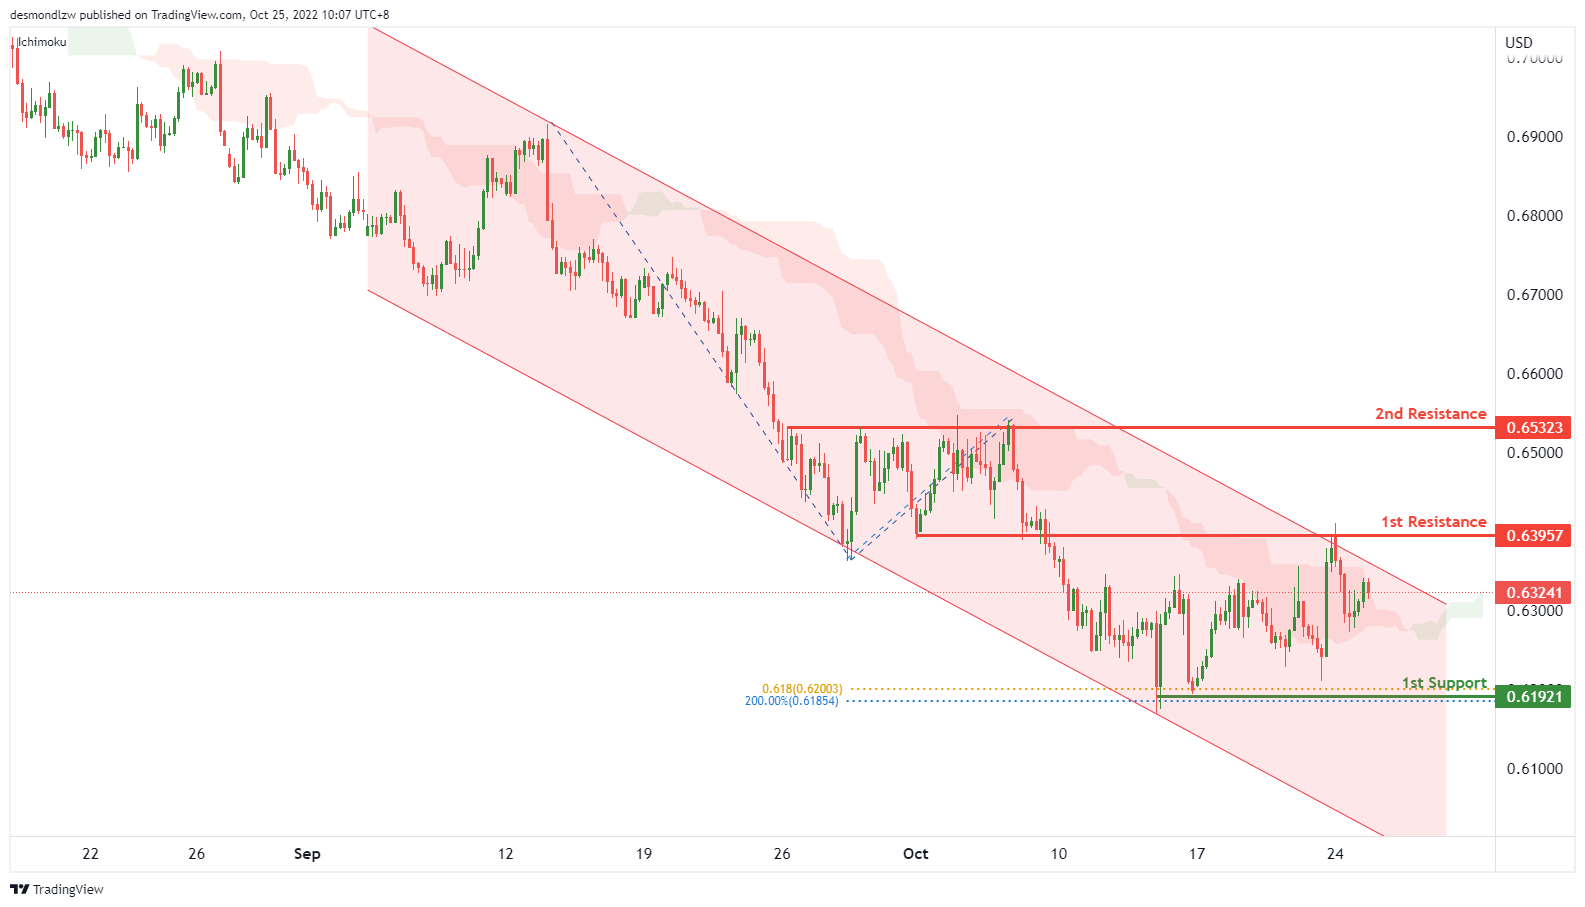
On the H4, with the price below the descending channel and ichimoku cloud, we have a bearish bias that the price may drop to the 1st support at 0.61921, where the previous swing low, 61.8% fibonacci projection and 200% fibonacci extension are. Alternatively, the price may rise to the 1st resistance at 0.63957, which is in line with the overlap resistance, if the 1st resistance is broken, the 2nd resistance could be at 0.65323, where the previous overlap resistance is.
Areas of consideration
- H4, 1st resistance at 0.63957
- H4, 1st support at 0.61921
NZD/USD:
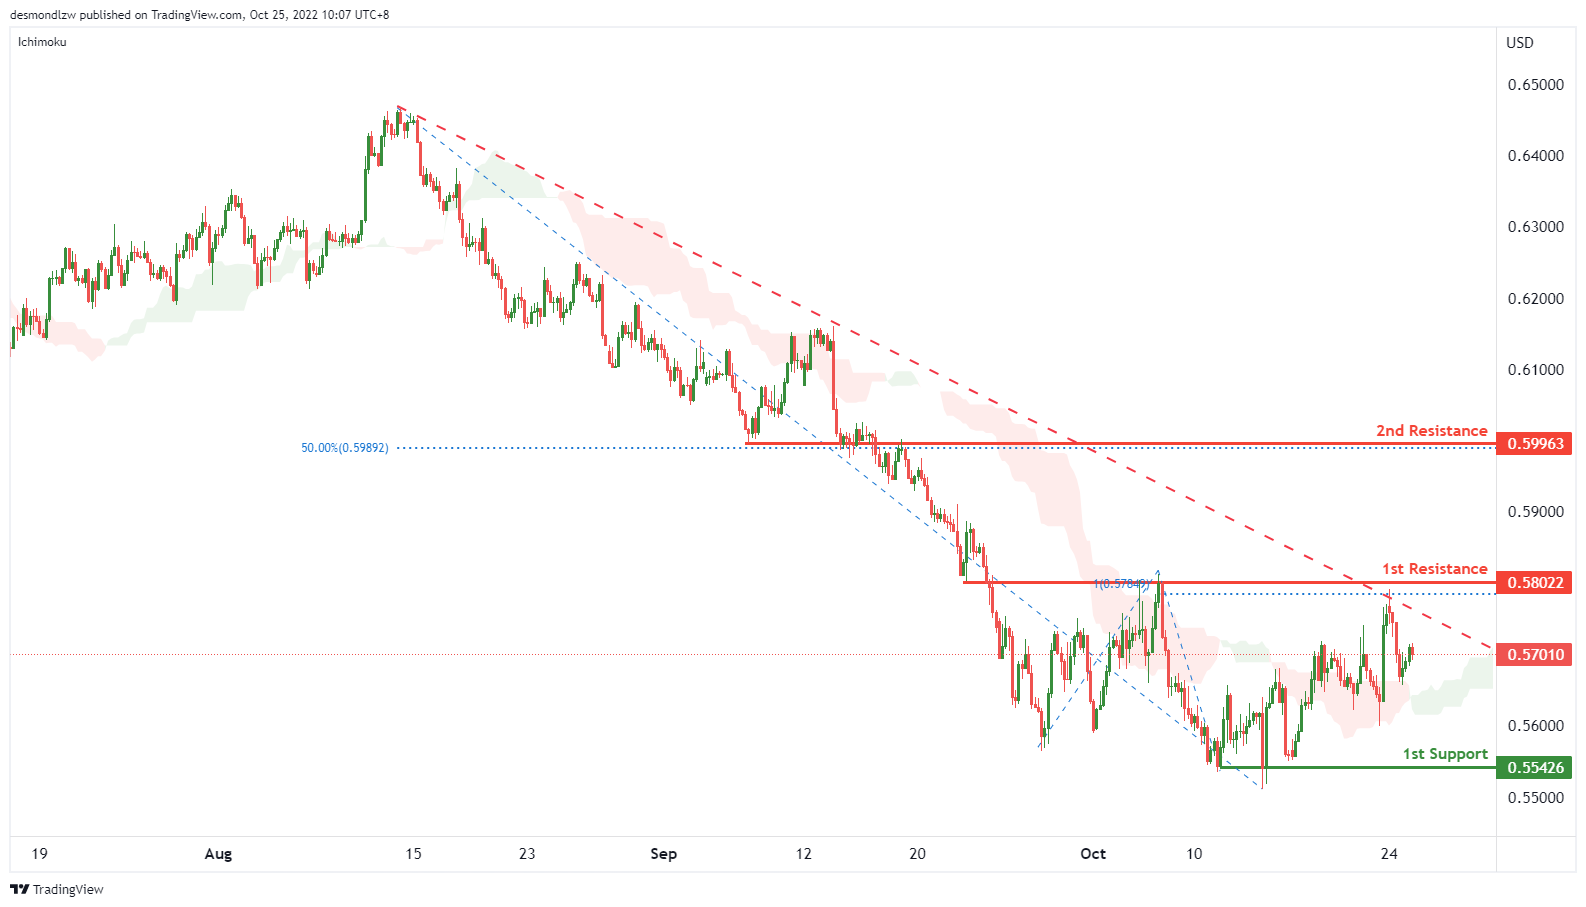
On the H4 chart, as the price is below the descending trendline, the overall bias for NZDUSD is bearish. However, price is above the Ichimoku cloud which might indicate a short term bullish market. Expecting price to possibly break above the 1st resistance at 0.58022, which is in line with the overlap resistance and 100% fibonacci projection, and possibly head towards the 2nd resistance at 0.59963 where the 50% Fibonacci line and overlap resistance are located. Alternatively, the price may continue the bearish trend and drop to the 1st support at 0.55426.
Areas of consideration:
- H4 time frame, current price
- H4 time frame, 1st resistance at 0.58022
USD/CAD:
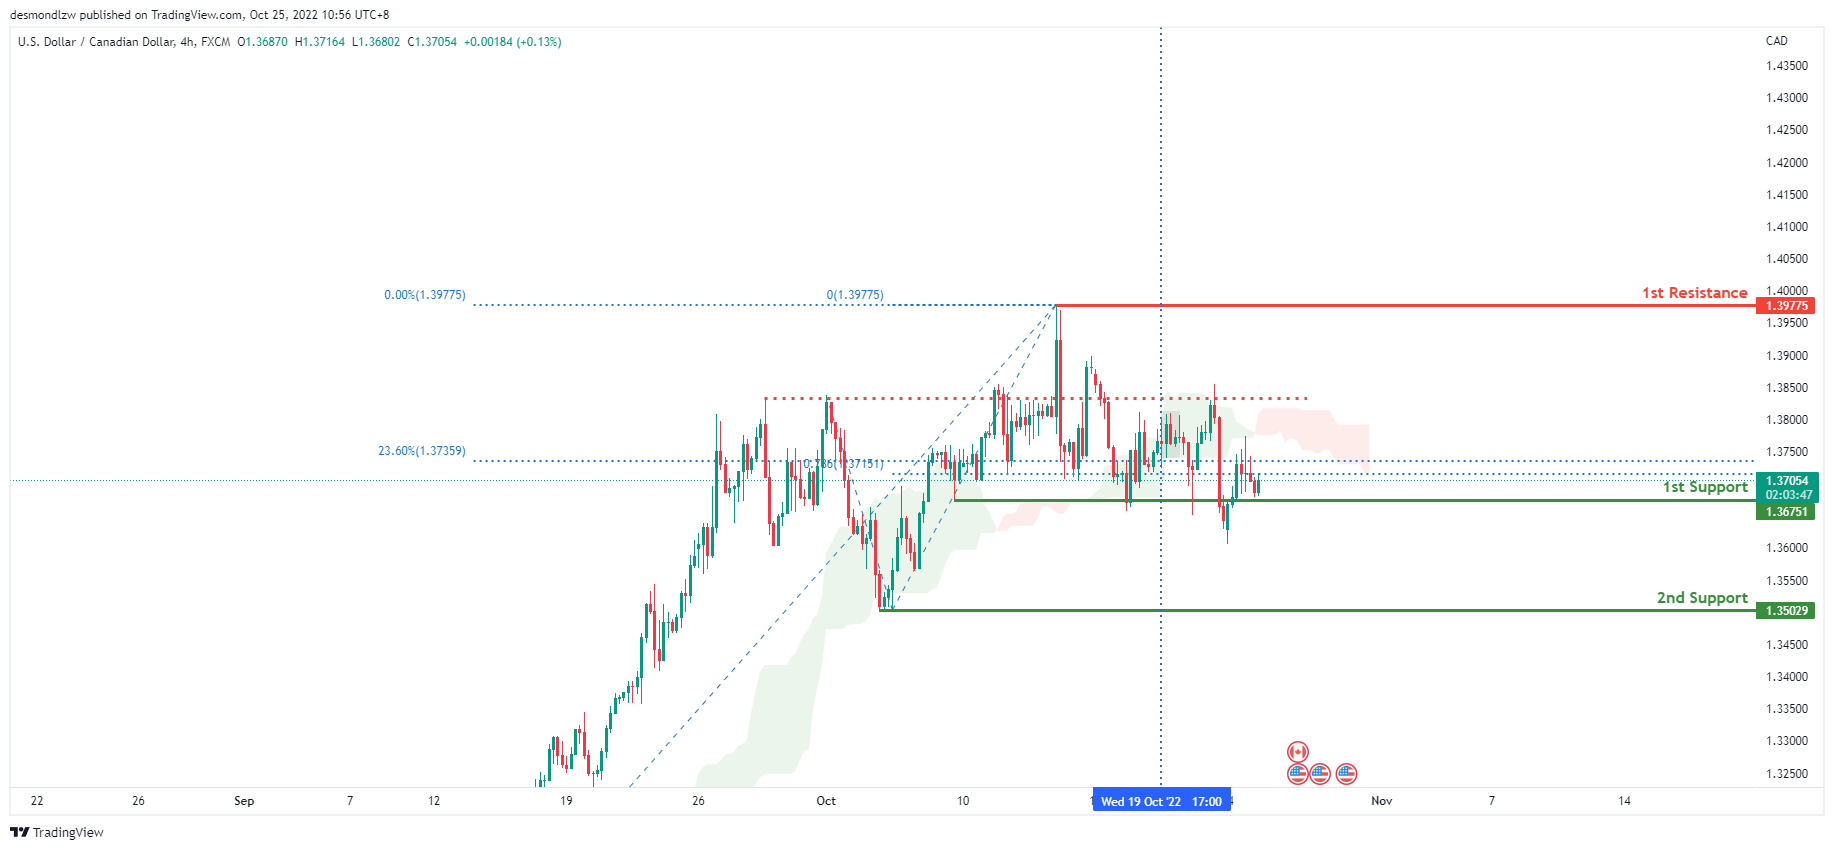
On the H4 chart, the overall bias for USDCAD is bearish. To add confluence to this, the price is below the Ichimoku cloud which indicates a bearish market. Price is currently resting on the 1st support at 1.36751 where the 23.6% Fibonacci line and 78.6% Fibonacci projection line is located. If this bearish momentum continues, expect price to possibly head down below the 1st support and towards the 2nd support at 1.35029 where the previous low is.
Areas of consideration:
- H4 time frame, 1st resistance at 1.3967
- H4 time frame, 1st support at 1.36751
- H4 time frame, 2nd support at 1.35029
OIL:
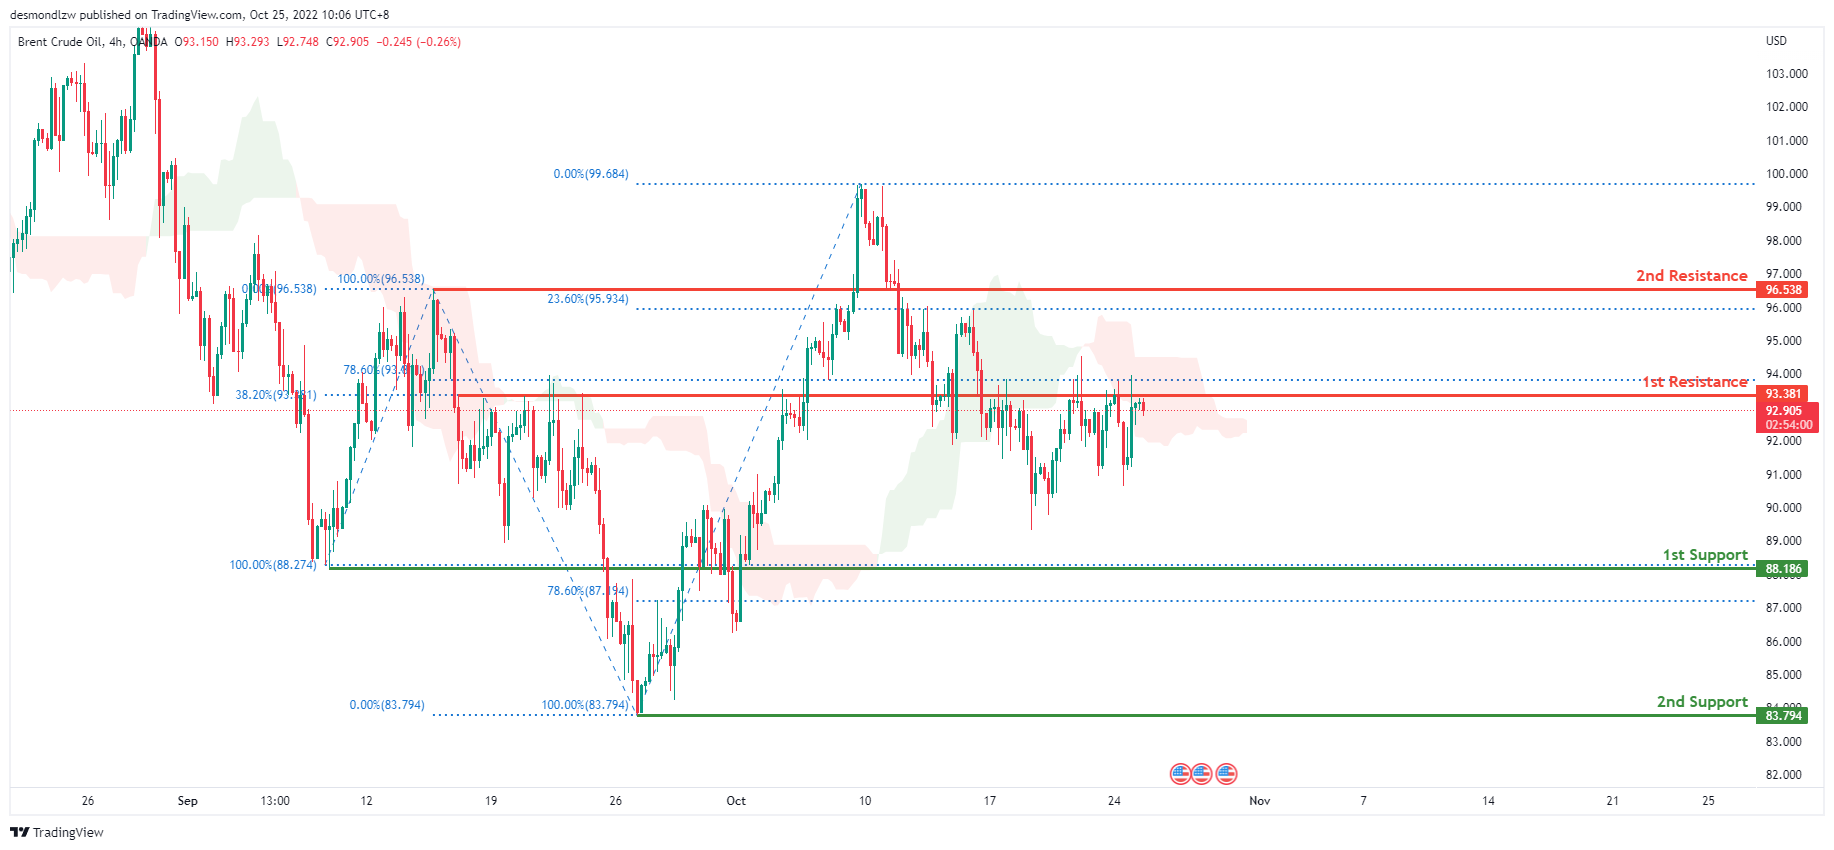
Looking at the H4 chart, the current overall bias for Oil is bearish. The price continued consolidating underneath the 1st resistance line at 93.381 where the 38.2% and 78.6% Fibonacci lines are located. Expecting the price to head towards the 1st support at 88.186 where the 100% and 78.6% Fibonacci lines are located if this bearish momentum continues.
Areas of consideration:
- H4 time frame, 1st resistance at 93.381
- H4 time frame, 1st support at 88.1
Dow Jones Industrial Average:
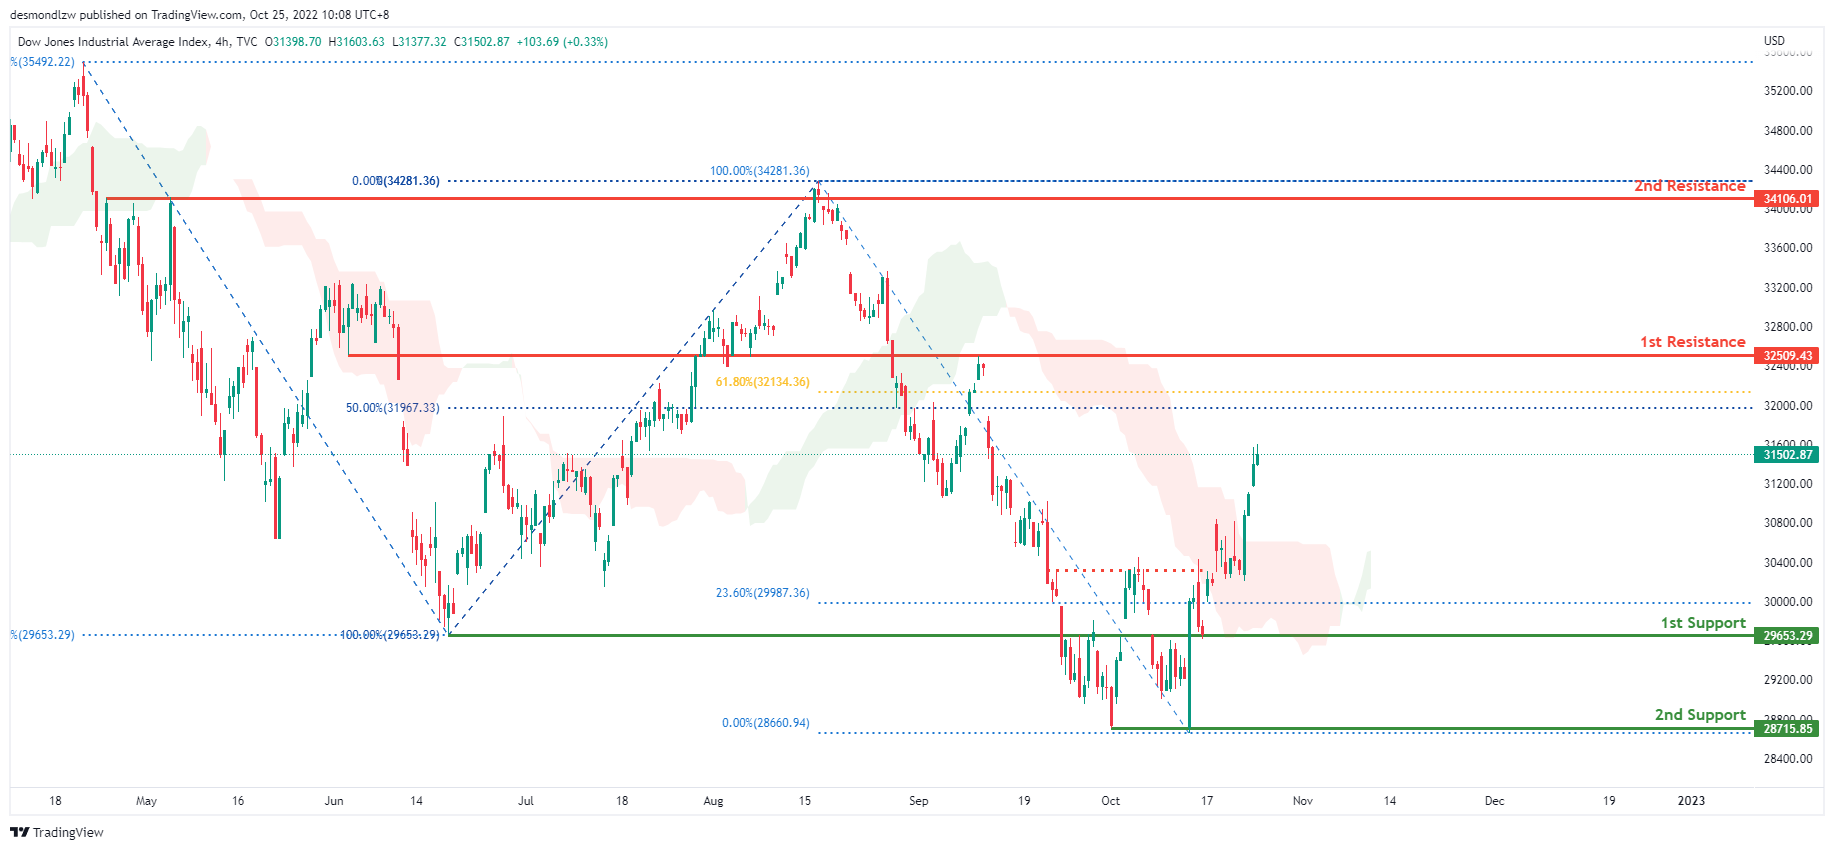
On the H4 chart, the overall bias for DJI is bullish. To add confluence to this, the price is above the Ichimoku cloud which indicates a bullish market. Expecting price to head towards the 1st resistance at 32509.43, where the 61.8% and 50% Fibonacci lines are located if this bullish momentum continues.
Areas of consideration:
- H4 time frame, 1st support at 29653.29
- H4 time frame, 2nd support at 28715.85
- H4 time frame, 1st Resistance at 32509.43
DAX:
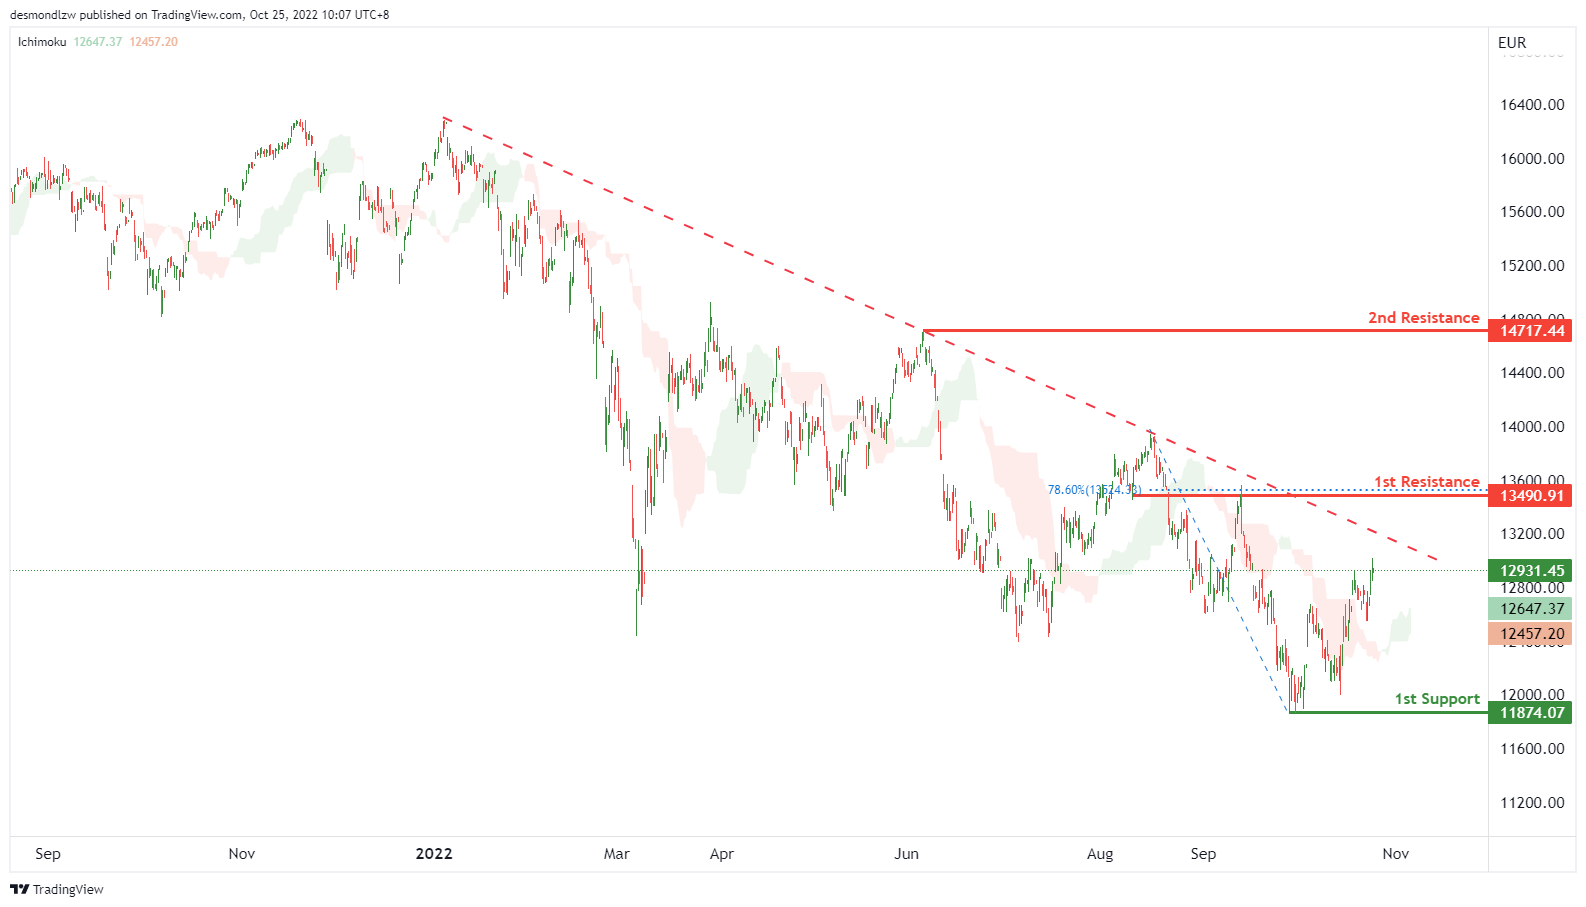
On the H4 chart, the overall bias for DAX is bearish. However, price has now closed above the Ichimoku cloud which indicates a change to bullish market momentum. Expecting price to possibly continue this bullish momentum and head towards the 1st resistance at 13490.91, where the 78.6% Fibonacci line is located. If the 1st resistance is broken, the 2nd resistance could be at 14717.44, which is in line with the previous swing high. Alternatively, the price may drop to the 1st support at 11874.07, which is in line with the swing low.
Areas of consideration:
- H4 time frame, current price
- H4 time frame, 1st resistance at 13490.9
ETHUSD:
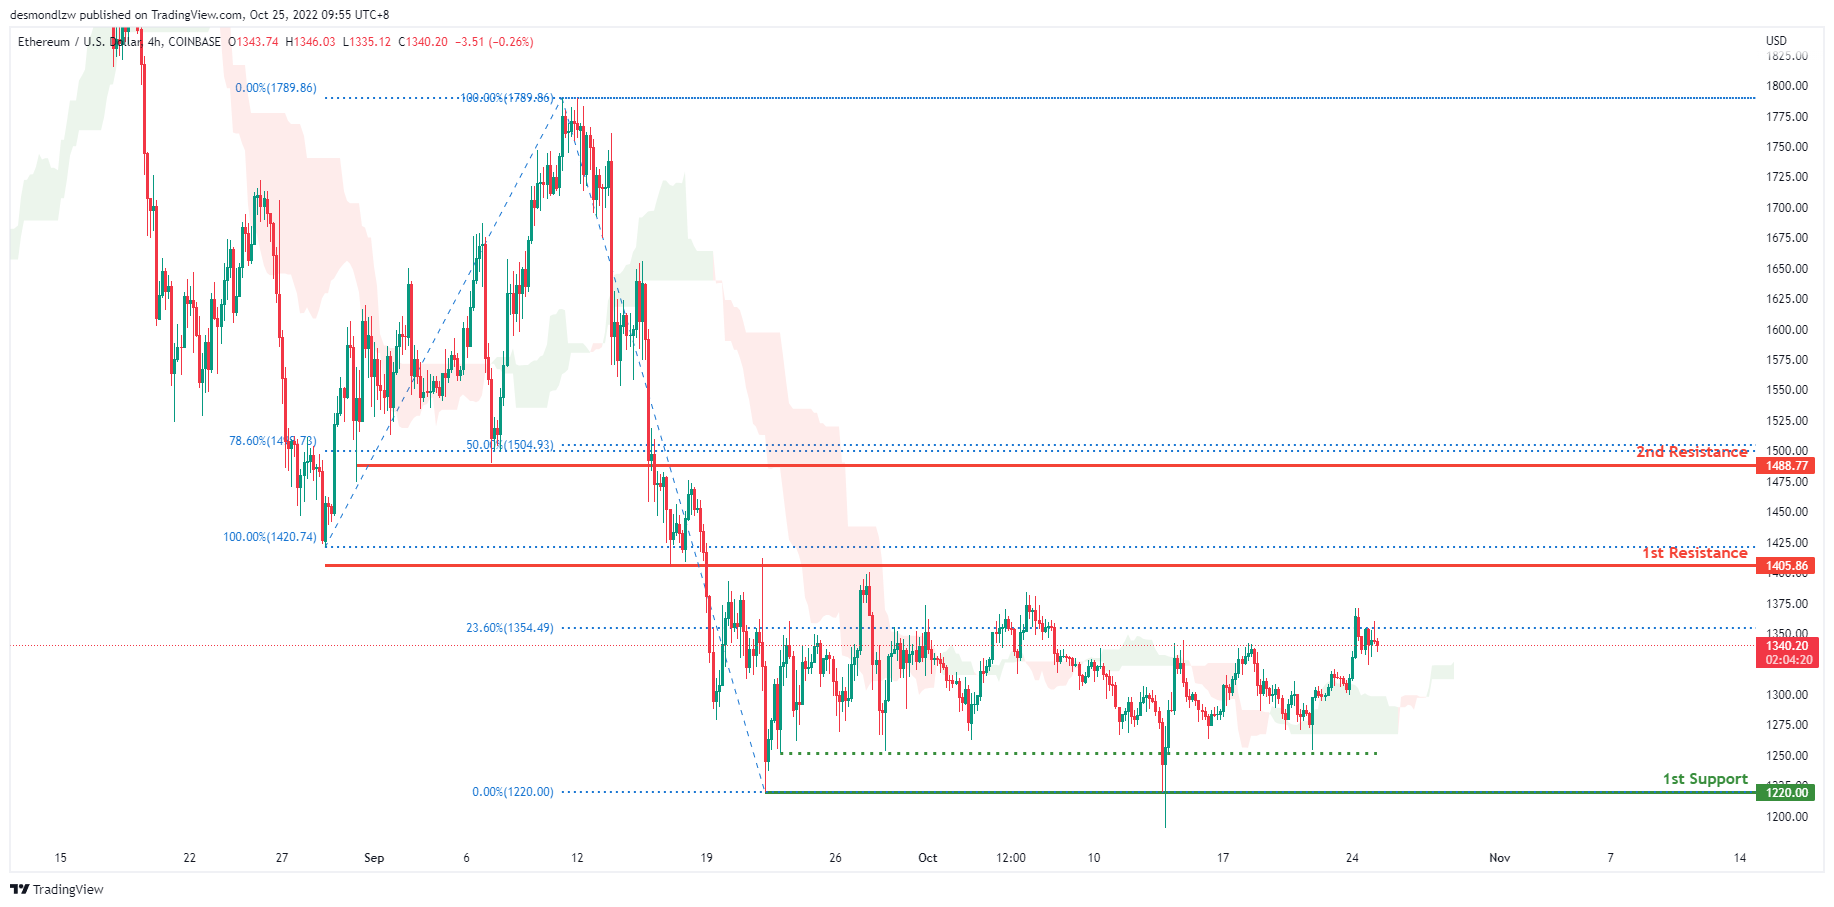
Looking at the H4 chart, the current overall bias for ETHUSD is bearish. However, price has closed above the Ichimoku cloud which might indicate a short term bullish momentum. For the past 1 month, price has been consolidating between the 1st resistance at 1405.86 and 1st support at 1405.86. Expecting price to head towards the 1st resistance at 1405.86 if this bullish momentum continues.
Areas of consideration:
- H4 time frame, 1st resistance of 1405.86
- H4 time frame, 1st support at 1220.00
BTCUSD:
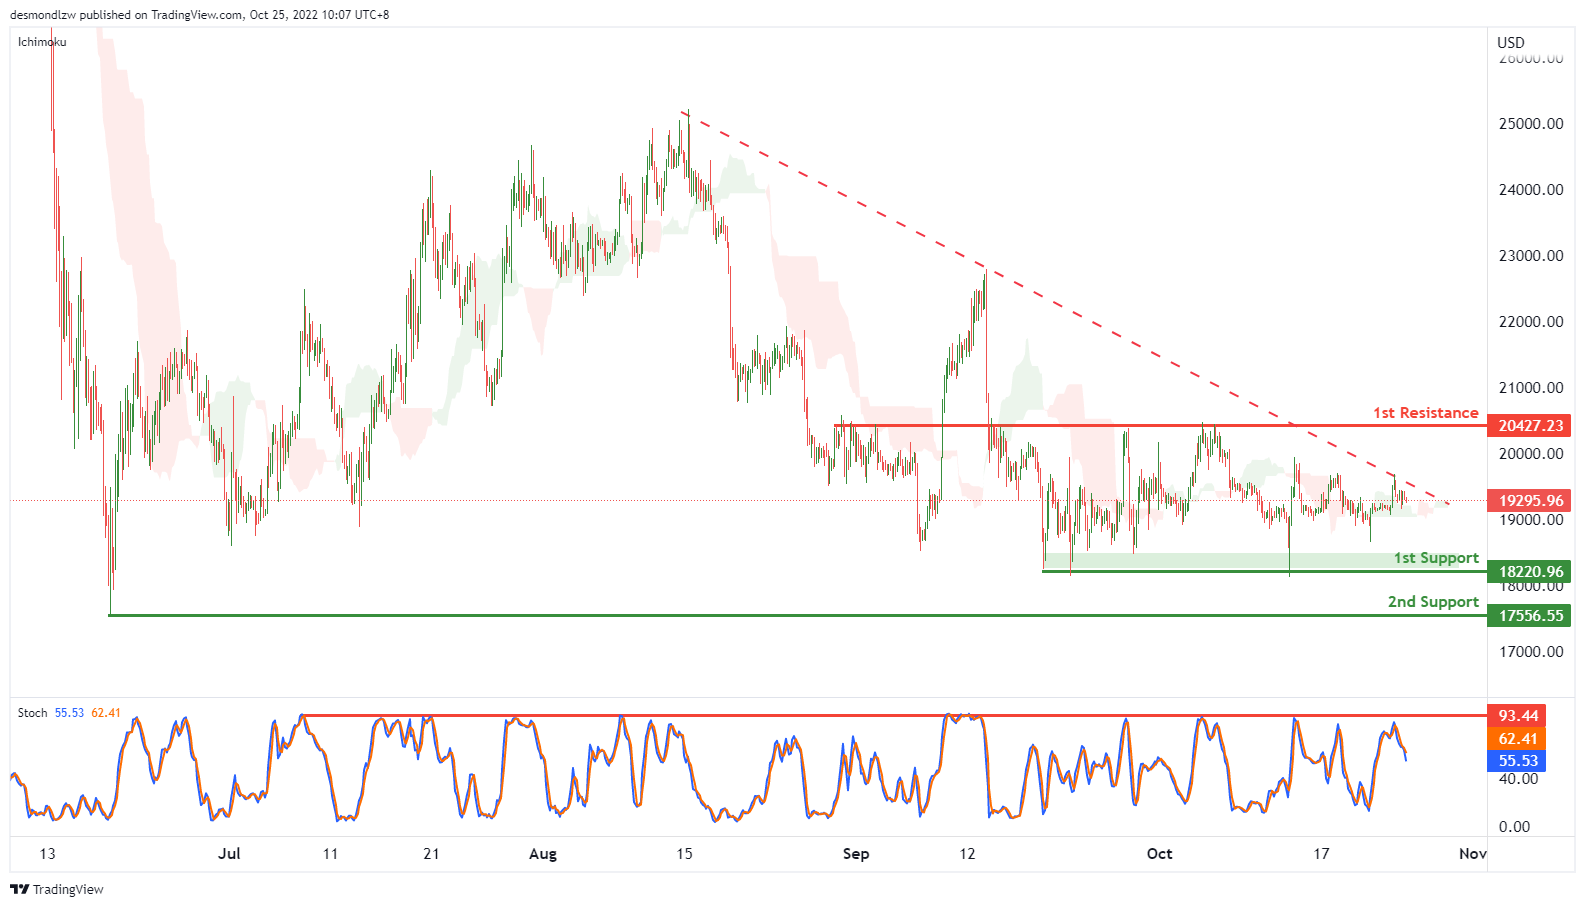
On the H4, price is crossing ichimoku cloud and below descending trendline, as well as Stoch is dropping from the resistance, we have a bearish bias that the price may drop to the 1st support at 18220.96, which is in line with the previous swing lows and if the 1st support is broken, the 2nd support is at 17556.55, where the previous swing low is. Alternatively, the price may rise to the 1st resistance at 20427.23, where the overlap resistance is
Areas of consideration:
- H4 time frame, current price
- H4 time frame, 1st support at 18220.96
S&P 500:
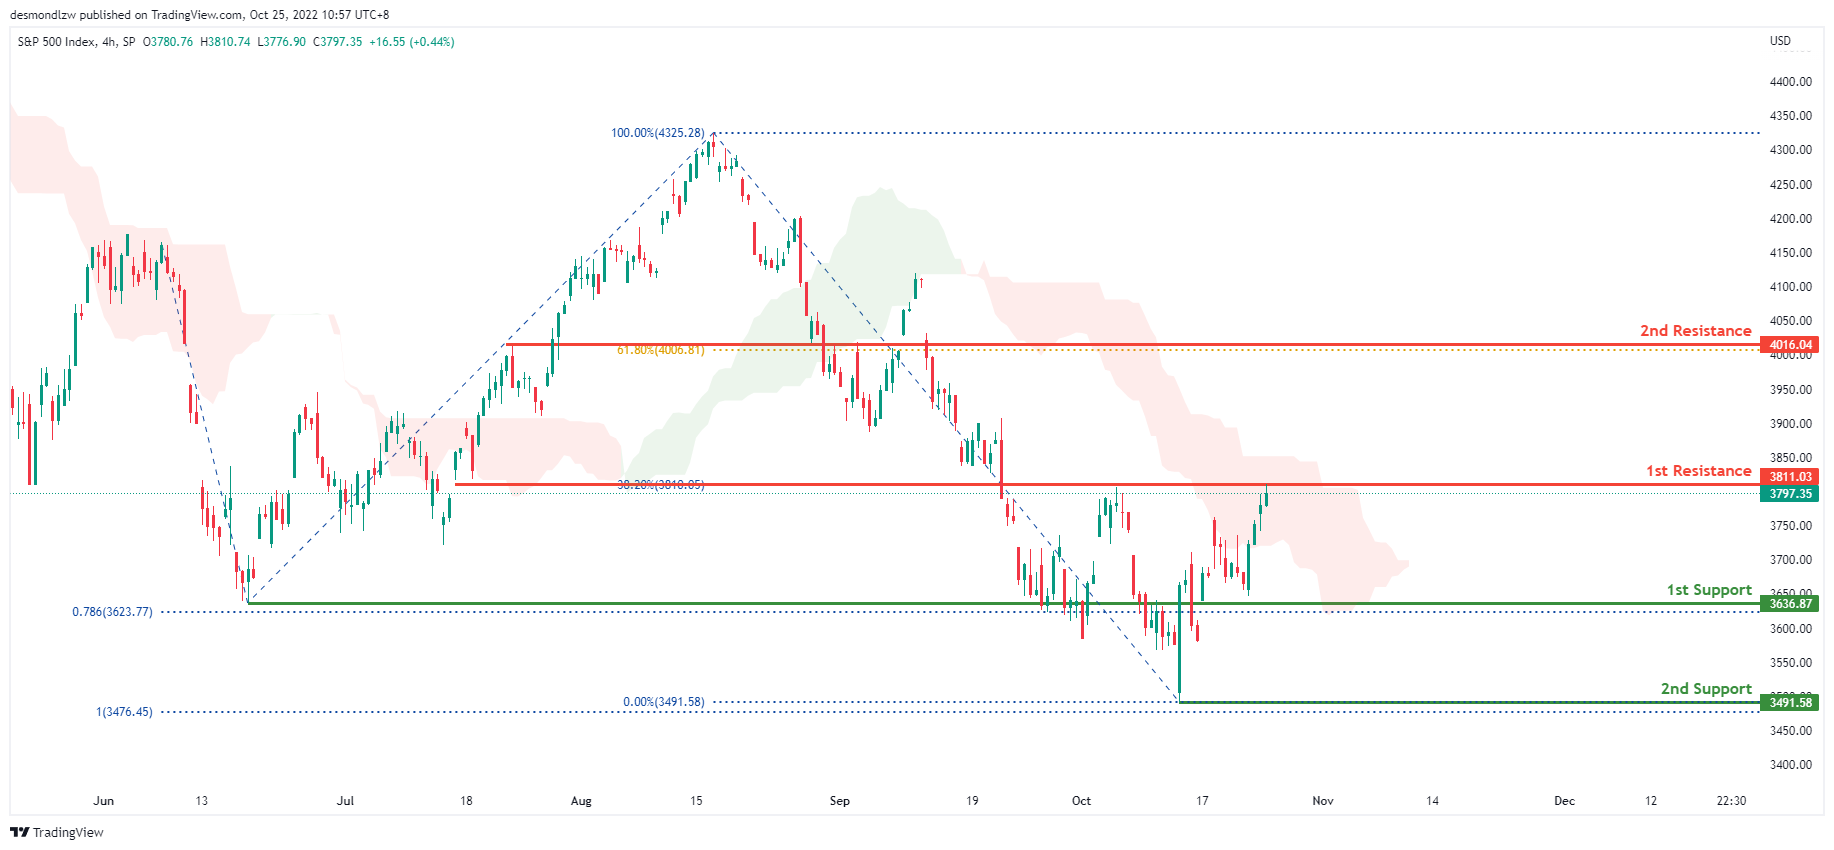
On the H4 chart, the overall bias for S&P500 is bearish. Price has tapped into the 1st resistance at 3811.03 where the 38.2% Fibonacci line is located. With this short term bullish momentum, price could possibly break above the 1st resistance and head towards the 2nd resistance at 4016.04 where the 61.8% Fibonacci line is located.
Areas of consideration:
- H4 time frame, 1st support at 3492.42
- H4 time frame, 1st resistance at 3800
- H4 time frame, 2nd resistance at 4007.45
USD/CAD Daily Outlook
Daily Pivots: (S1) 1.3617; (P) 1.3696; (R1) 1.3785; More...
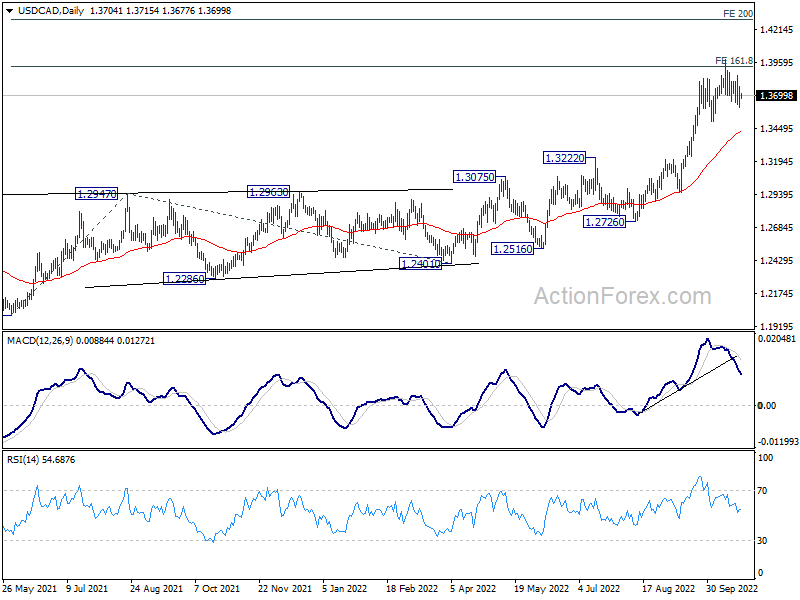
USD/CAD is still engaging in the consolidation pattern from 1.3976 and intraday bias remains neutral. Deeper retreat might be seen but downside should be contained by 1.3501 support. On the upside, firm break of 1.3976 will target 200% projection of 1.2005 to 1.2947 from 1.2401 at 1.4285. However, firm break of 1.3501 will bring deeper correction to 55 day EMA (now at 1.3426) and possibly below.
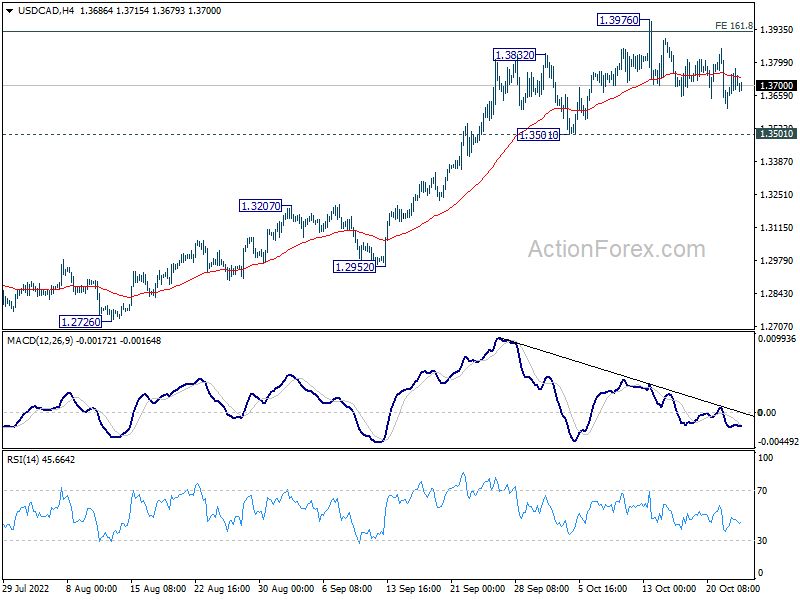
In the bigger picture, up trend from 1.2005 (2021 low) is still in progress. Based on current impulsive momentum, it could be resuming long term up trend from 0.9056 (2007 low). Whether it is or it isn't, retest of 1.4689 (2016 high) should be seen next. This will now remain the favored case as long as 1.3222 resistance turned support holds.