Sample Category Title
GBP/JPY Daily Outlook
Daily Pivots: (S1) 158.96; (P) 160.82; (R1) 161.90; More...
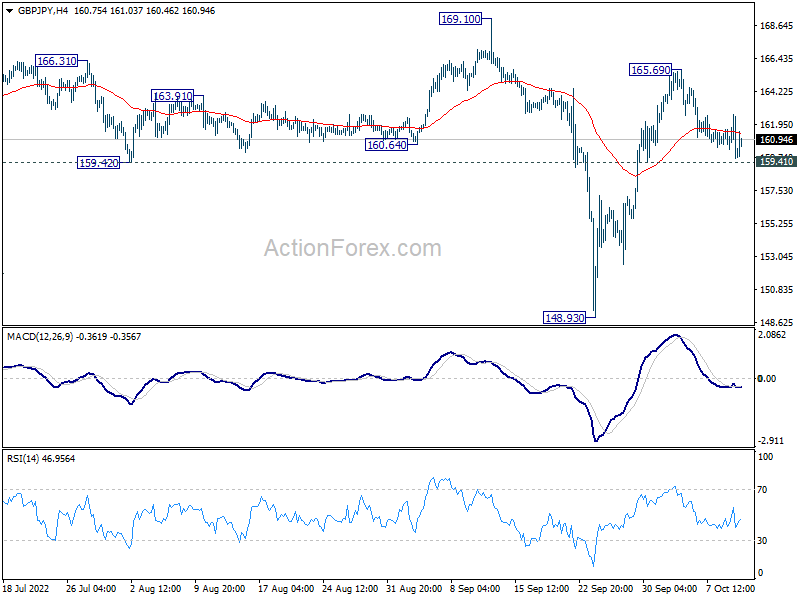
Intraday bias in GBP/JPY remains neutral and outlook is unchanged. On the downside, below 159.41 minor support will turn bias back to the downside for 148.93 again. However, firm break of 169.10 will confirm resumption of larger up trend. Also, while further rise could be seen, strong resistance might be seen from 169.10 high to limit upside, at least on first attempt.
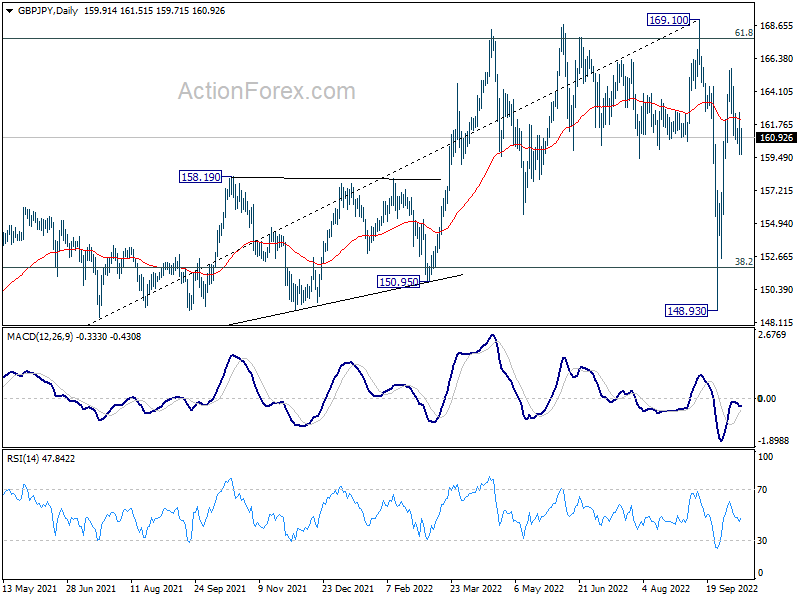
In the bigger picture, strong support from 38.2% retracement of 123.94 to 169.10 at 151.84 suggests that price actions from 169.10 are developing into a corrective pattern only. That is, rise from 123.94 (2020 low) should resume at a later stage. This will now remain the favored case as long as 148.93 support holds.
EUR/JPY Daily Outlook
Daily Pivots: (S1) 140.95; (P) 141.58; (R1) 142.14; More....
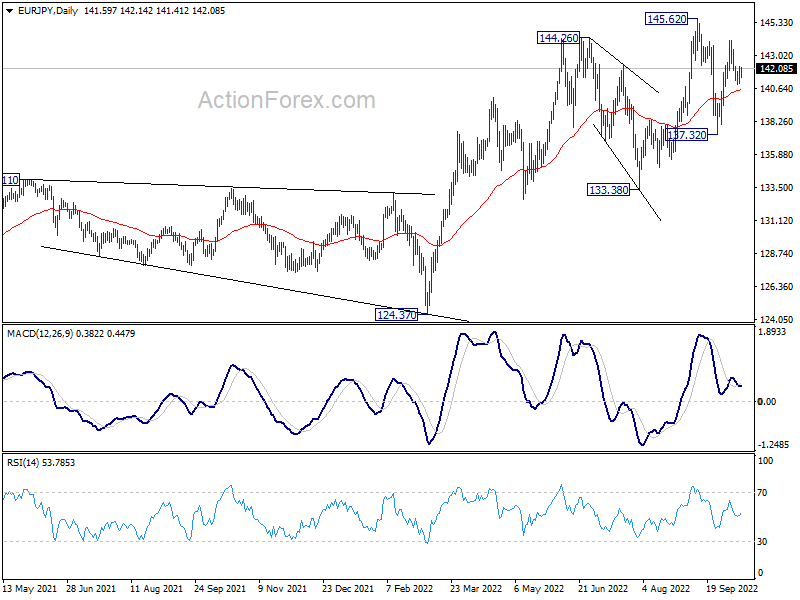
Intraday bias in EUR/JPY remains neutral and outlook is unchanged. On the downside, break of 140.77 minor support will turn bias back to the downside, to extend the corrective pattern from 145.62 with another falling leg towards 137.32 support. On the upside, above 144.06 will bring retest of 145.62 high.
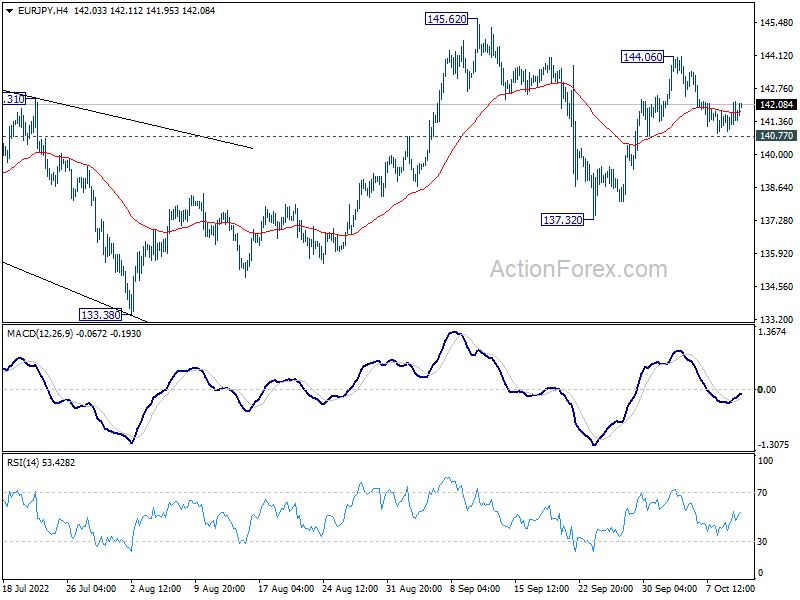
In the bigger picture, as long as 133.38 support holds, the up trend from 114.42 (2020 low) could still extend through 145.62 high. In that case, next target is 149.76 (2015 high). However, sustained break of 133.38 will be a sign of medium term bearish reversal and bring deeper fall to 124.37 support first.
EUR/GBP Daily Outlook
Daily Pivots: (S1) 0.8758; (P) 0.8809; (R1) 0.8894; More...
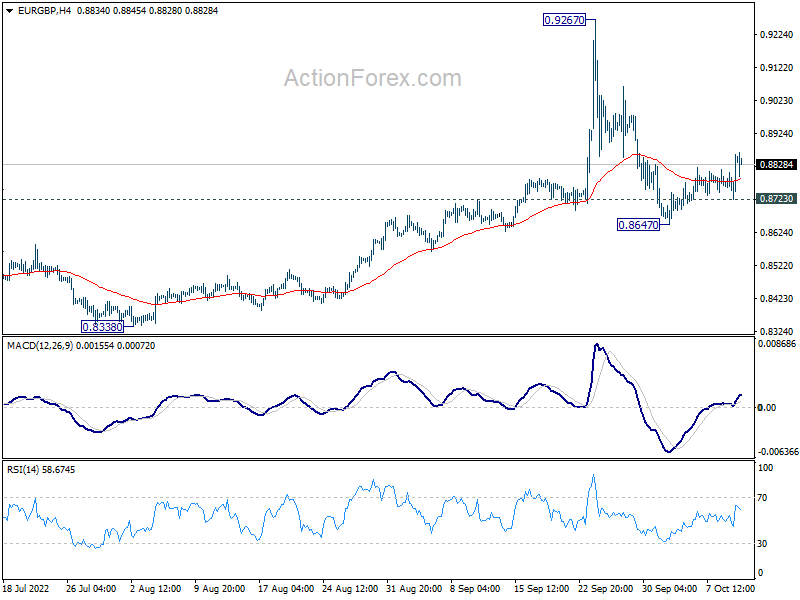
EUR/GBP's breach of 0.8848 minor resistance argues that pull back from 0.9267 might have completed at 0.8647 already, supported above 55 day EMA. Intraday bias is mildly on the upside for retesting 0.9267 high. Nevertheless, break of 0.8723 minor support will turn bias back to the downside for resuming the fall from 0.9267 through 0.8647.
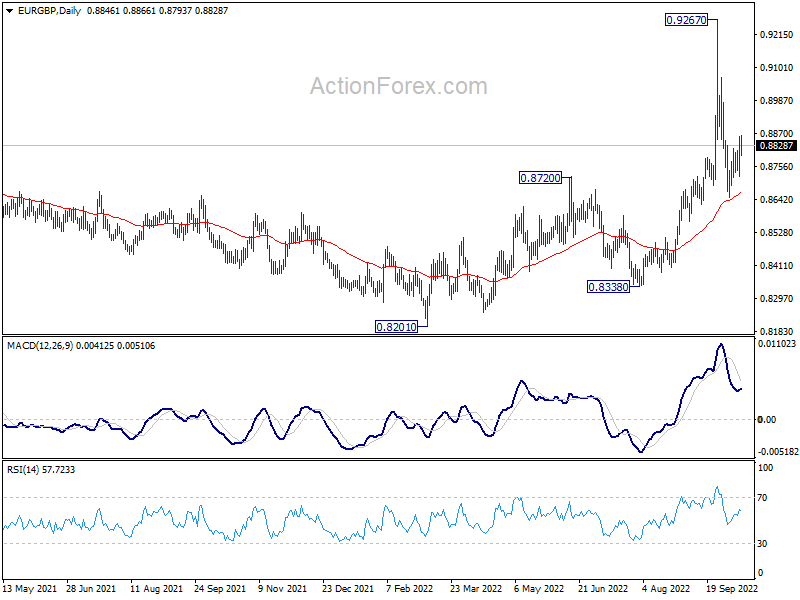
In the bigger picture, as long as 0.8720 resistance turned support holds, rise from 0.8201 is seen as resuming larger up trend from 0.6935 (2015 low). Break of 0.9499 (2020 high) should be seen at a later stage. However, firm break of 0.8720 will argue that sideway pattern from 0.9499 is extending with another falling leg instead.
EUR/AUD Daily Outlook
Daily Pivots: (S1) 1.5403; (P) 1.5461; (R1) 1.5525; More...
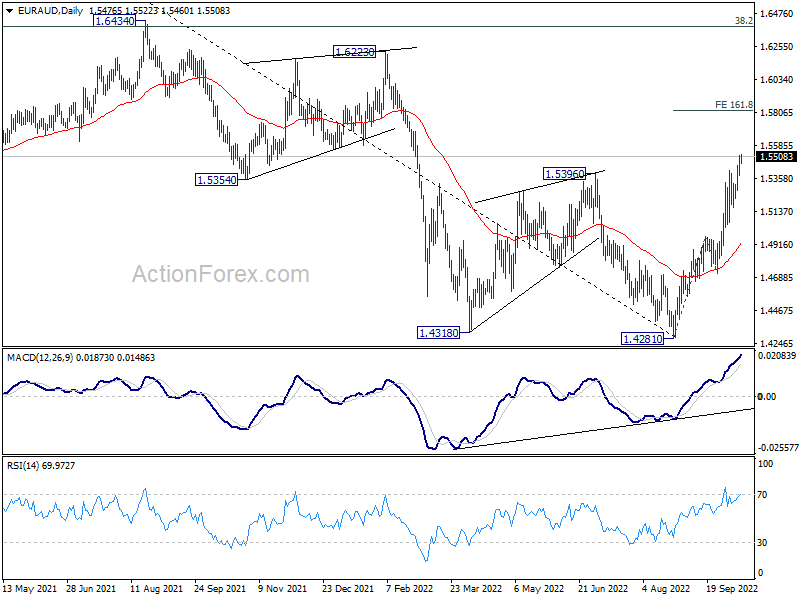
Intraday bias in EUR/AUD remains on the upside at this point. Current rally from 1.4281 should target 161.8% projection of 1.4281 to 1.4965 from 1.4716 at 1.5823. For now, outlook will remain bullish as long as 1.5165 support holds, in case of retreat.
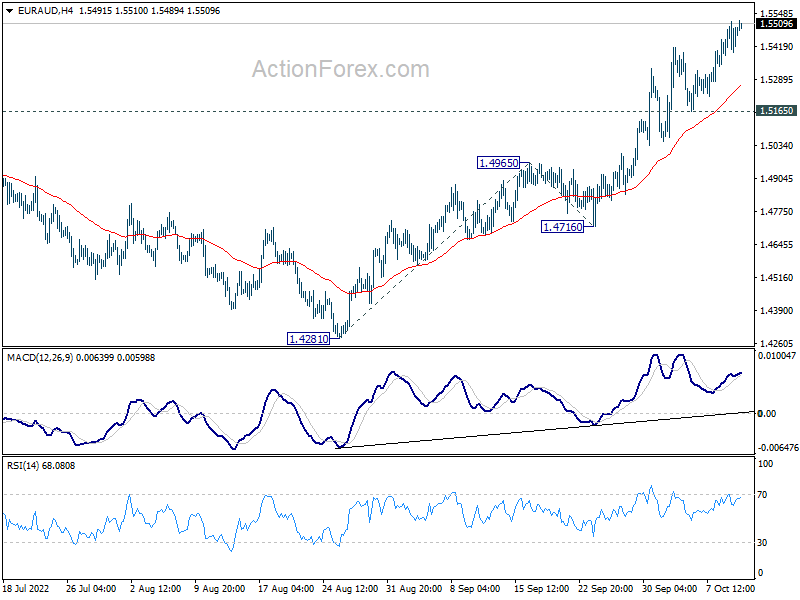
In the bigger picture, a medium term bottom should be in place at 1.4281, on bullish convergence condition in daily MACD. Further rise would be seen back to 1.6434 key resistance next. Break of 1.4965 resistance turned support is needed to indicate reversal. Otherwise, further rally will remain in favor.
EUR/CHF Daily Outlook
Daily Pivots: (S1) 0.9656; (P) 0.9686; (R1) 0.9703; More....
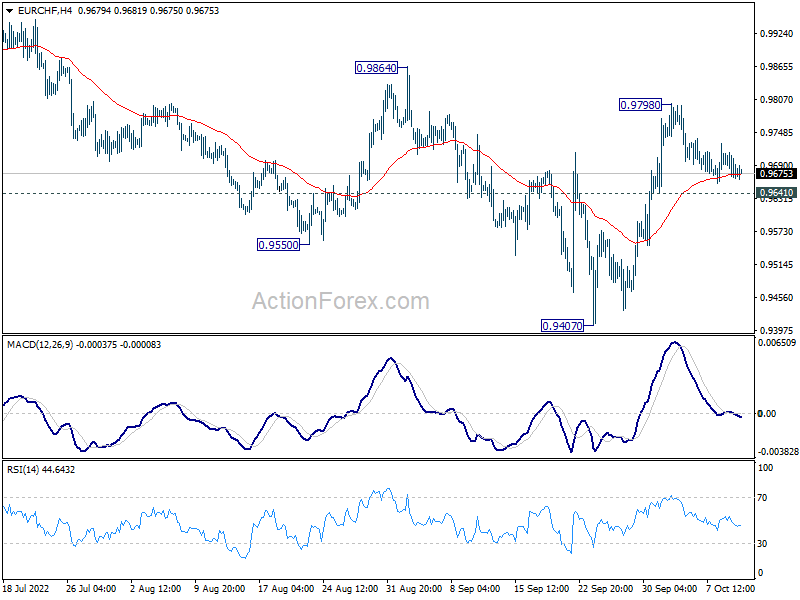
Intraday bias in EUR/CHF remains neutral at this point. On the upside, above 0.9798 will resume the rebound to 0.9864 resistance. Firm break there will solidify the case of medium term bottoming at 0.9407, and target 38.2% retracement of 1.1149 to 0.9407 at 1.0072. On the downside, below 0.9641 minor support will turn bias back to the downside for retesting 0.9407 low instead.
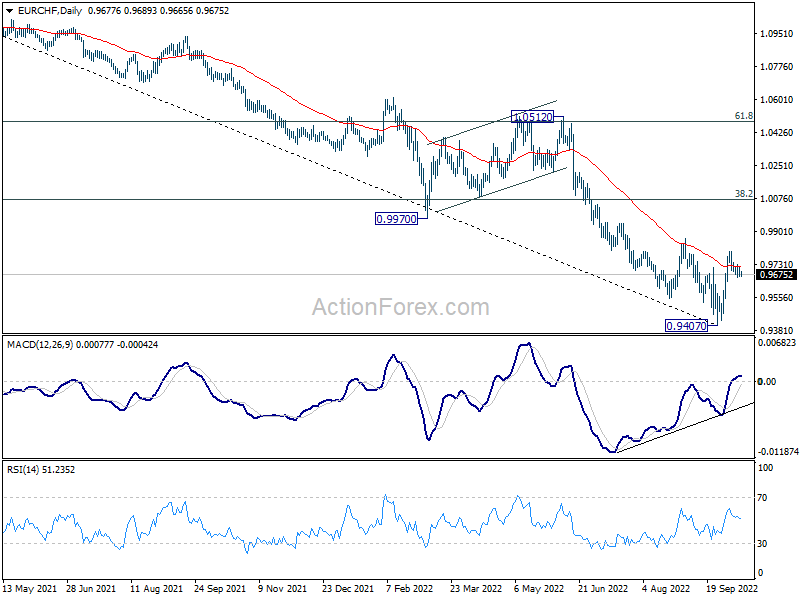
In the bigger picture, as long as 0.9864 resistance holds, long term down trend from 1.2004 (2008 high) is expected to continue. Next target is 138.2% projection of 1.2004 to 1.0505 to 1.1149 at 0.9033. However, firm break of 0.9864 will confirm medium term bottoming, on bullish convergence condition in daily MACD. Stronger rally would then be seen back to 55 week EMA (now at 1.0152), even as a corrective rebound.
Technical Outlook and Review
USD/JPY:
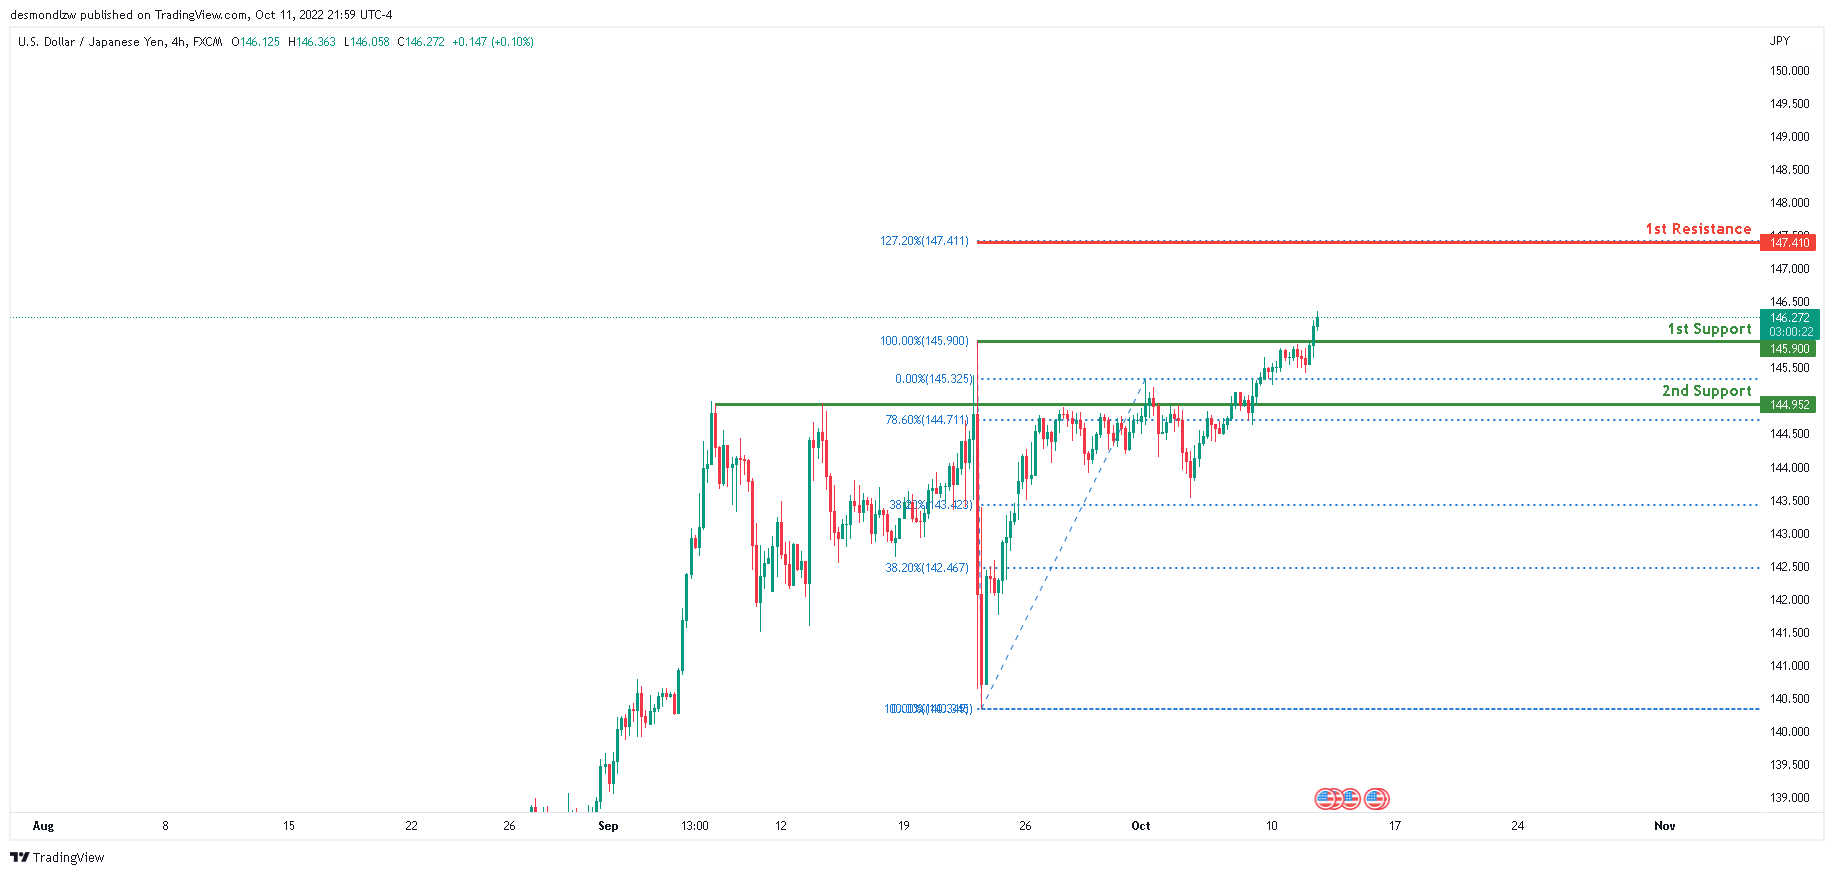
Looking at the H4 chart, the current overall bias for USDJPY is bullish . To add confluence to this bias, the price is currently above the Ichimoku cloud which indicates a bullish market. Overnight, the price has continued it’s bullish momentum upwards and closed above the 1st support line at 145.900 where the 100% Fibonacci line is located. If the bullish momentum continues, expect price to possibly head towards the 1st resistance line at 147.410, where the 127.2% Fibonaaci extension line is located.
Areas of consideration:
- H4 time frame, 1st resistance at 147.410
- H4 time frame, 1st support at 145.900
DXY:
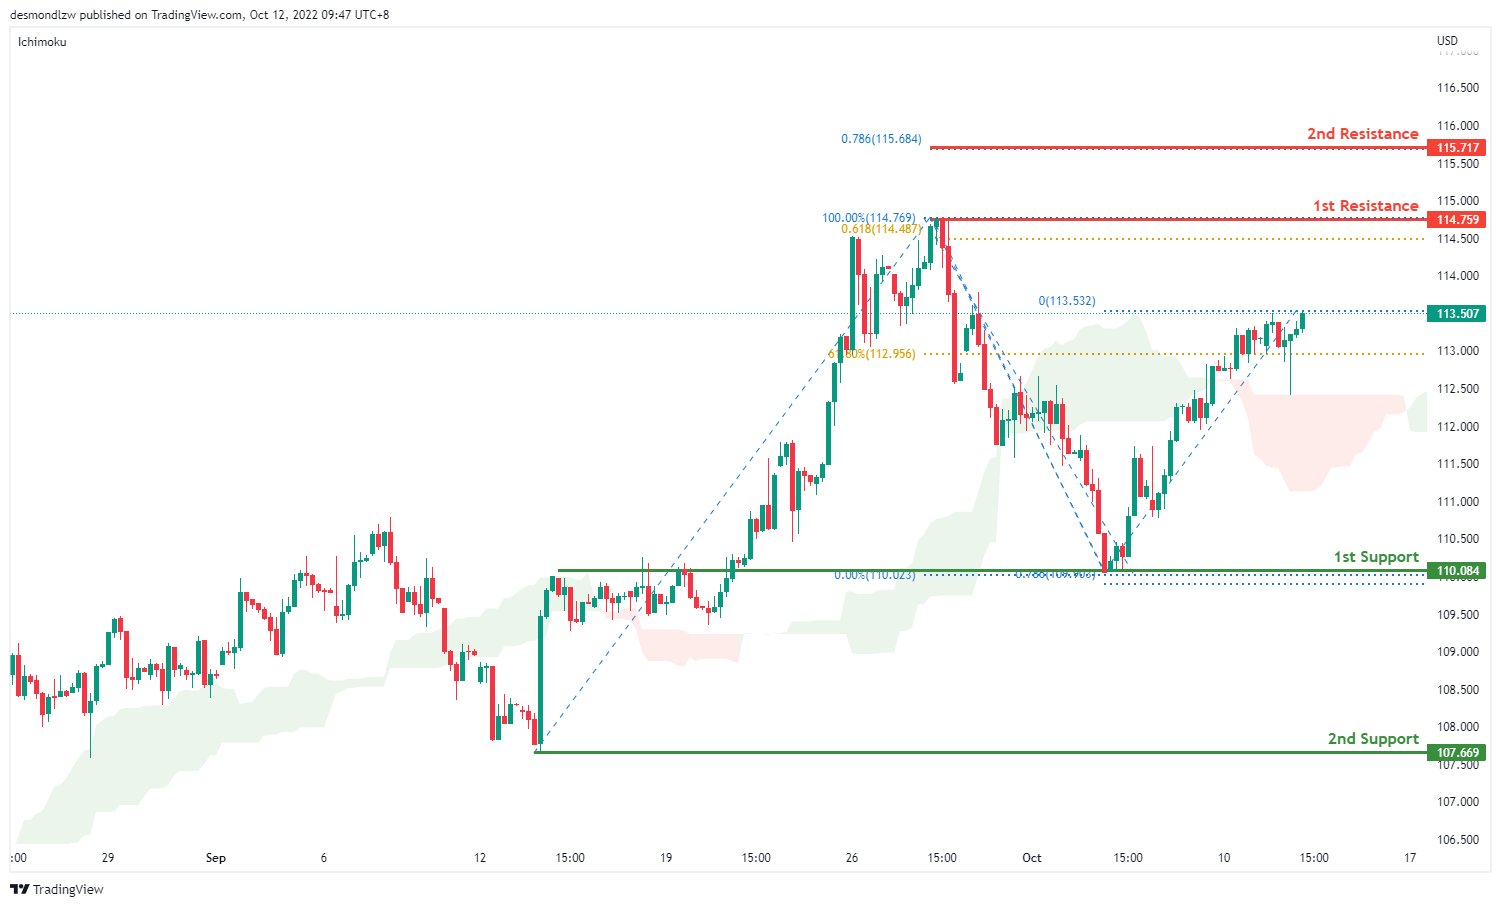
On the H4 chart, prices are moving in an ascending trend signalling slight bullish momentum. It is currently moving towards the first resistance at 114.759 where the previous swing high sits. If bullish momentum continues it will bring price to 115.717 where the 78.6% projection. Alternatively, prices could test the first support at 110.084 where the swing low sits. if it breaks this level, bearish momentum will bring price to second support at 107.669
Areas of consideration:
- H4 time frame, 1st resistance at 114.759
- H4 time frame, 1st support at 110.084
EUR/USD:
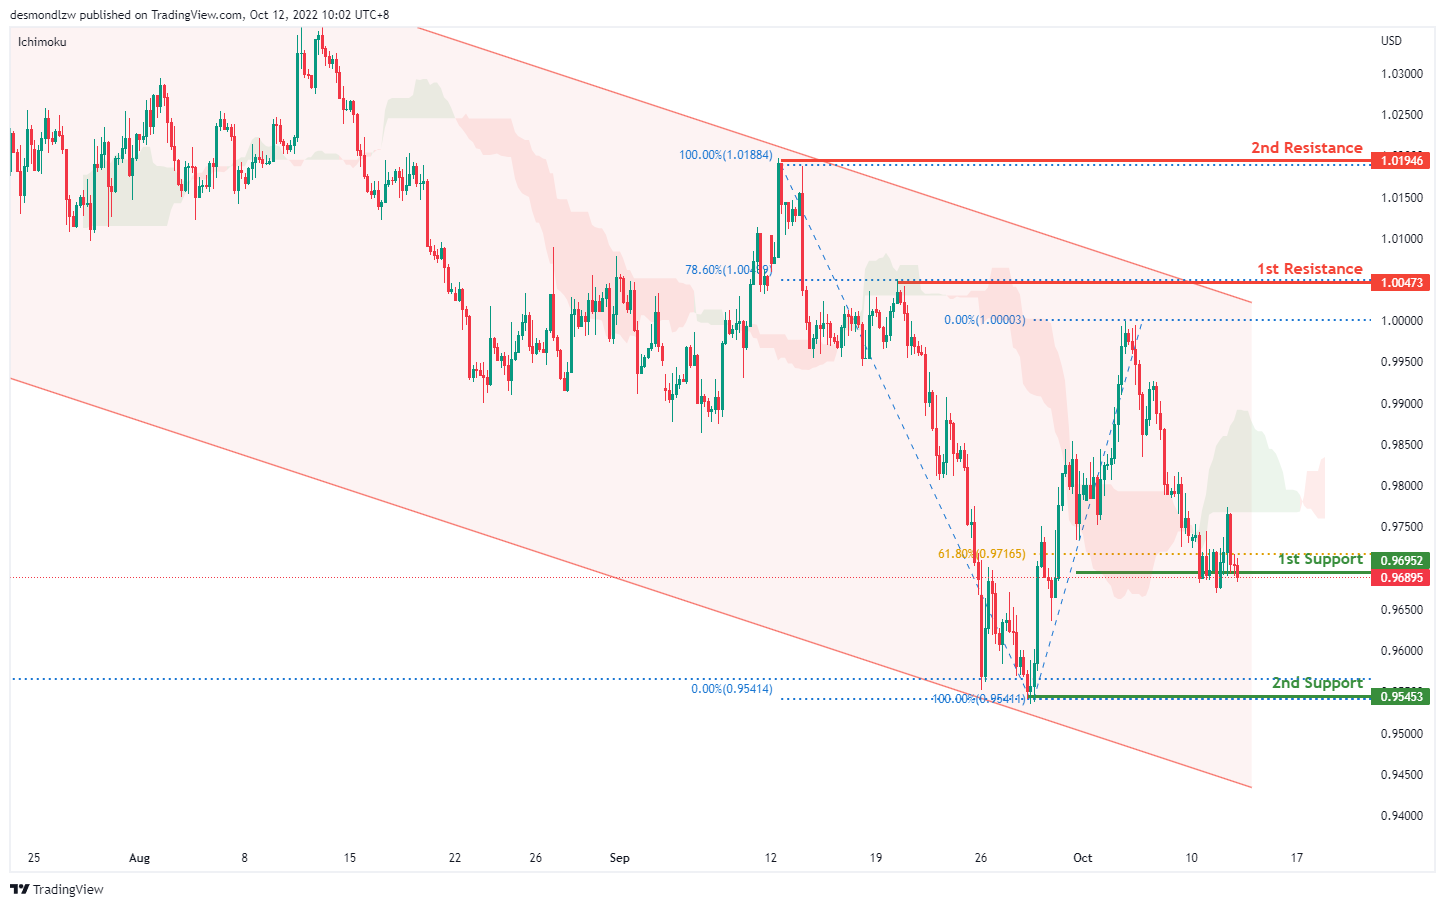
On the H4, price is moving within the descending trendline in a descending manner, with the price moving below ichimoku cloud- we are bearish biassed. Price is testing the first support at 0.9695 where the 61.8% retracement sits. If it breaks this level, bearish momentum will bring price to the second support at 0.9545 where the swing low and 161.8% extension sit. Alternatively, price may test the first resistance at 1.0047 where the 78.6% retracement sits. If price breaks this level, it may test the second resistance at 1.0194, where the previous swing high sits
Areas of consideration :
- H4 1st resistance at 1.0047
- H4 2nd resistance at 1.0194
GBP/USD:
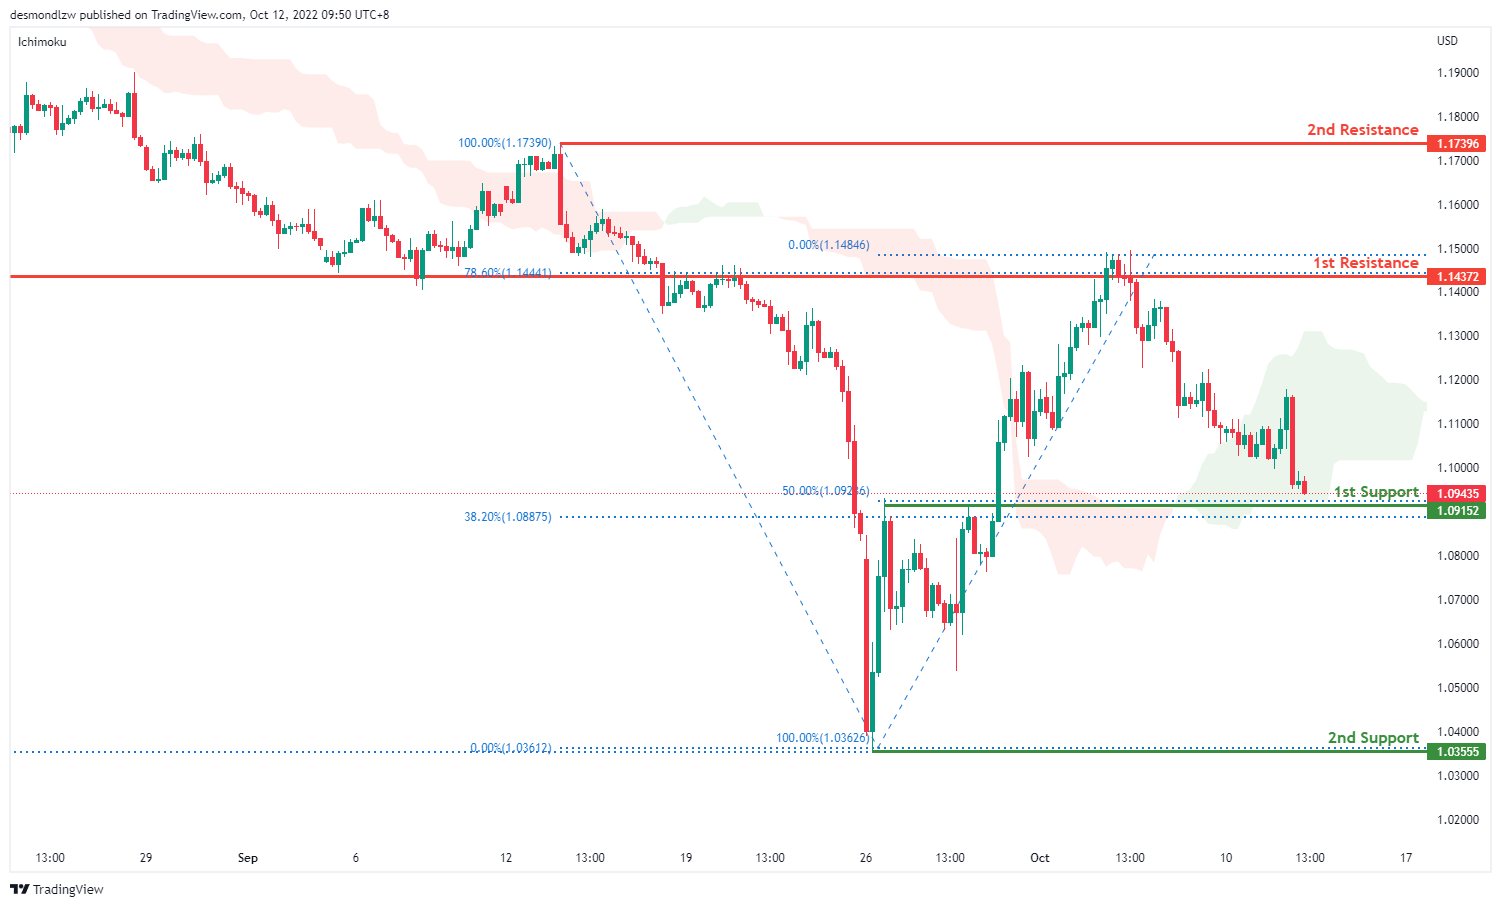
On the H4, price has rejected the first resistance and is moving in a descending trend hence we are bearish bias- price might break the ichimoku to test the first support at 1.0915 where the 50% retracement sits. If it breaks this level, bearish momentum will bring price to the second support at 1.0355 where the previous swing low sits. Alternatively price can test the first resistance at 1.1437 where the 78.6% retracement and overlap resistance sit. Subsequently the second resistance at 1.1739
Areas of consideration:
- H4 1st support at 1.0915
- H4 1st resistance at 1.1437
USD/CHF:
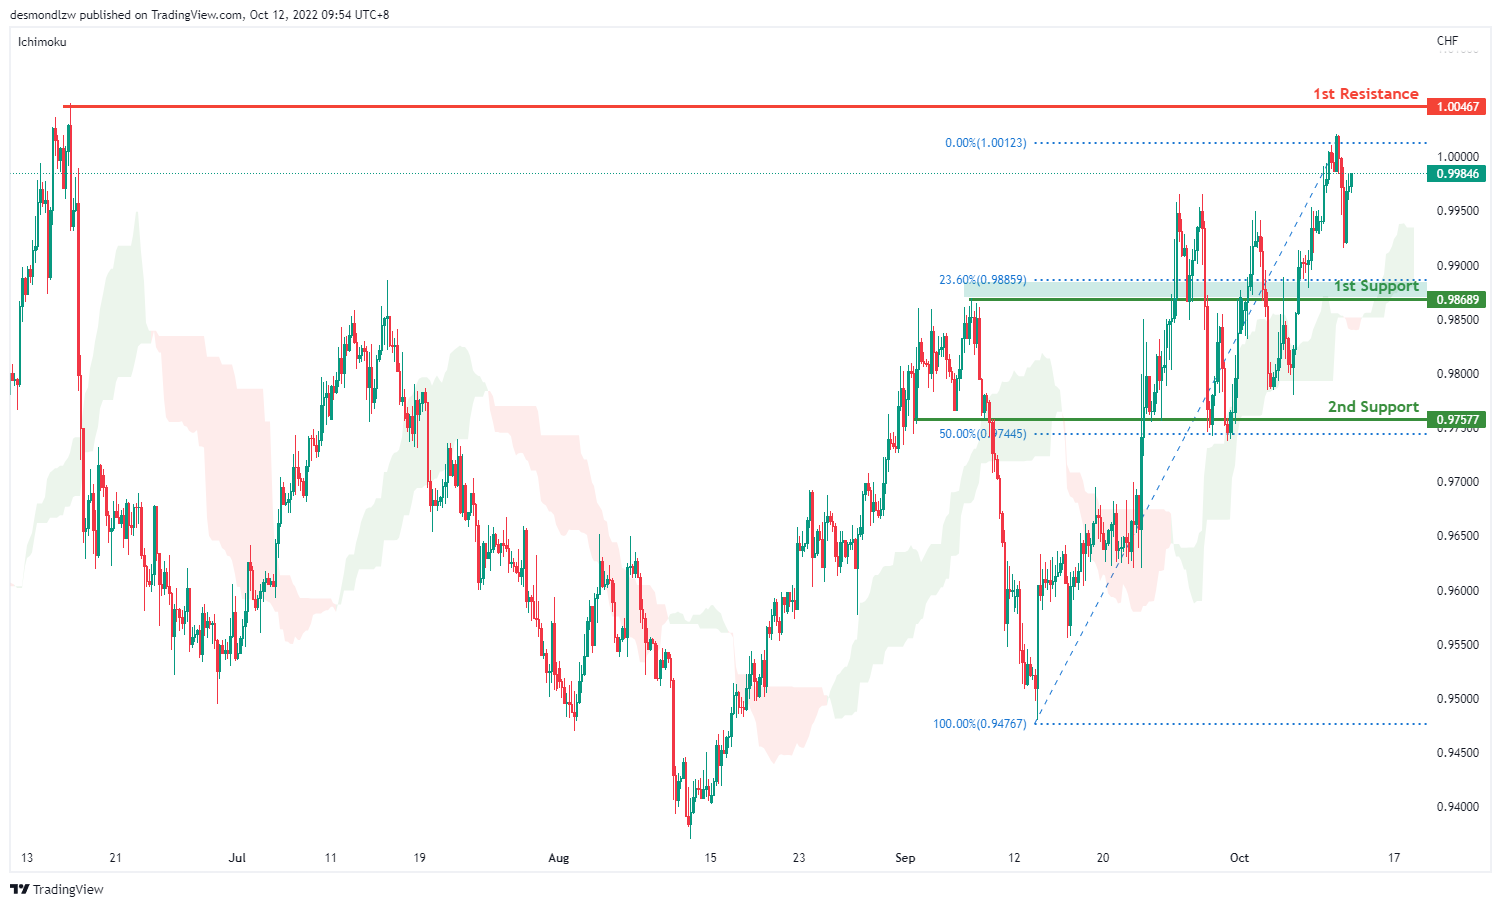
USDCHF is in a strong bullish trend on the H4 chart. Price is trading above the Ichimoku cloud signalling a bullish trend. Price looks like it’s moving toward the first resistance 1.0046 where the previous swing high sits. Alternatively price can test the first support at 0.9868 where the overlap support and 23.6% retracement sits then the second support at 0.9757 where the 50% retracement sits
Areas of consideration
- H4 1st support at 0.9868
- H4 1st resistance at 1.0046
XAU/USD (GOLD):
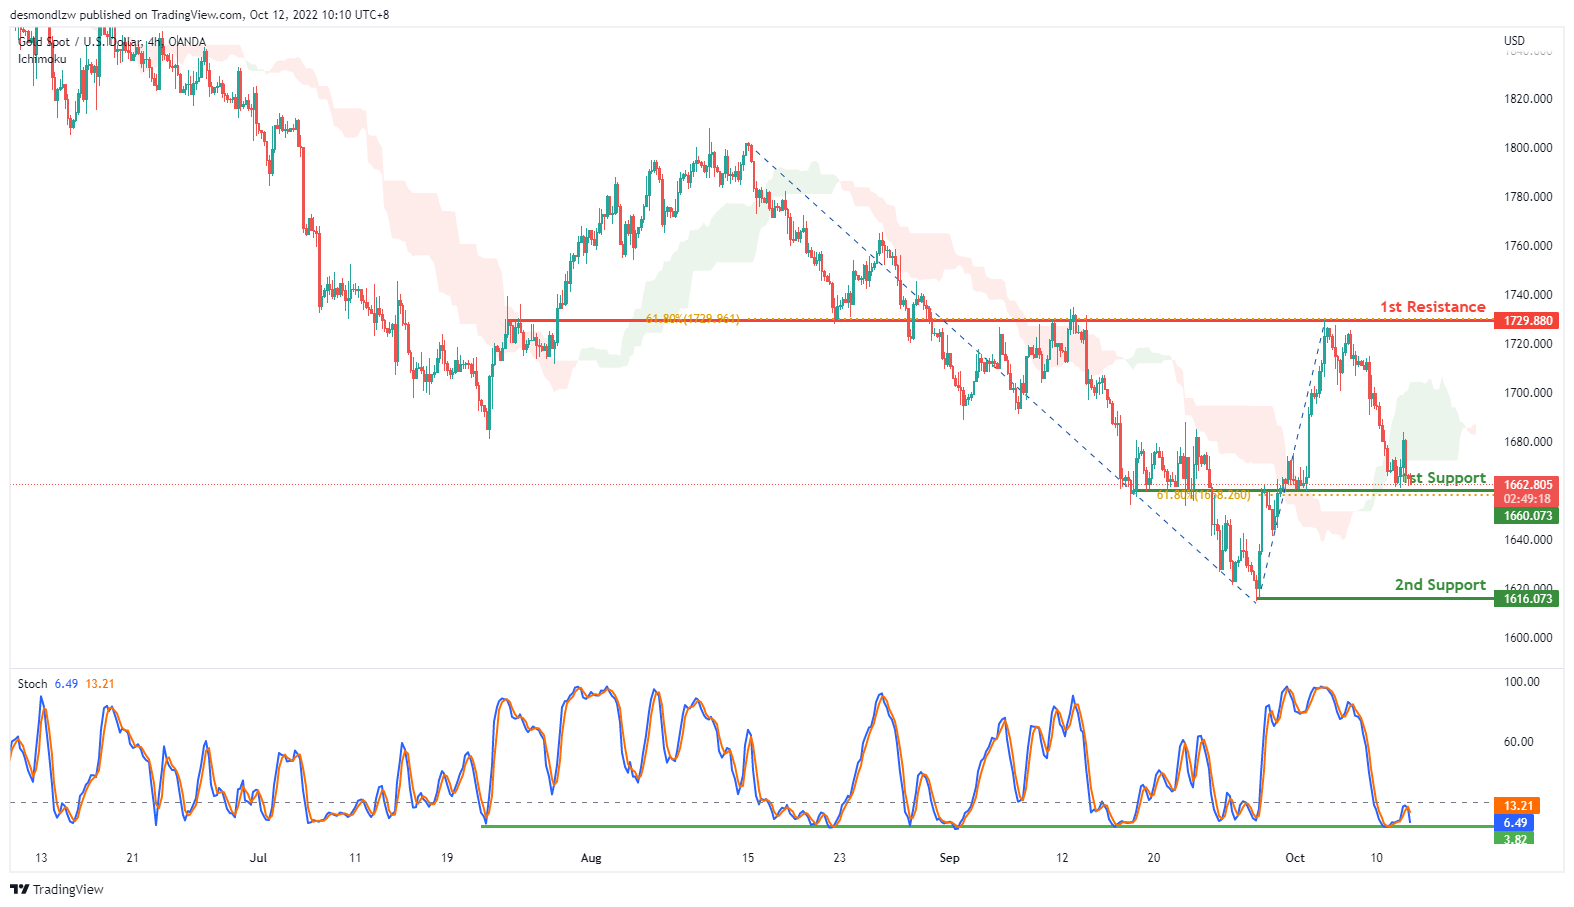
On the H4, price is dropping to test the 1st support at 1662.925, which is in line with the 61.8% fibonacci retracement and overlap support, as the price is above ichimoku cloud and stoch is reaching support level , we can expect the price bounce off from 1st support and rise to the 1st resistance at 1729.880, where the 61.8% fibonacci retracement and previous swing high is. Alternatively, the price may break the 1st support and drop to the 2nd support at 1616.073, where the swing low is.
Areas of consideration:
- H4 time frame, 1st support at 1662.925
- H4 time frame,1st resistance at 1729.880
AUD/USD:
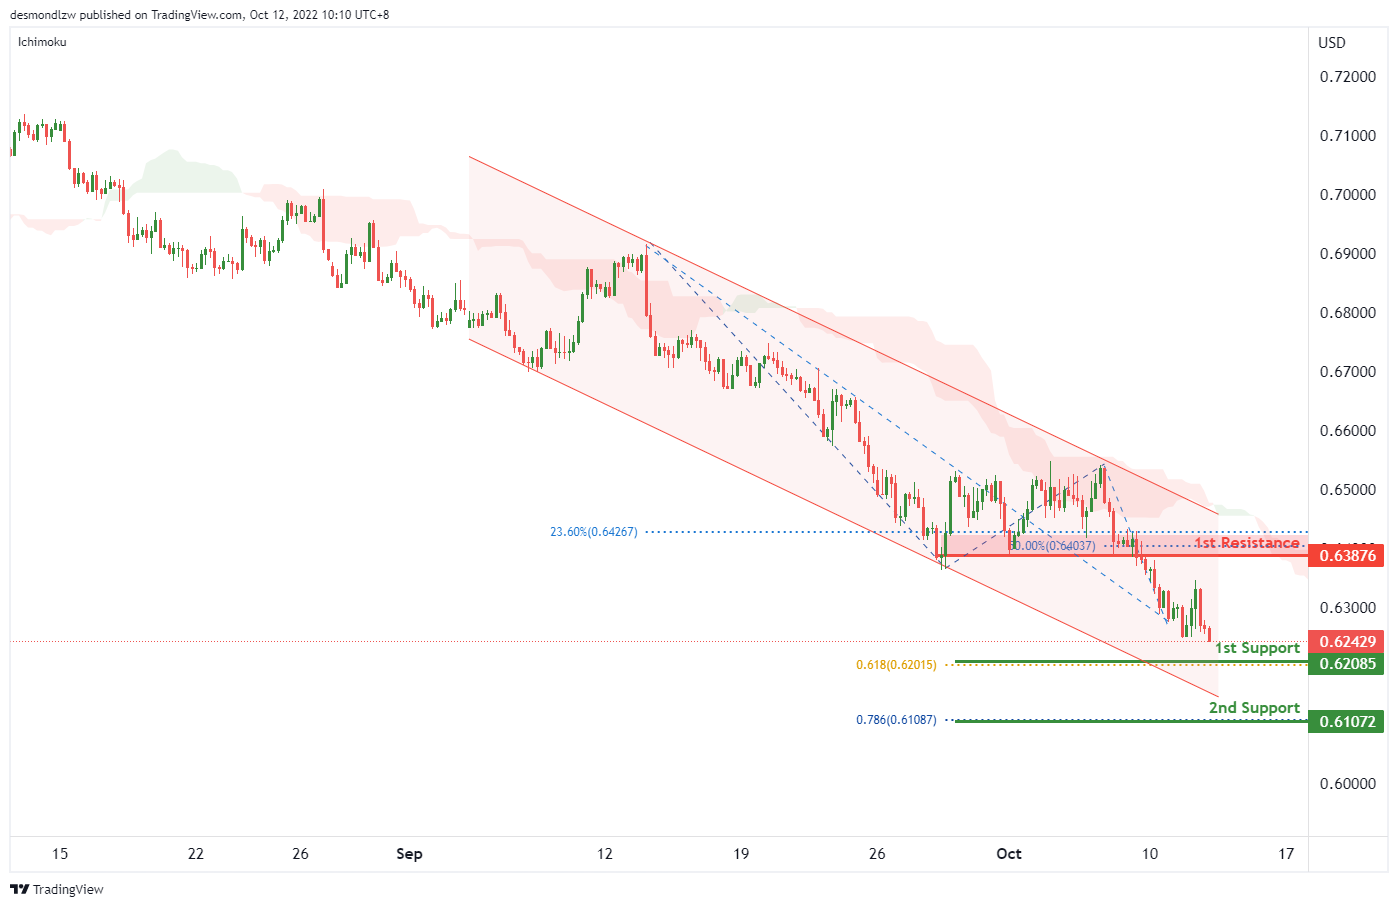
On the H4, the price is moving within the descending channel and below ichimoku cloud, we have a bearish bias that the price may drop to the 1st support at 0.62085, which is in line with the 61.8% fibonacci projection. If the 1st support is broken, the 2nd support could be at 0.61072, where the 78.6% fibonacci projection is. Alternatively, the price may rise to the 1st resistance at 0.63876, which is in line with the 23.6% fibonacci retracement and 50% fibonacci retracement.
Areas of consideration
- H4, 1st support at 0.63509,
- H4, 2nd support at 0.61072
NZD/USD:
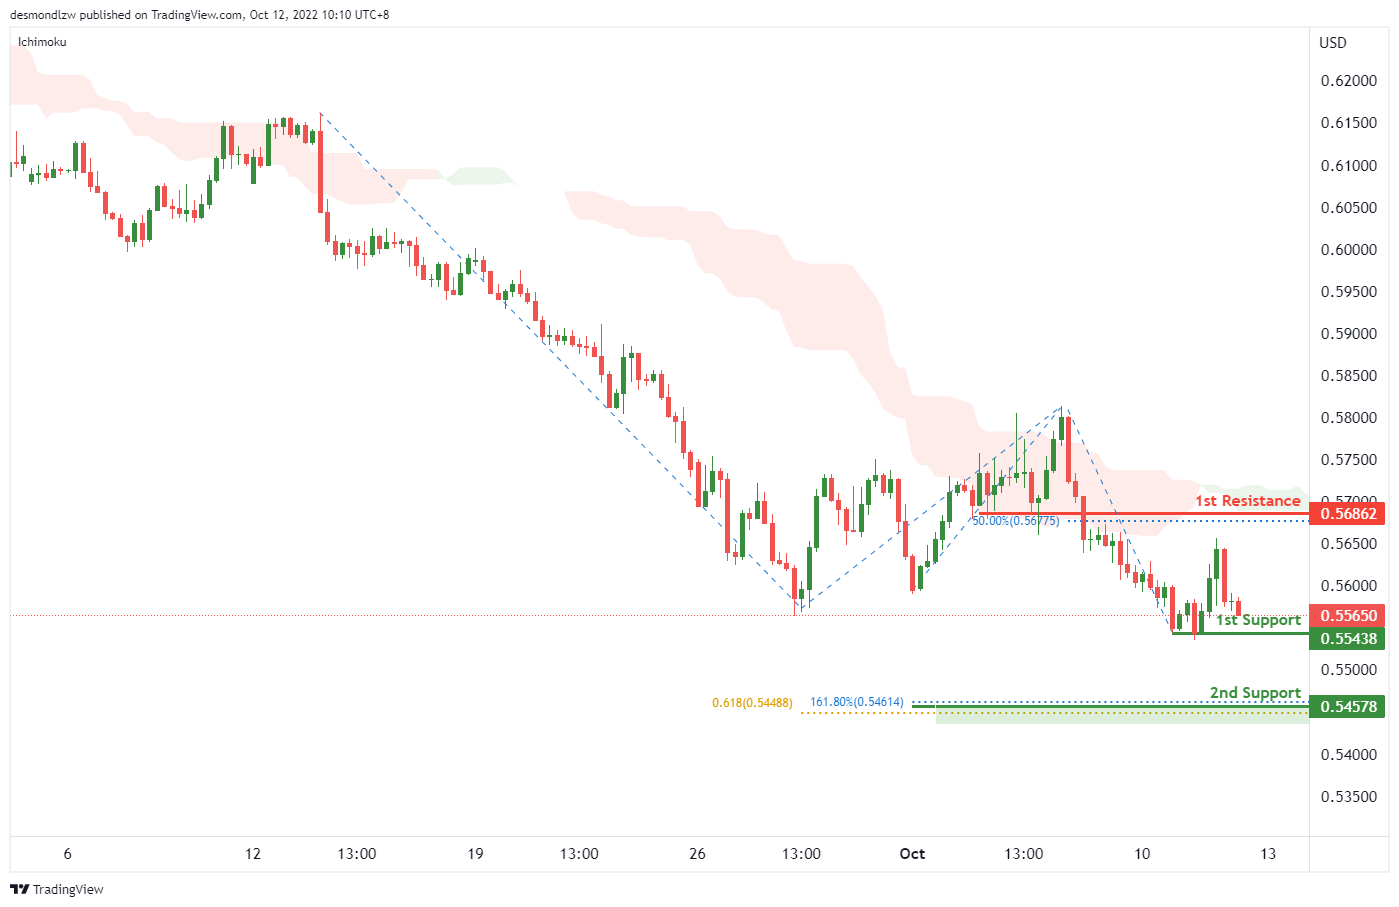
On the H4, the price is below ichimoku cloud and testing the 1st support at 0.55438, which is in line with the swing low, if the 1st support is broken, the price may drop to the 2nd support at 0.54578, which is in line with the 161.8% fibonacci extension and 61.8% fibonacci projection. ALternatively, the price may bounce off from the 1st support and rise to the 1st resistance at 0.56862, where the 50% fibonacci retracement is.
Areas of consideration:
- H4 time frame, 1st support at 0.55438
- H4 time frame, 2nd support at 0.54578
USD/CAD:
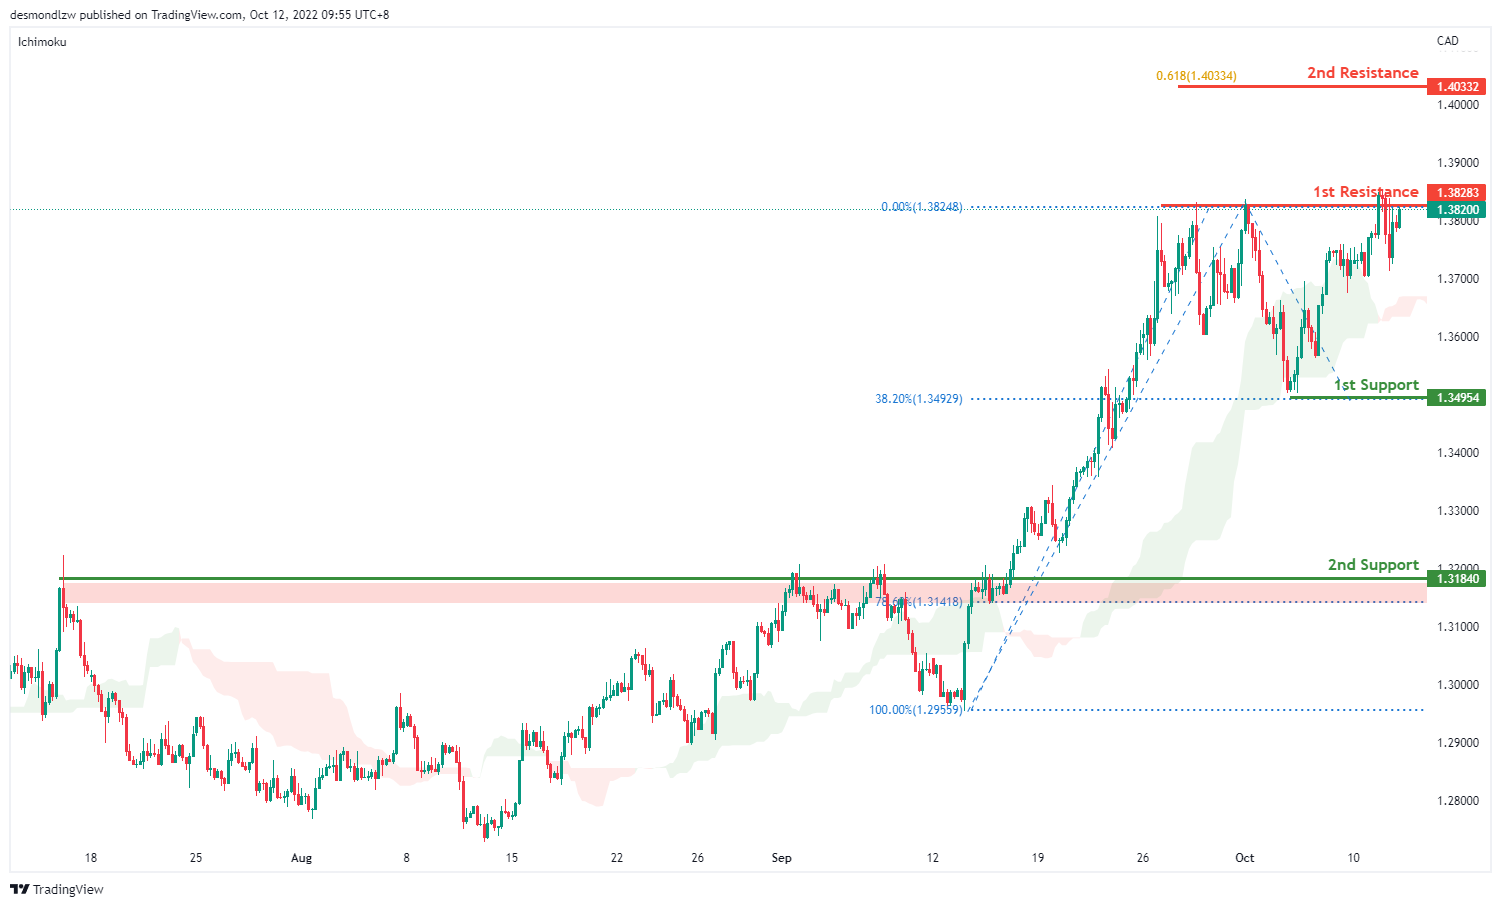
On the H4, the price trades higher near the 1st resistance of 1.3832 which is the previous swing high level. With the price trading above the ichimoku cloud, we have a short term bullish bias. The price could break the first resistance to test the second resistance at 1.4033 where the 61.8% projection sits. Alternatively it could fall to the 1st support at 1.3495 which is in line with the 38.2% retracement level and the previous swing low subsequently the second support at 1.3184 where the overlap support sits
Areas of consideration:
- H4 time frame, 1st resistance at 1.3828
- H4 time frame, 1st support at 1.3495
OIL:
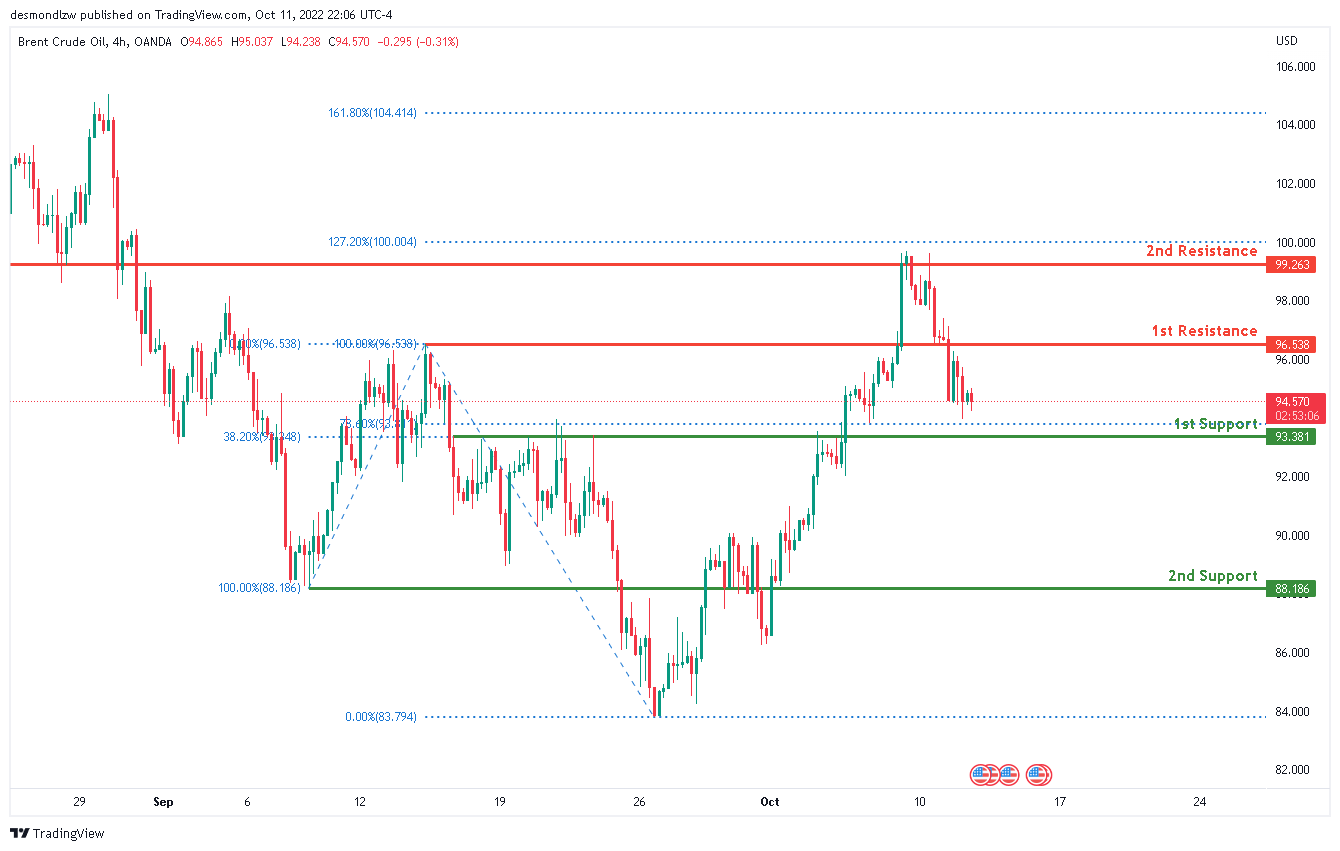
Looking at the H4 chart, the current overall bias for Oil is bullish . To add confluence to this bias, the price is currently above the Ichimoku cloud which indicates a bullish market. Overnight, price has continued it’s bearish retraced backdownards.. If the bearish momentum continues, expect price to possibly head towards the 1st support line at 93.381, where the 78.6% Fibonaaci line and 38.2% Fibonaaci line is located.
Areas of consideration:
- H4 time frame, 1st resistance at 96.538
- H4 time frame, 1st support at 93.381
Dow Jones Industrial Average:
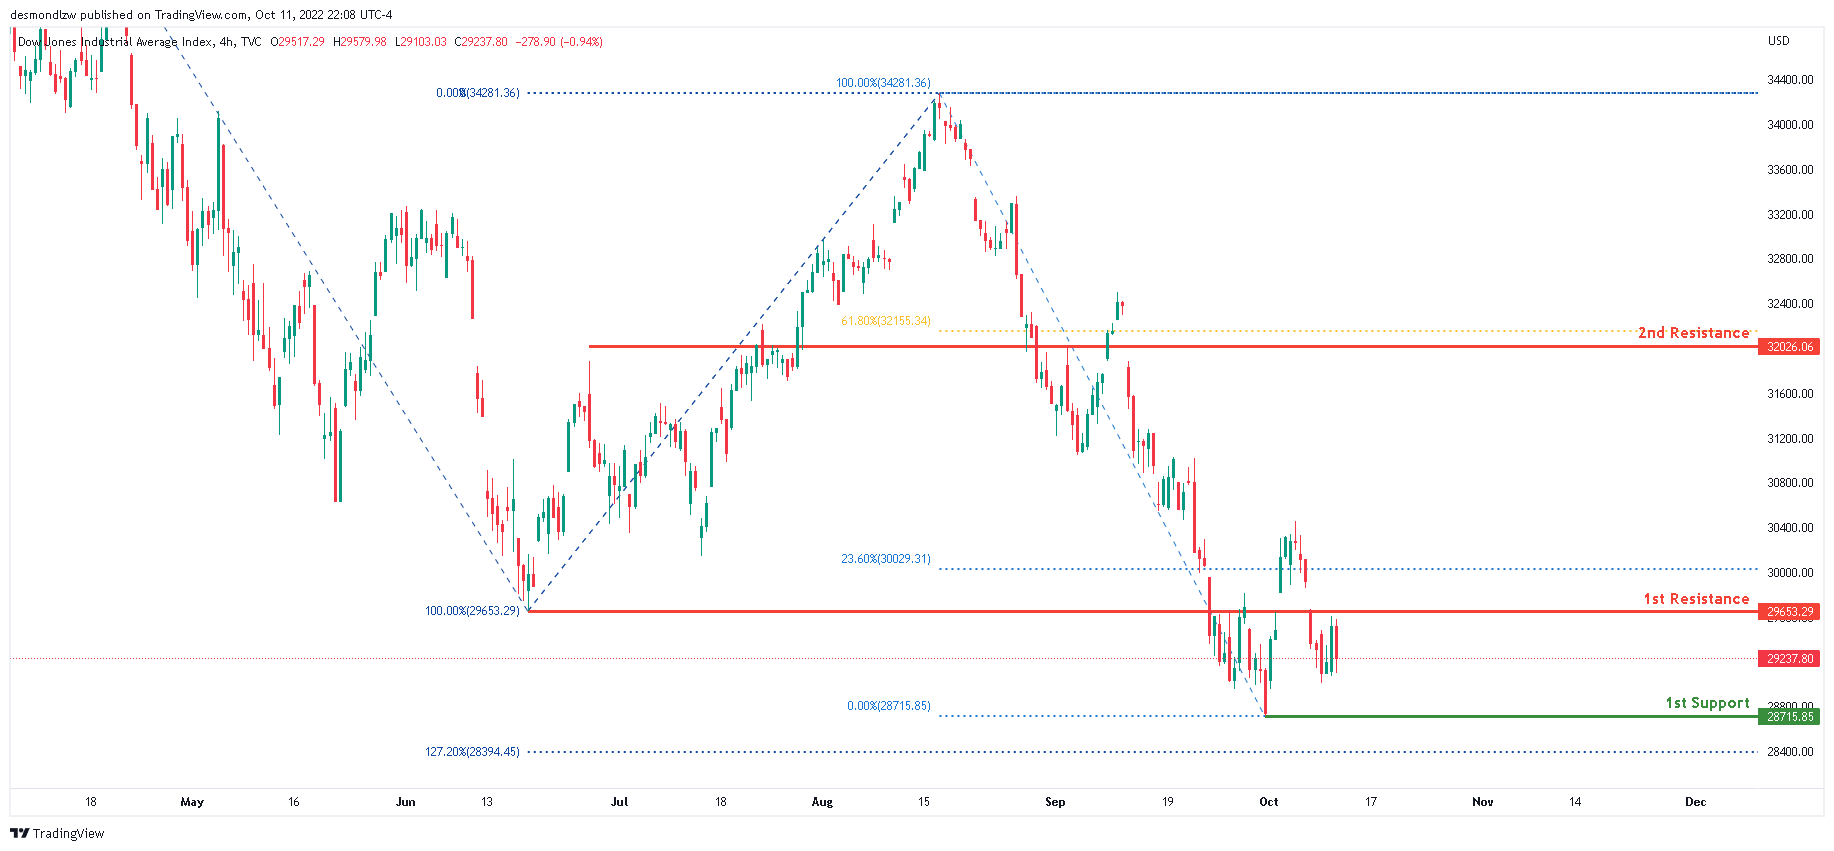
Looking at the H4 chart, the current overall bias for DJI is bearish. To add confluence to this bias, the price is currently below the Ichimoku cloud which indicates a bearish market. Overnight, price has continued to consolidate between the 1st support and 1st resistance. If the bearish momentum continues, expect price to possibly head towards the 1st support line at 28715.85, where the 0% Fibonacci line and 127.2% Fibonacci extension line is located.
Areas of consideration:
- H4 time frame, 1st support at 28715.85
- H4 time frame, 1st resistance at 29653.29
DAX:
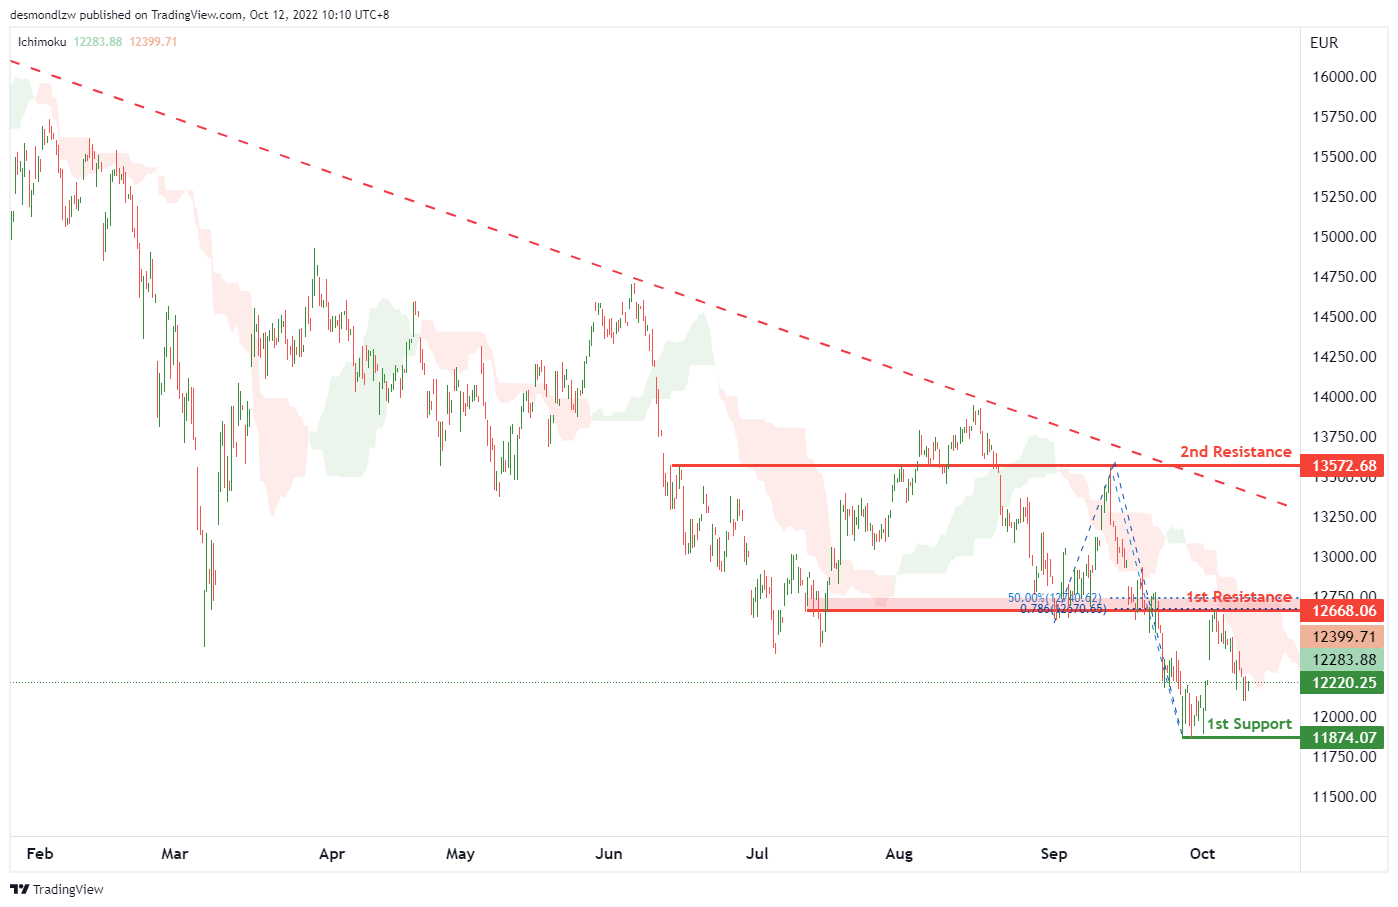
On the H4, with the price moving below ichimoku cloud and long term descending trendline, we have a bearish bias that the price may drop to the 1st support at 11874.07, which is in line with the swing low. Alternatively, the price may rise to the 1st resistance at 12668.06, which is in line with the 50% fibonacci retracement, 78.6% fibonacci projection and overlap resistance, if the 1st resistance is broken, the 2nd resistance could be at 13572.68, where the previous swing high is.
Areas of consideration:
- H4 time frame, current price
- H4 time frame, 1st support at 11874.07
ETHUSD:
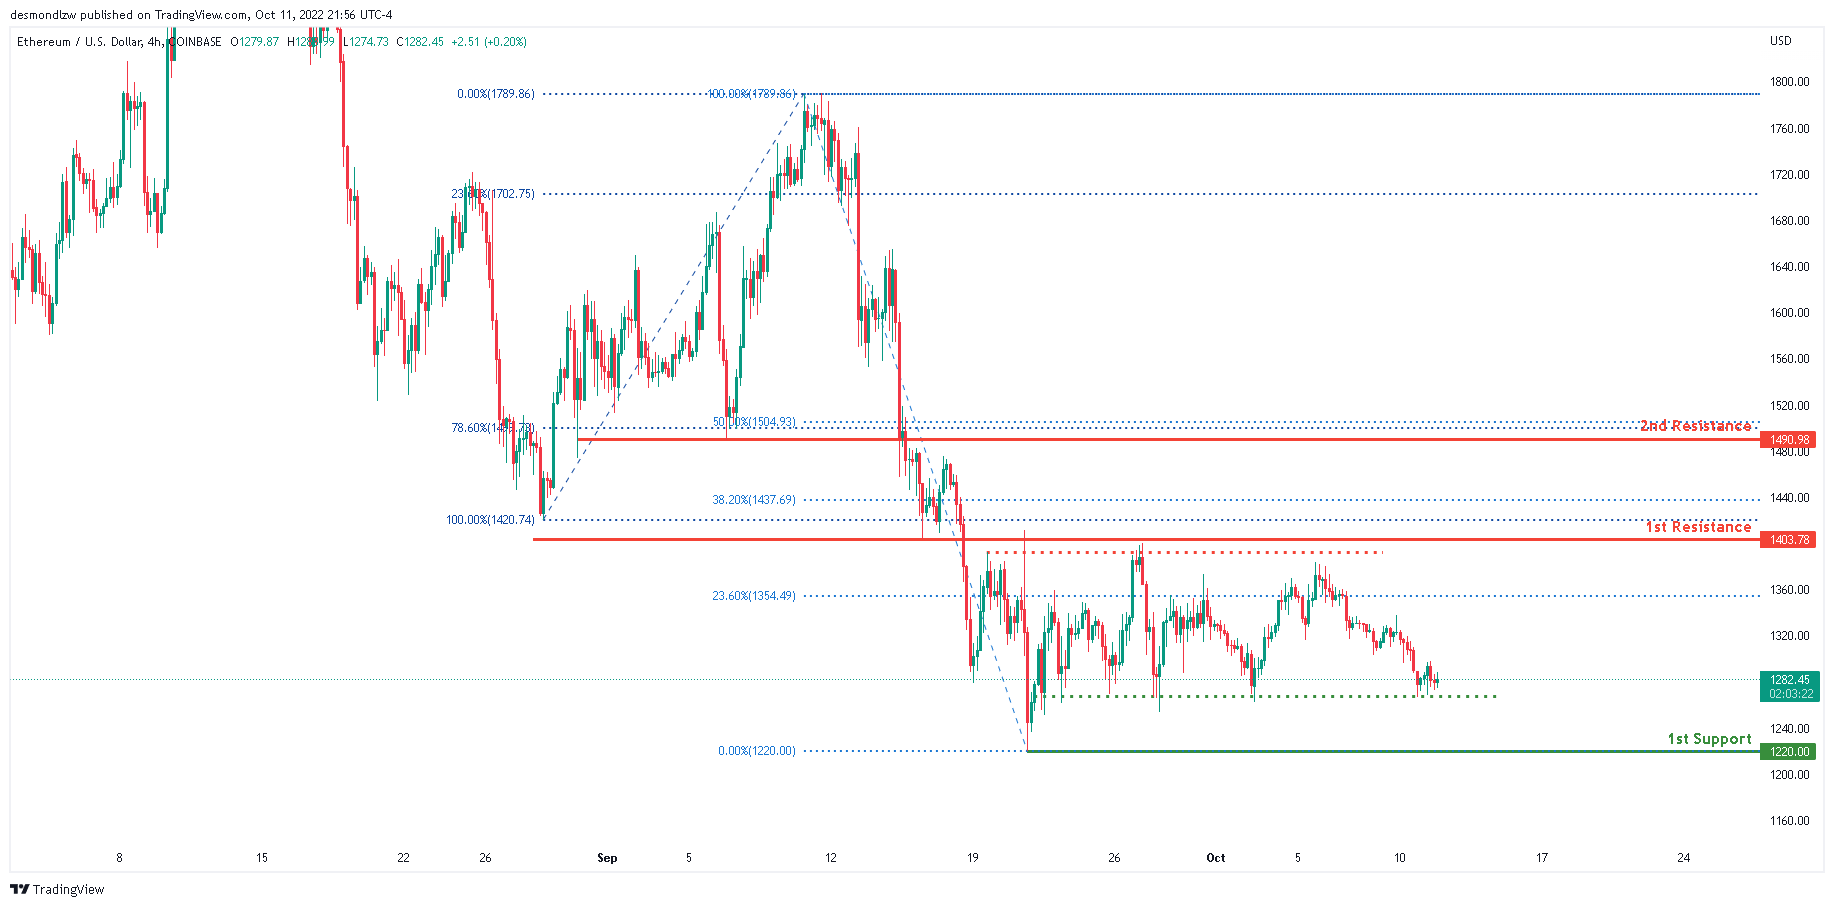
Looking at the H4 chart, the current overall bias for ETHUSD is bearish. To add confluence to this bias, the price is currently under the Ichimoku cloud which indicates a bearish market. Overnight, the price has continued it’s bearish momentum downwards. Price has been consolidating between the 1403 and 1220 area for the past 3 weeks. If the bearish momentum continues, expect price to possibly head towards the 1st support line at 1220.00, where the 0% Fibonaaci line is located.
Areas of consideration:
- H4 time frame, 1st resistance of 1420.74
- H4 time frame, 1st support at 1220.00
BTCUSD:
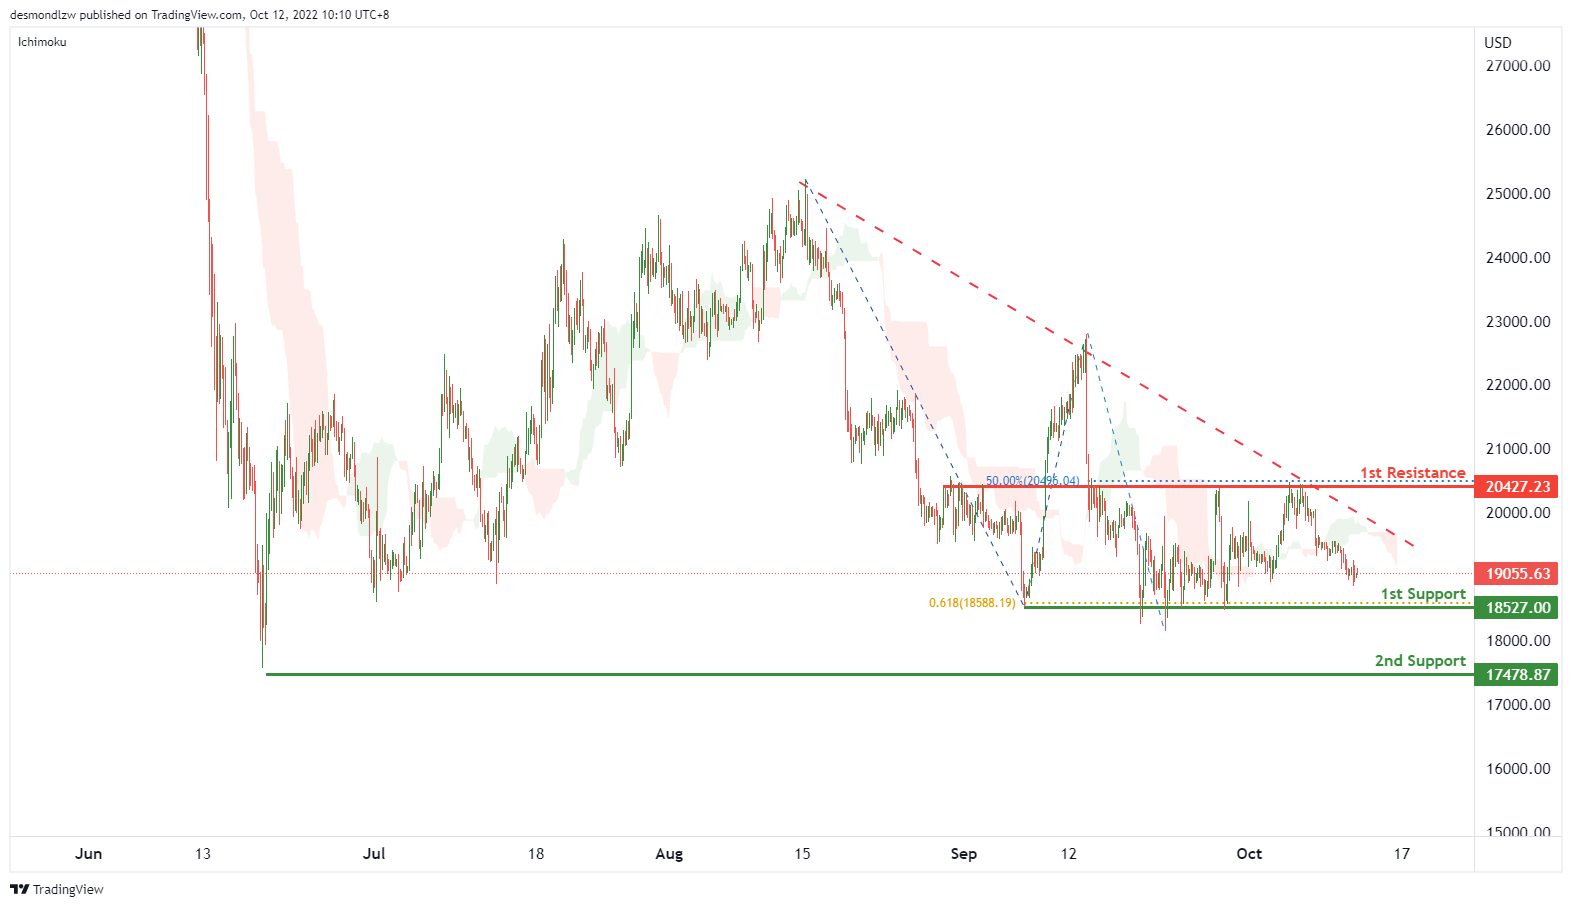
On the H4, price is showing a descending trendline and below the ichimoku cloud, we can expect the price drop to test the 1st support at 18527.00, which is in line with the swing lows and 61.8% fibonacci projection. If the 1st support is broken, we can expect the price to drop to the 2nd support at 17478.87, where the previous swing low is. Alternatively, the price may rise to the 1st resistance at 20427.23, where the overlap resistance and 50% fibonacci retracement are.
Areas of consideration:
- H4 time frame, 1st support at 18527.00
- H4 time frame, 2nd support at 17478.87
S&P 500:
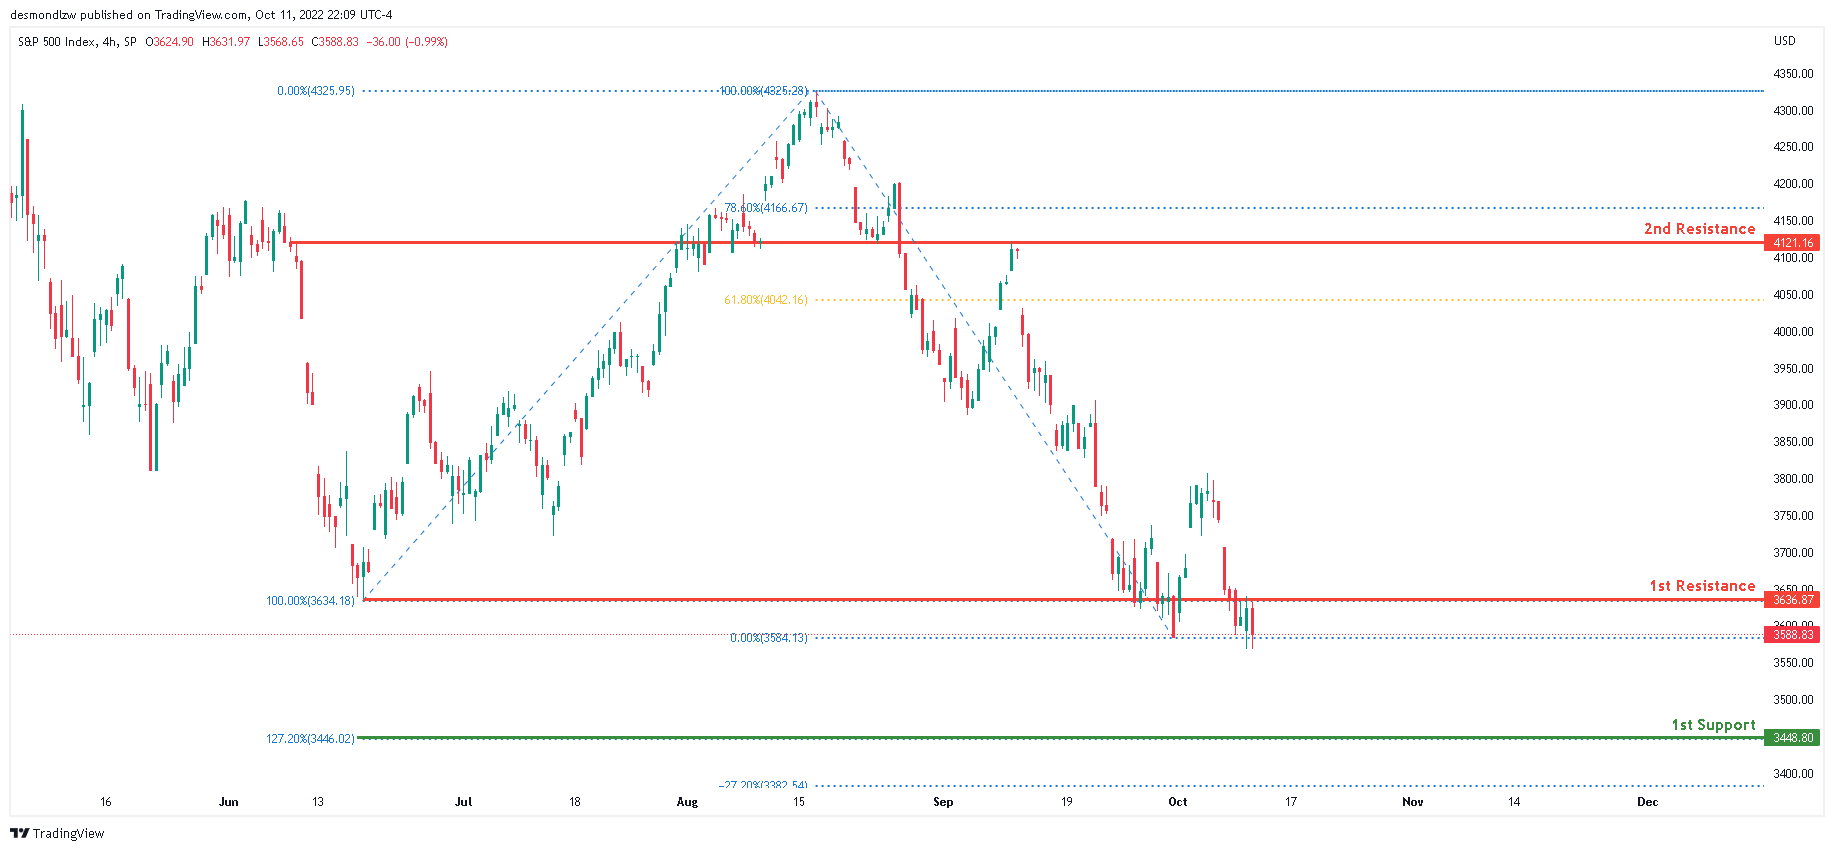
Looking at the H4 chart, the current overall bias for S&P500 is bearish. To add confluence to this bias, the price is currently under the Ichimoku cloud which indicates a bearish market. Overnight, the price has continued to consolidate under the 1st resistance line at 3636.87, where the 100% Fibonacci line and previous swing low is located. If the bearish momentum continues, expect price to possibly head towards the 1st support line at 3448.80, where the 127.2% Fibonaaci line is located.
Areas of consideration:
- H4 time frame, 1st support at 3448.80
- H4 time frame, 1st resistance at 3636.87
USD/CAD Daily Outlook
Daily Pivots: (S1) 1.3722; (P) 1.3788; (R1) 1.3862; More...
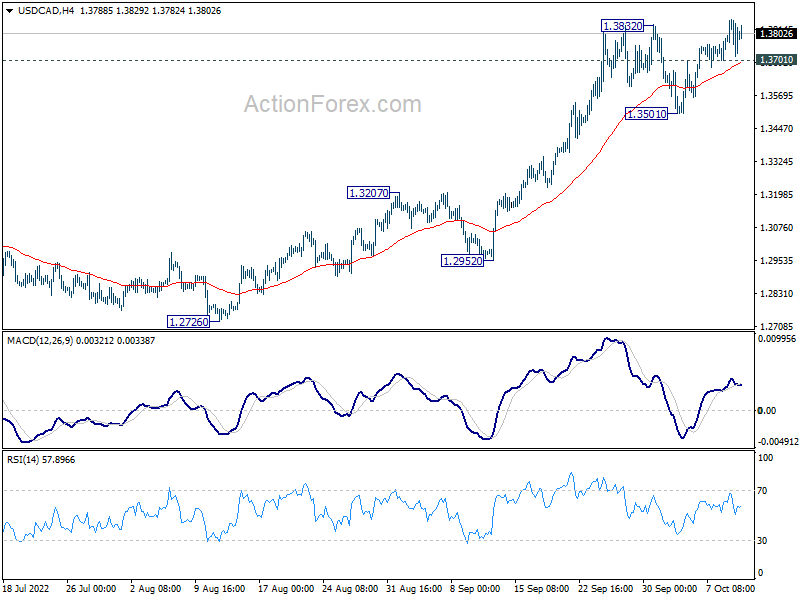
Intraday bias in USD/CAD stays on the upside with 1.3701 minor support intact. Current up trend should target 161.8% projection of 1.2005 to 1.2947 from 1.2401 at 1.3925. Decisive break there will target 200% projection at 1.4285. On the downside,e below 1.3701 minor support will turn intraday bias neutral first. but outlook will stays bullish as long as 1.3501 support holds, in case of retreat.
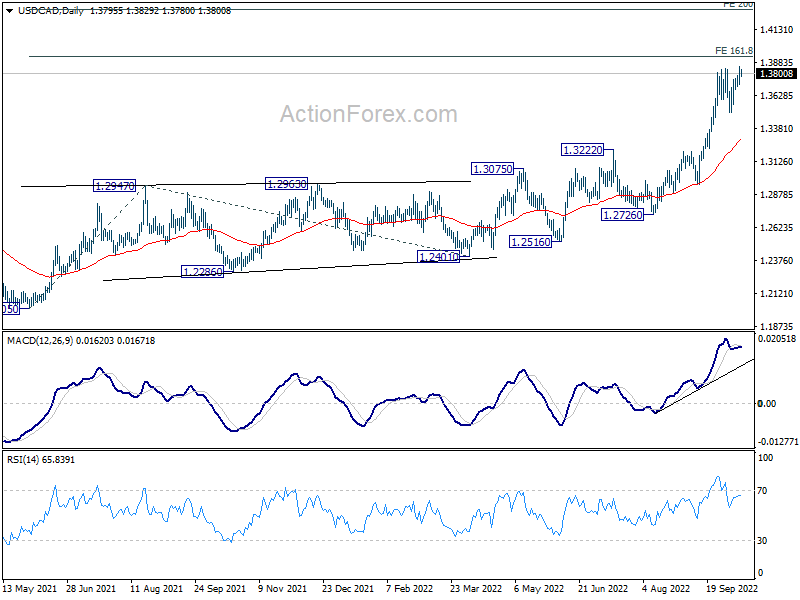
In the bigger picture, up trend from 1.2005 (2021 low) is still in progress. Based on current impulsive momentum, it could be resuming long term up trend from 0.9056 (2007 low). Whether it is or it isn't, retest of 1.4689 (2016 high) should be seen next. This will now remain the favored case as long as 1.3222 resistance turned support holds.
AUD/USD Daily Report
Daily Pivots: (S1) 0.6231; (P) 0.6289; (R1) 0.6329; More...
Intraday bias in AUD/USD stays on the downside at this point as down trend is in progress. Next target is 100% projection of 0.7660 to 0.6680 from 0.7135 at 0.6155. On the upside, above 0.6362 minor resistance will turn intraday bias neutral and bring consolidations. But outlook will remain bearish as long as 0.6539 resistance holds.
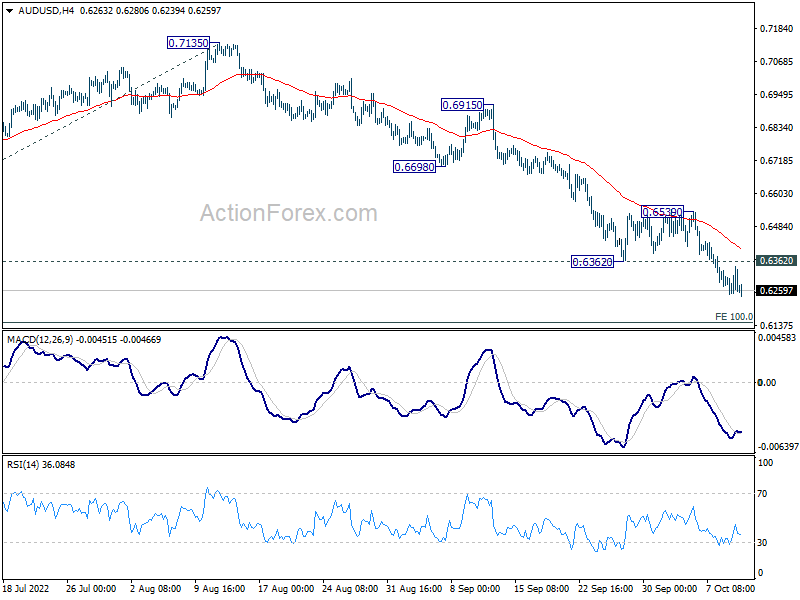
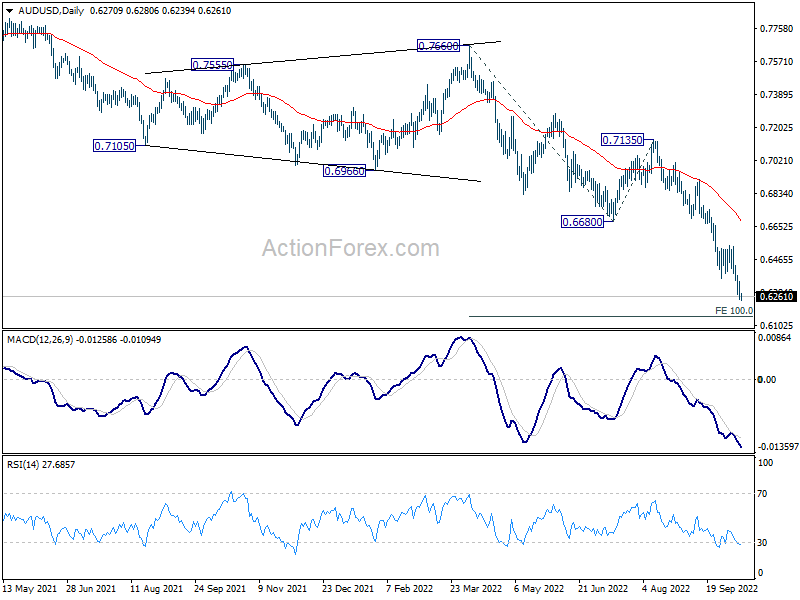
In the bigger picture, down trend form 0.8006 (2021 high) is expected to continue as long as 0.6680 support turned resistance holds. Next target is 0.5506 low. Medium term momentum will now be closely monitored to gauge the chance of break of 0.5506.
USD/JPY Daily Outlook
Daily Pivots: (S1) 145.56; (P) 145.73; (R1) 146.03; More...
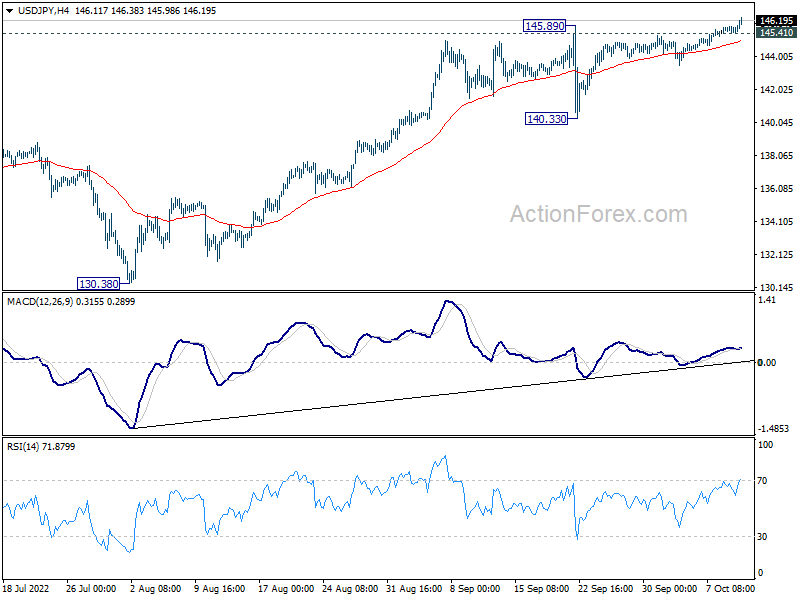
USD/JPY's break of 145.89 confirms up trend resumption. Intraday bias is back on the upside for 147.68 long term resistance. On the downside, break of 145.41 minor support will turn intraday bias neutral and bring consolidations again. But overall, outlook will remain bullish as long as 140.33 support holds, even in case of deep pullback.
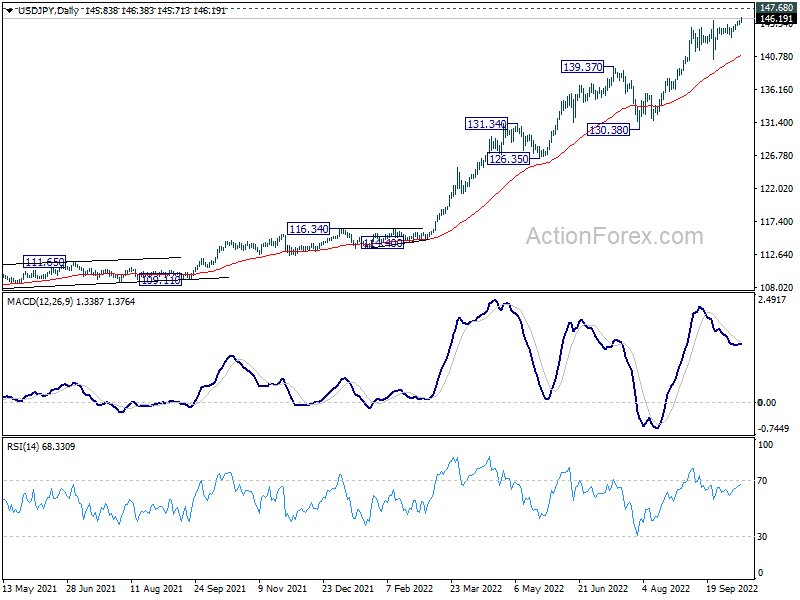
In the bigger picture, up trend from 101.18 is still in progress, as part of the whole up trend from 75.56 (2011 low). Further rise should be seen to 147.68 (1998 high). For now, break of 130.38 support is needed to be the first indication of medium term topping. Otherwise, outlook will stay bullish even in case of deep pull back.
USD/CHF Daily Outlook
Daily Pivots: (S1) 0.9916; (P) 0.9969; (R1) 1.0021; More...
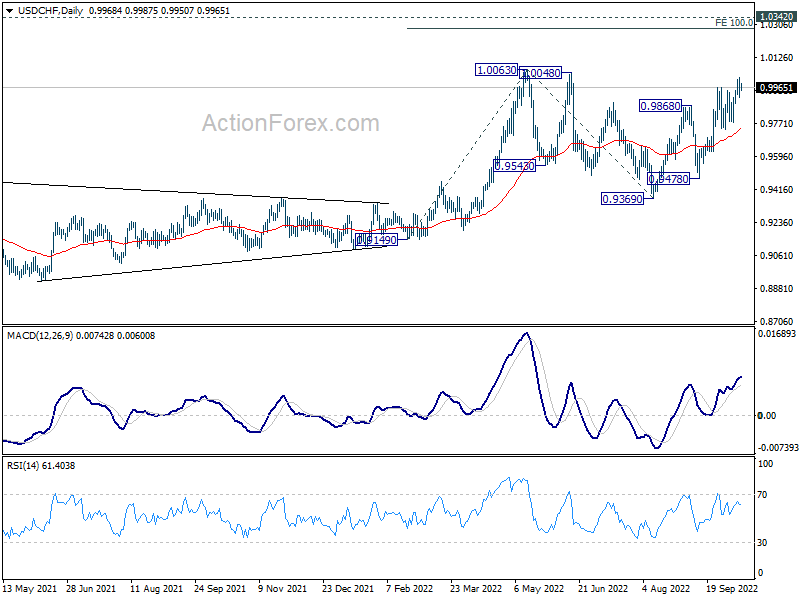
Intraday bias in USD/CHF remains neutral first. While deeper retreat cannot be ruled out, break of 0.9779 support is needed to indicate short term topping. Otherwise, outlook will stay cautiously bullish in case of retreat. On the upside, above 1.0019 will target 1.0063 high first. Decisive break there will resume larger up trend.
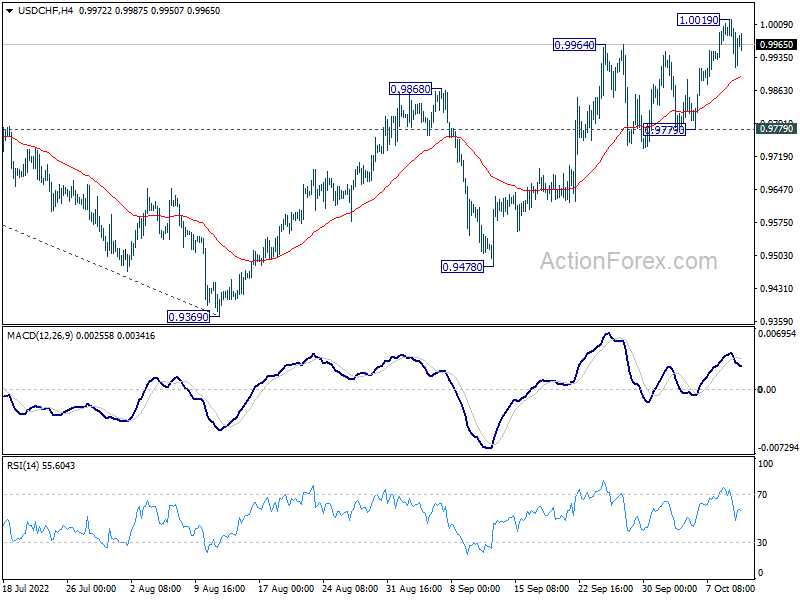
In the bigger picture, current development suggests that up trend from 0.8756 (2021 low) is still in progress. Sustained break of 1.0063 will target 100% projection of 0.9149 to 1.0063 from 0.9369 at 1.0283, and then 1.0342 (2016 high). For now, this will remain the favored case as long as 0.9369 support holds, even in case of deep pull back.