Sample Category Title
UK NIESR: Energy price guarantees to drive GDP growth higher in Q4
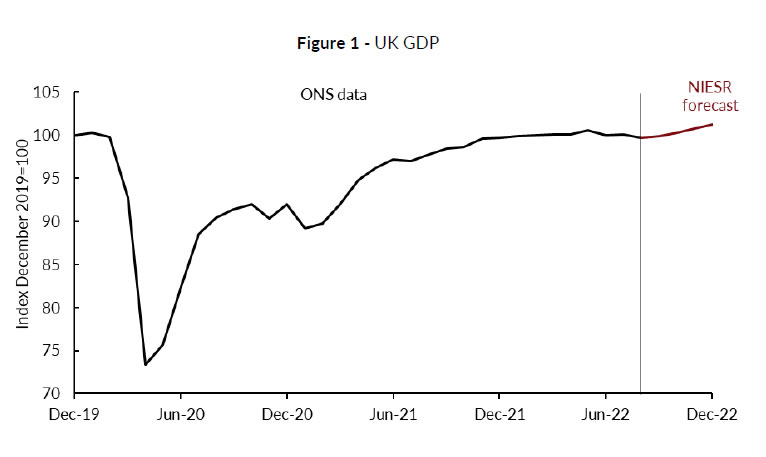
NIESR said the -0.3% contraction in UK GDP in August "possibly signalling the beginning of an economic recession". Given that September PMI pointed to further decrease in the manufacturing sector, it's likely to continue to drag on the economy in Q3.
However, it expects "the energy price guarantees for households and firms announced in September's fiscal event to drive GDP growth higher in the fourth quarter. The extent to which the measures in the mini-budget will counter the dampening effects of plummeting confidence and increased interest rates will become clearer over the coming months."
US PPI up 0.4% mom, 8.5% yoy in Sep
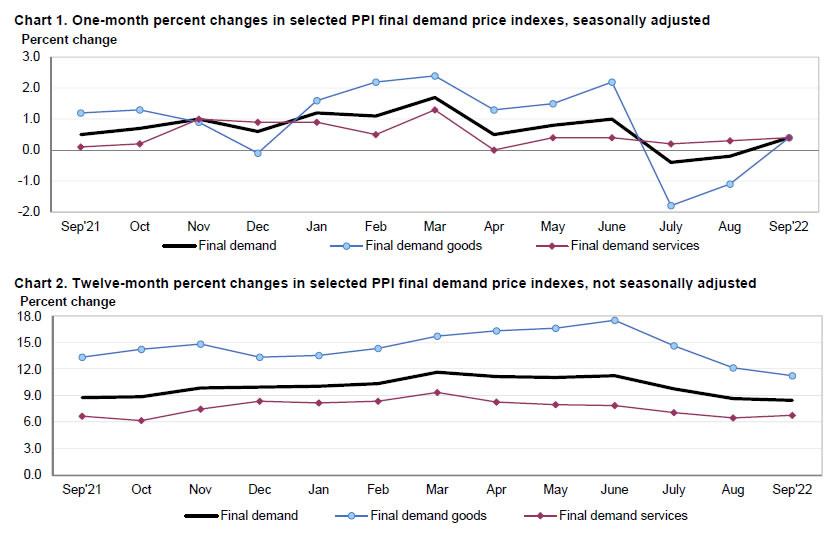
US PPI for final demand rose 0.4% mom in September, above expectation of 0.2% mom. Two-thirds can be traced to a 0.4% mom prices for services. The index for goods rose 0.4%. Prices less food, energy, and trade services rose 0.4% mom.
For the 12 months ended in the period, PPI slowed from 8.7% yoy to 8.5% yoy. PPI ex food, energy and trade was unchanged at 5.6% yoy.
Bank of England’s Bipolar Policy
The Bank of England’s frenzy of emergency bond market support is rocking the currency market boat, leaving GBPUSD as one of the protagonists on FX.
The Bank of England extended emergency support to the debt market yesterday to include inflation-linked bonds in its buying list, triggering GBPUSD to rise from 1.10 to 1.1180 intraday. But in the evening, Governor Bailey reminded that the emergency measure remains temporary, and these extended purchases will end on October 14 as planned.
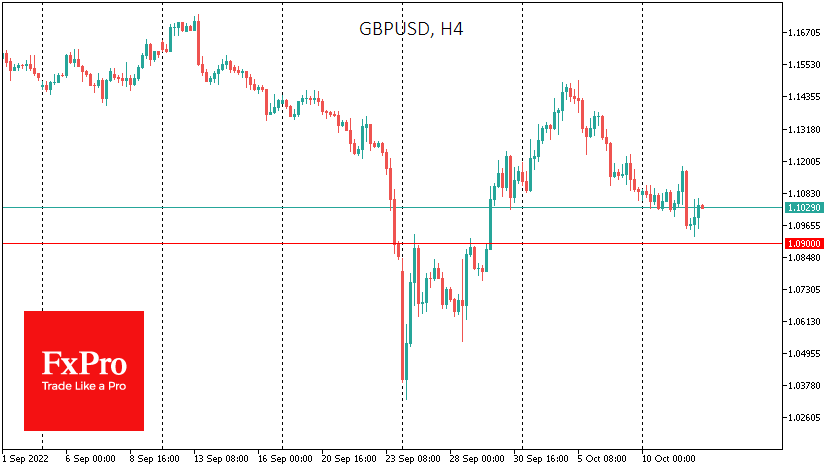
These statements triggered mini chaos in the debt market and took more than 2.3% off the pound from its peak to bottom on Wednesday morning at 1.0923. This bipolar policy is perplexing, although it makes a certain sense.
The Bank of England insists on leaving emergency market support temporary, while the market wants an extension of the support programmes, although it makes little use of it. The Bank of England issued bids for £40bn over the two weeks of the program but bought £5bn.
Distressed pension funds are in no hurry to sell bonds, simply hoping that the very presence of a “buyer of last resort” will drive up prices — a habit developed in the markets over the past decades.
Remarkably, the FX market is greeted by news of an extension of the QE programme or a “flexible approach” to bond purchases with GBP buying. Conventional logic suggests that buying assets on the balance sheet is a net issue for the pound, increasing its supply, which is harmful to the exchange rate. But now bond purchases are lowering the heat on the UK debt market, bringing buyers back into the pound.
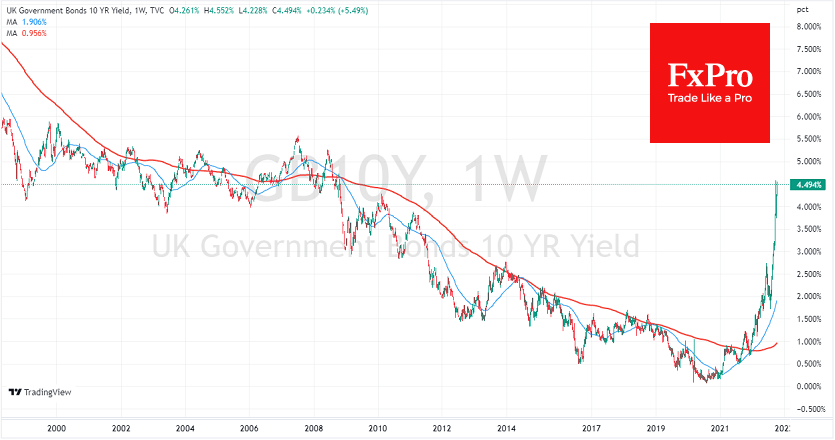
Locally GBPUSD is gaining support on declines in the 1.0900 area, reassuring that the exchange rate has already passed its low point in September. It is worth being prepared for the Bank of England to accelerate short-term interest rate hikes to support the attractiveness of the short-term debt market. But in the meantime, periodic interventions at the far end of the curve are not ruled out.
Overall, this is a positive strategy for the pound, although frequent shifts between support and constraint regimes create volatility in the pound and increase risk premiums in the markets.
USD/JPY Rises to New Multi-Year High, Eyes 1998 Peak
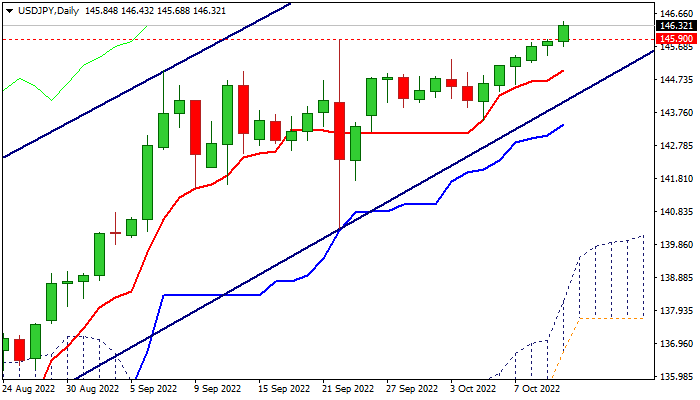
Fresh bullish acceleration broke above previous 24-year peak at 145.90, pushing the price to new multi-year highs in European trading on Wednesday.
Bullish continuation after a limited pullback, sparked by Japan’s intervention in September, confirms an end of larger consolidation, also showing that the downside remains well protected, as post-intervention dip was contained above psychological 140 support.
Overbought conditions on daily chart so far do not impact bulls, but some price adjustments could be expected in coming sessions, before final push towards target at 147.68 (1998 high).
Bulls look for confirmation daily close above broken top at 145.90, which will revert to initial support, with former tops at 145.00 zone, reinforced by rising daily Tenkan-sen, marking a solid support which should contain dips and guard lower pivot at 144.40 (the lower boundary of a bull-channel, a trendline drawn off 130.39, Aug 2 higher low).
Res: 147.05; 147.21; 147.68; 148.01.
Sup: 145.90; 145.30; 145.00; 144.40.
GBP/USD Pair is Now Consolidating Losses from 1.0940
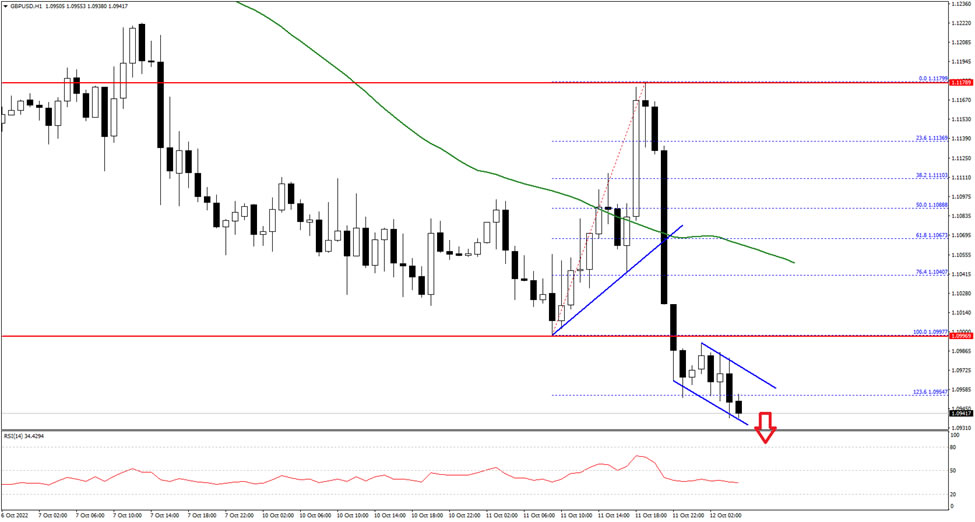
The British Pound started a fresh decline from the 1.1180 resistance zone against the US Dollar. The GBP/USD pair declined below the 1.1050 support to move into a bearish zone.
There was a close below the 1.1100 level and the 50 hourly simple moving average. It even spiked below the 1.0960 support level. The pair is now consolidating losses, with an immediate support near the 1.0940 level.
The first major support is near 1.0920 on FXOpen. The main support is forming near the 1.0880 level. A break below the 1.0880 support could even push the pair below the 1.0850 support.
On the upside, the first major resistance sits near the 1.1100 zone. If there is a clear upside break above the 1.1100 resistance, the pair could rise steadily towards the 1.1150 level in the near term.
Eurozone industrial production up 1.5% mom in Aug, EU up 1.1% mom
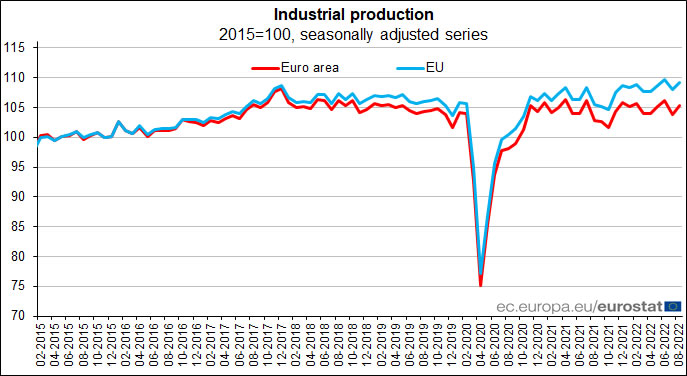
Eurozone industrial production rose 1.5% mom in August, above expectation of 0.5% mom. Production of capital goods rose by 2.8% mom, durable consumer goods by 0.9% mom and non-durable consumer goods by 0.7% mom, while production of intermediate goods fell by -0.5% mom and energy by 2.1% mom.
EU industrial production rose 1.1% mom. Among Member States for which data are available, the highest monthly increases were registered in Ireland (+16.6%), Estonia (+5.0%) and Denmark (+4.3%). The largest decreases were observed in Sweden (-7.0%), Belgium (-6.1%) and the Netherlands (-1.5%).
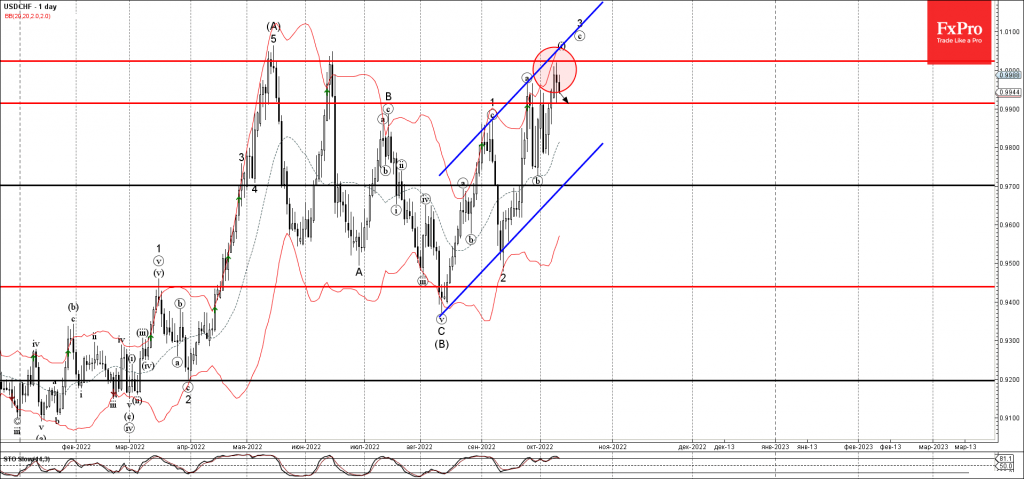
USDCHF Wave Analysis
- USDCHF reversed from resistance zone
- Likely to fall to support level 0.9915
USDCHF recently reversed down from the resistance zone lying between the key resistance level 1.0025
(which has been reversing the pair from May), upper daily Bollinger Band and the resistance trendline of the daily up channel from April.
The downward reversal from this resistance zone stopped the earlier short-term impulse wave (i).
Given the overbought daily Stochastic, USDCHF can be expected to fall further toward the next support level 0.9915.
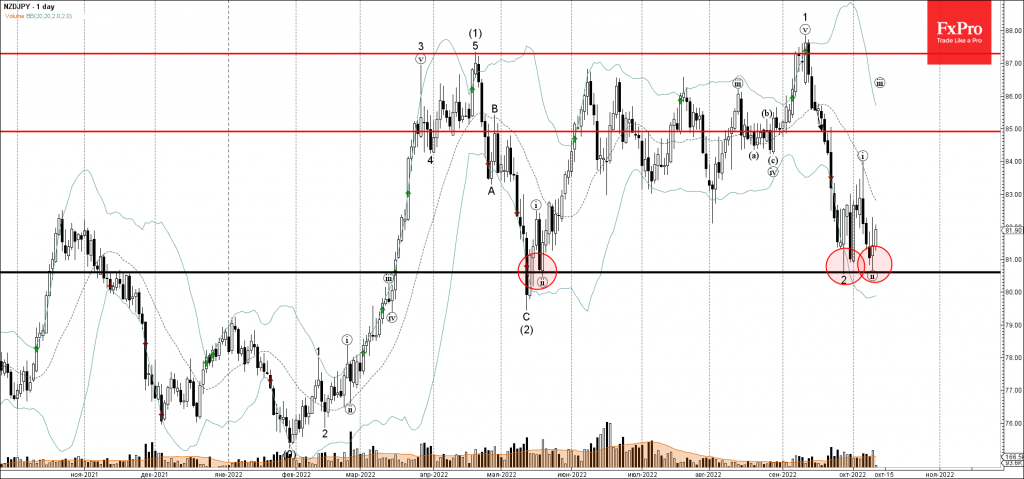
NZDJPY Wave Analysis
- NZDJPY reversed from support zone
- Likely to rise to resistance level 82.30
NZDJPY recently reversed up from the support zone lying between the key support level 80.60 (which has been reversing the pair from May) and the lower daily Bollinger Band.
The upward reversal from this support zone stopped the earlier short-term corrective wave (ii).
NZDJPY can be expected to rise further toward the next resistance level 82.30 (previous daily high).
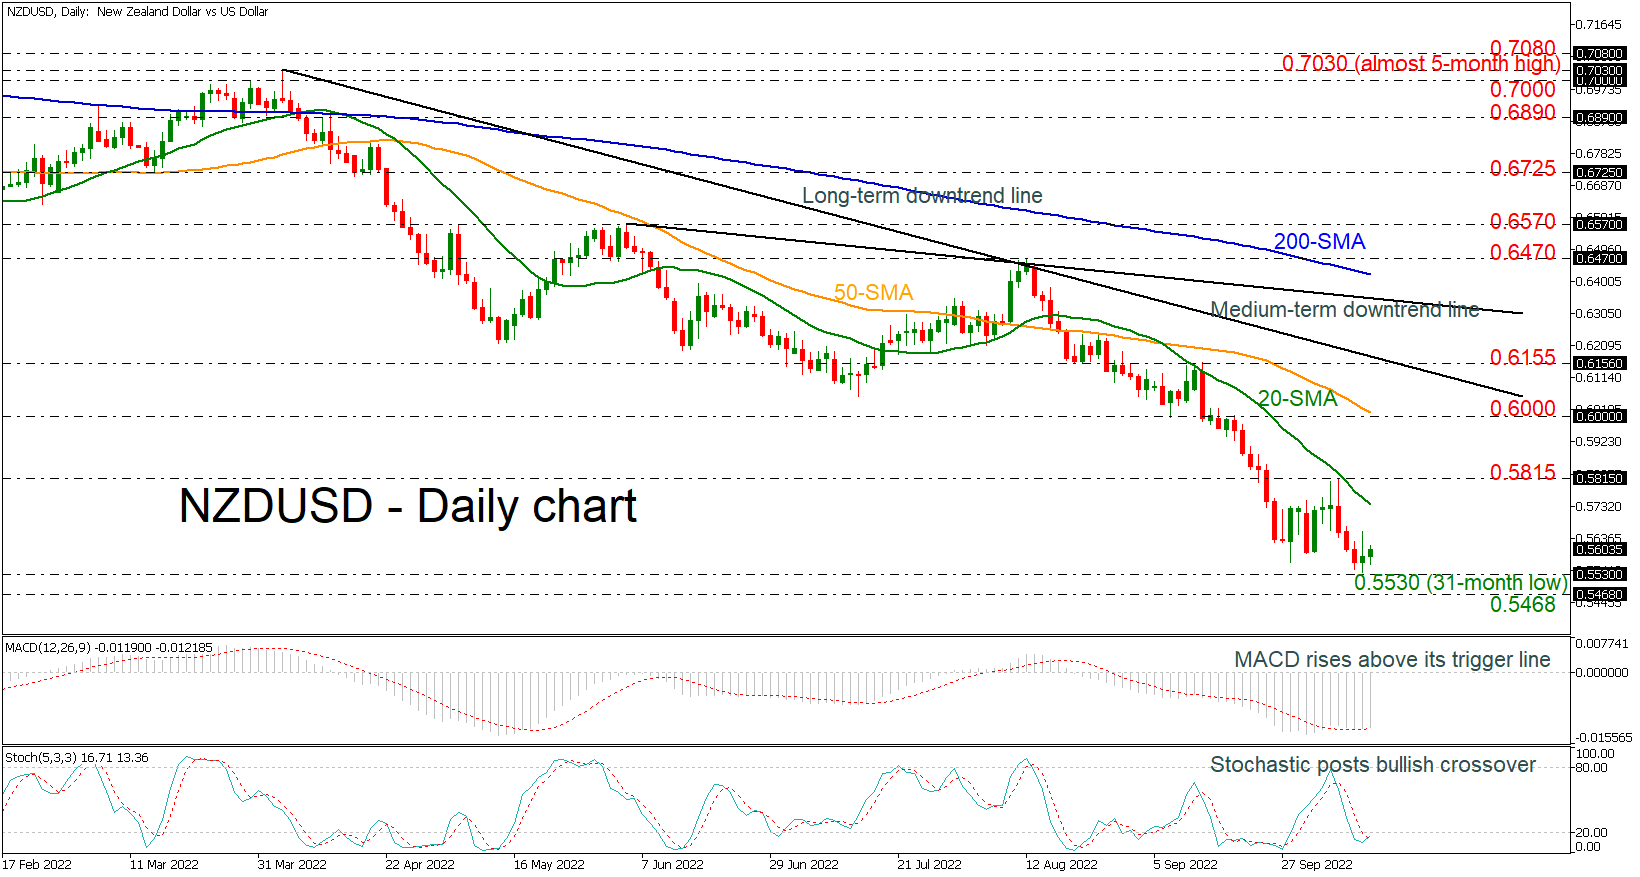
NZDUSD Rises after Hitting New 31-Month Low
NZDUSD is posting some gains after the selling interest towards the 31-month trough of 0.5530. The technical oscillators are suggesting positive movements in the short-term, as the MACD moved above its trigger line, while the stochastic posted a bullish crossover within the %K and %D lines in the oversold zone. The short-term simple moving averages are heading south following the downside movement.
More upside pressures could drive the market until the immediate resistance of the 20-day SMA at 0.5740 before meeting the 0.5815 barrier. Moving higher, the 50-day SMA near the 0.6000 psychological level ahead of the medium-term downtrend line near 0.6220, could be important levels.
Alternatively, a dive below the 31-month low of 0.5530 would send the pair until the next support at 0.5468. Steeper losses could open the door for the March 2009 bottom at 0.4880.
Summarizing, NZDUSD has been developing in a descending movement in the medium- and long-term timeframes; however, in the very short-term, the pair is showing some positive sings.
USDJPY Storms to Fresh 24-Year Highs, Flirts with Intervention
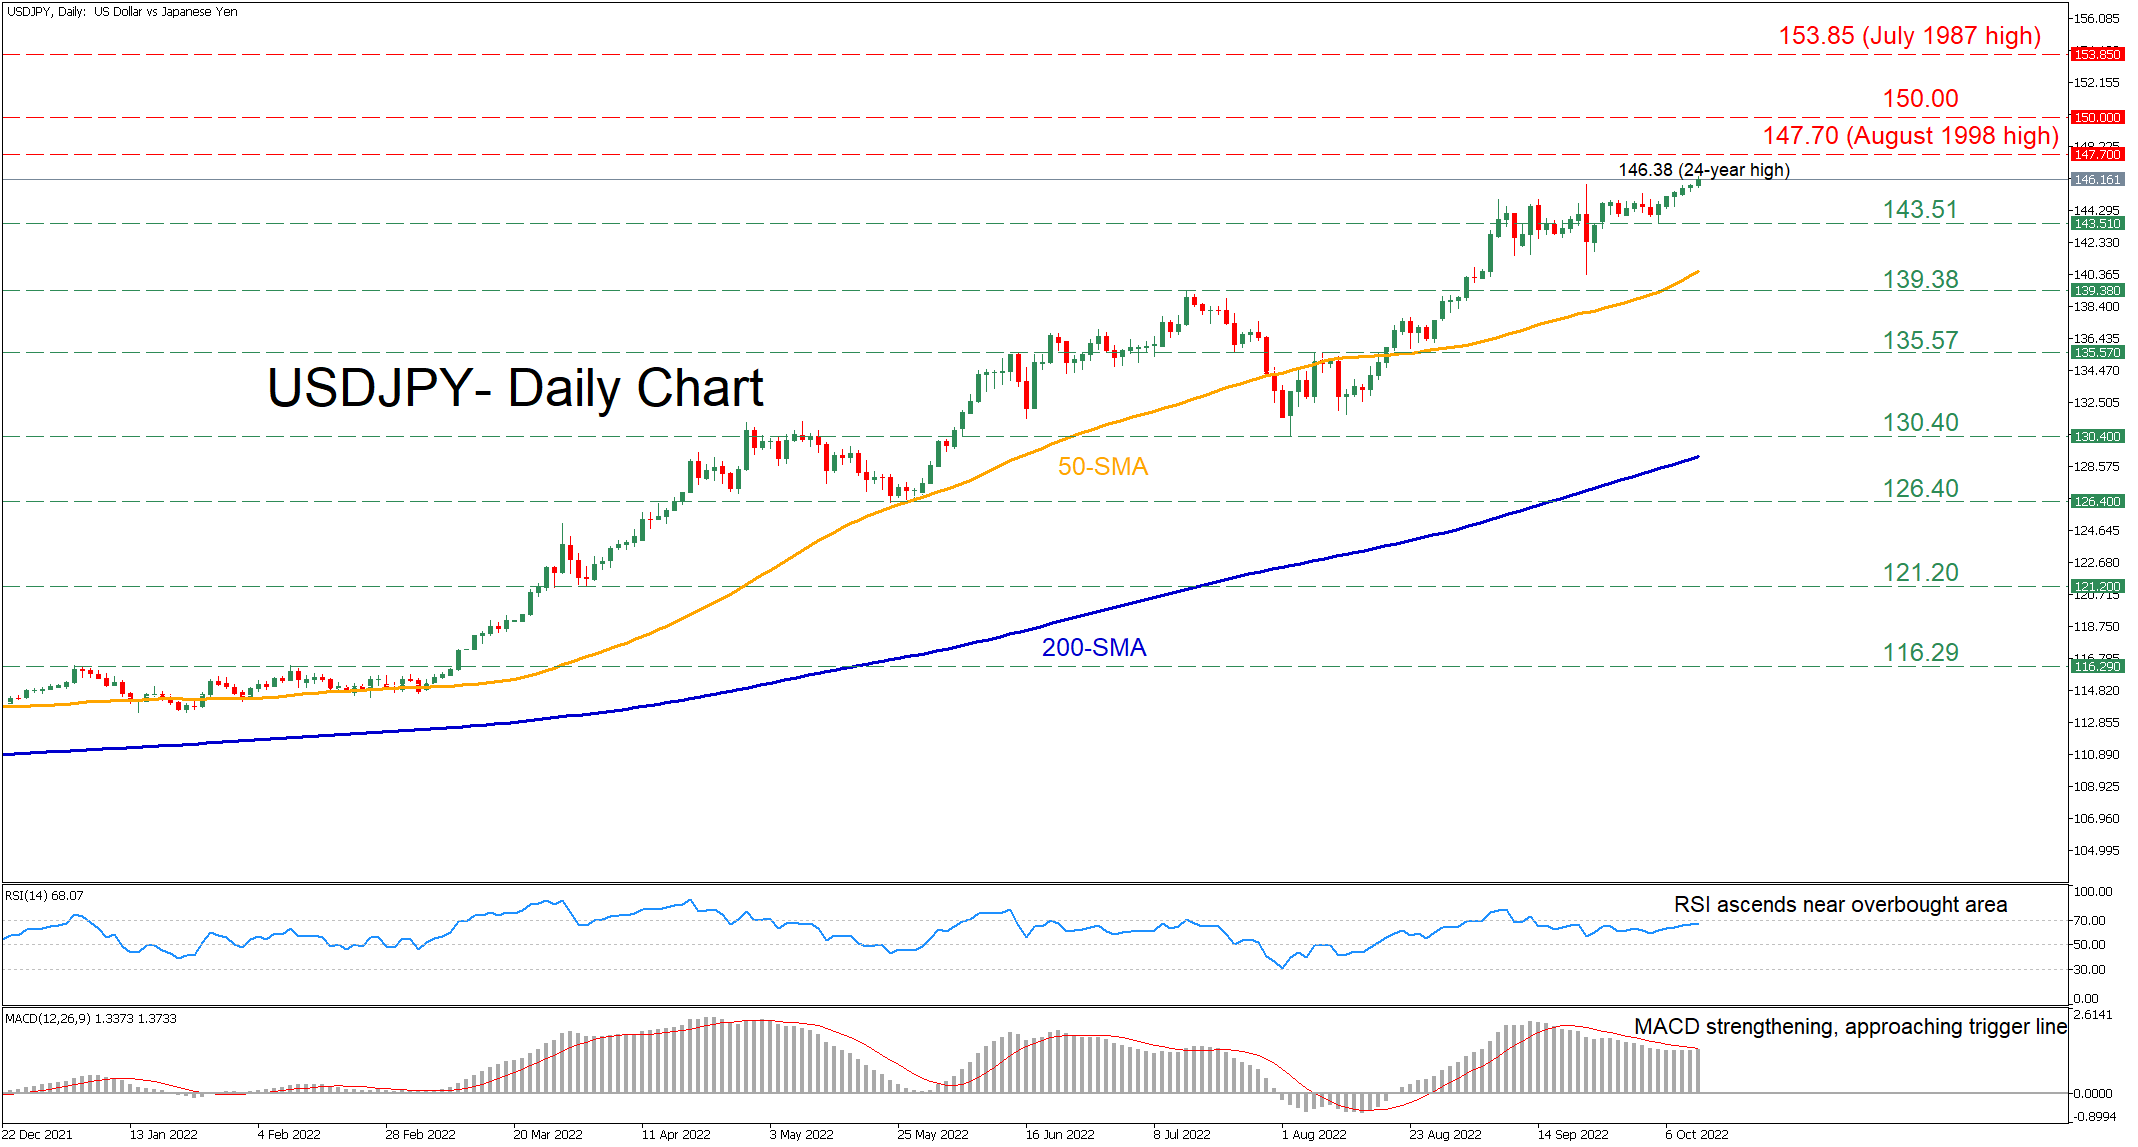
USDJPY has been in a prolonged uptrend since early March, crossing above its historical resistance levels and generating consecutive multi-year highs. Moreover, despite the recent consolidation, the positive tone appears to be strengthening in the near term as the pair has edged higher today to a fresh 24-year high of 146.38.
The short-term oscillators currently indicate that bullish forces are intensifying. Specifically, the RSI is sloping upwards towards its 70-oversold area, while the MACD histogram is strengthening in the positive region, approaching its red signal line.
Should buying pressures persist, the pair could move higher to form fresh multi-year highs, where the August 1998 resistance of 147.70 might curb further advances. Conquering this barricade, the bulls may target the 150.00 psychological mark. Even higher, the July 1987 peak of 153.85 could prove to be a tough barrier for the price to overcome.
On the flipside, a negative correction could initially come to a halt at the recent support region of 143.51. Should that floor collapse, the price could descend towards the 139.98 resistance territory, which might now act as support. A break below the latter could turn the spotlight to 135.57 before the August low of 130.40 appears on the radar.
Overall, USDJPY seems to have the necessary momentum to push higher and challenge its historical highs. Nevertheless, the bulls should not rule out the possibility of some retracement before the latter is accomplished as an intervention by the BoJ remains on the cards.