Sample Category Title
Bitcoin risks deeper fall toward 70k if NASDAQ selloff intensifies
Cryptocurrencies are under renewed pressure alongside technology stocks as risk aversion intensified on fresh fears of a transatlantic trade war linked to the Greenland dispute. The macro backdrop is deteriorating quickly. Renewed tariff threats between the U.S. and Europe have revived concerns over growth, policy uncertainty, and capital flows.
From a market structure perspective, the current selloff suggests that Bitcoin’s corrective recovery since last November may already be complete. Price action has turned decisively lower, raising the risk that the broader downtrend resumes if risk sentiment continues to worsen. A key near-term catalyst will be the NASDAQ’s reaction to support around 23,000 at today’s open. A clean break below that zone would likely accelerate equity downside, and history suggests crypto would not be spared in such a move.
Technically, Bitcoin’s rebound from 80,492 appears to have topped at 97,922, following rejection by 38.2% retracement of 126,289 to 80,492 at 97,986, as well as 55 W EMA. Firm break below 86,405 support would strengthen the case that fall from 126,289 is resuming, opening the door to a full retest of 80,492 low.
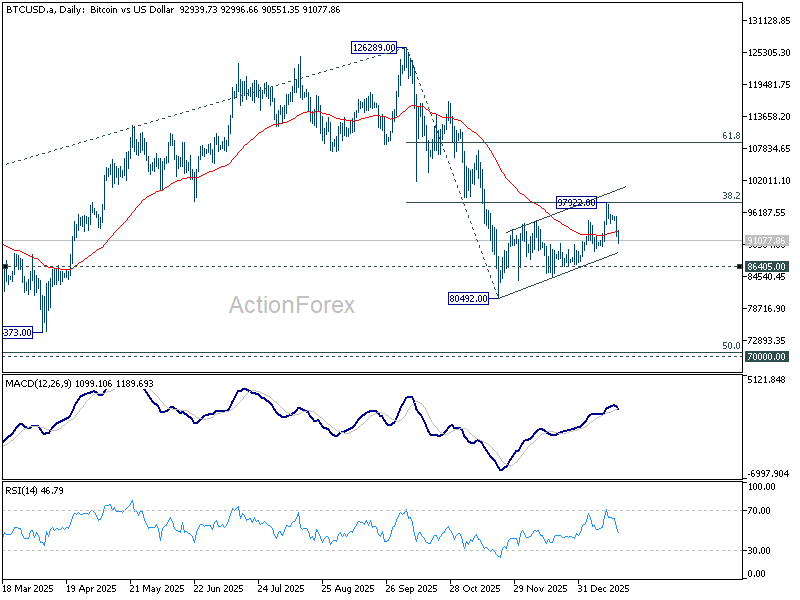
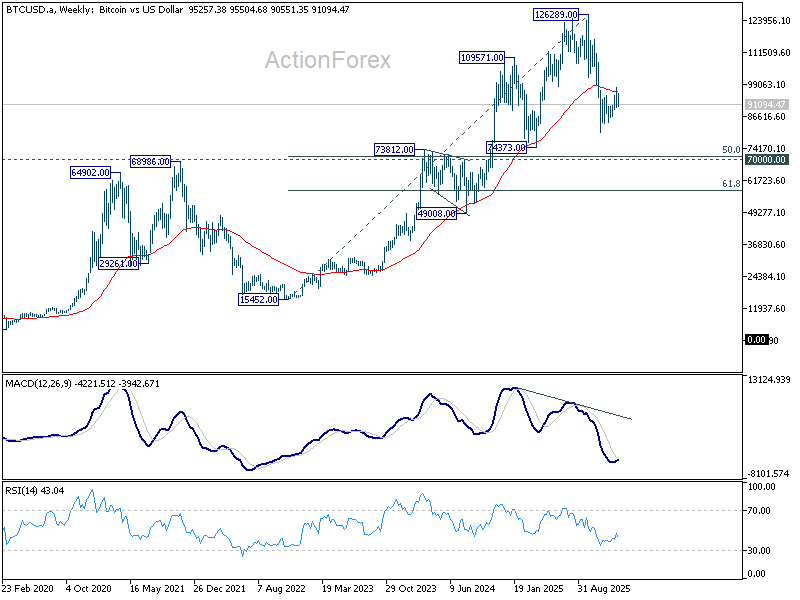
Failure at 80, 492 would shift focus to a deeper medium-term correction. On that view, the next major downside objective sits near 70,000 psychological level, close to 50% retracement of the long-term rise from 2022 low at 15,452 to 2025 high at 126,289, located at 70,870.
NASDAQ’s rebound from 21,898.28 appears corrective, representing the second leg of the corrective pattern that began from 24,020 peak. Decisive break of 23,110.20 support would signal the start of the third leg lower. In that scenario, downside would likely extend back toward 21,898.28, and possibly further to 38.2% retracement 14,784.03 (2025 low) to 24,020.00 (2025 high) at 20,491.85.
Such a move in NASDAQ would almost certainly intensify pressure on crypto markets. Historically, extended drawdowns in tech equities have produced non-linear declines in cryptocurrencies, as leverage unwinds and liquidity thins rapidly.
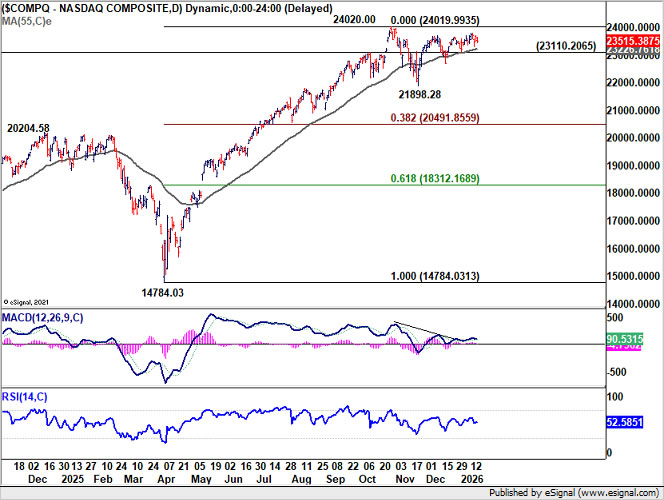
Chart alert: AUD/USD Bullish Breakout Above 0.6720 as “Sell America” Intensifies
Key takeaways
- US dollar under pressure as “sell America” narrative builds: Escalating US foreign policy tensions with NATO/EU allies over Greenland have driven a second straight session of USD weakness, with AUD and NZD outperforming most majors.
- AUD/USD breaks higher with bullish momentum: The pair has cleared the 0.6720–0.6730 resistance zone, resuming its bullish impulsive move within a broader medium-term uptrend, with 0.6760 as the next upside trigger.
- Technical and macro signals reinforce the bullish bias: A bullish engulfing pattern, supportive momentum indicators, and a widening Australia–US 2-year yield spread all argue for further AUD/USD upside unless 0.6690 support fails.
The US dollar has dropped for the second consecutive session after the latest US hostile foreign policy towards its long-time allies, where US President Trump threatened the eight NATO/EU members, which include Germany, France, and the UK, that objected to the US’s strong push to purchase Greenland, a resource-rich Arctic territory under Denmark’s autonomous control.
The US dollar fared the worst against the NZD (-0.5%) and the AUD (-0.3%) among major currencies on a 1-day rolling basis, but managed to buck the trend against the Japanese yen, where the greenback recorded an intraday gain of 0.2% due to the upcoming snap election in Japan on February 8 that may prevent the Bank of Japan (BoJ) issue a hawkish monetary policy guidance on its rate setting meeting this Friday, January 23 (see Fig. 1).
US dollar performance against major currencies
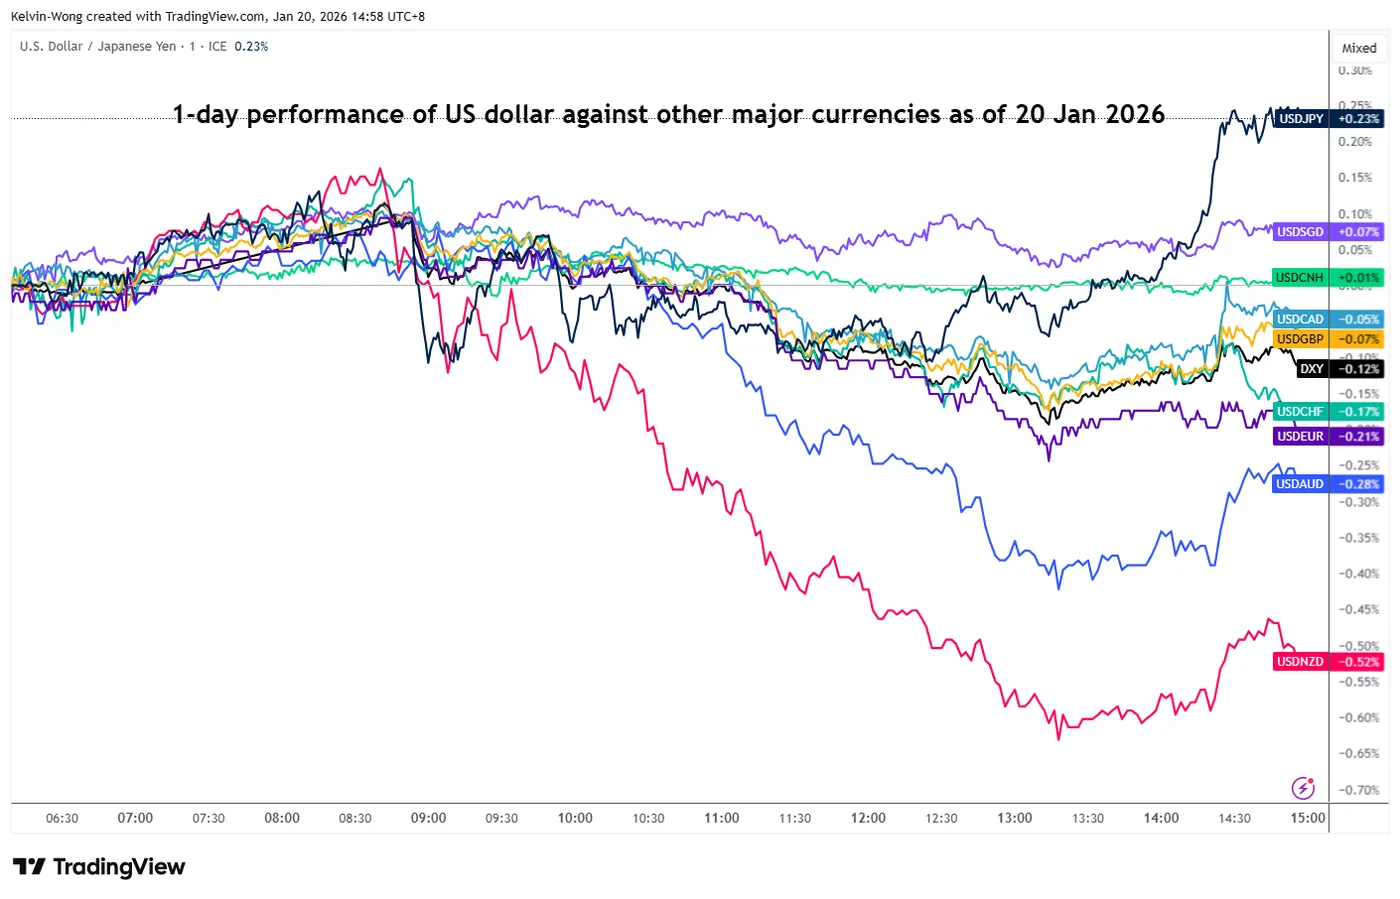
Fig. 1: 1-day rolling performance of the US dollar against major currencies as of 20 Jan 2026 (Source: TradingView)
Let us now focus on the short-term (1 to 3 days) technical trend and key levels to watch on the AUD/USD
AUD/USD: Bullish impulsive sequence resumes within medium-term uptrend
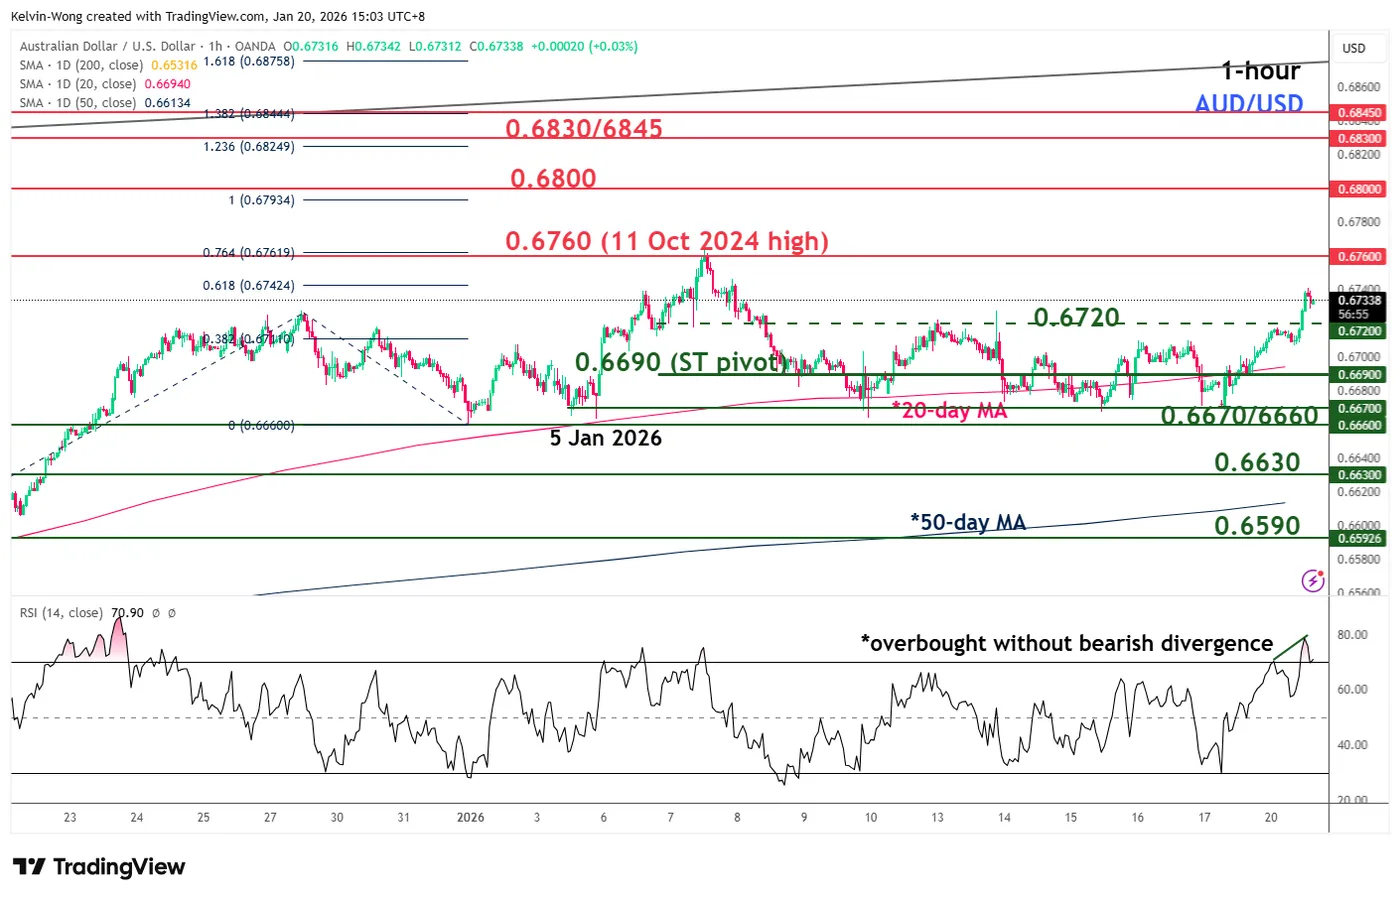
Fig. 2: AUD/USD minor trend as of 20 Jan 2026 (Source: TradingView)
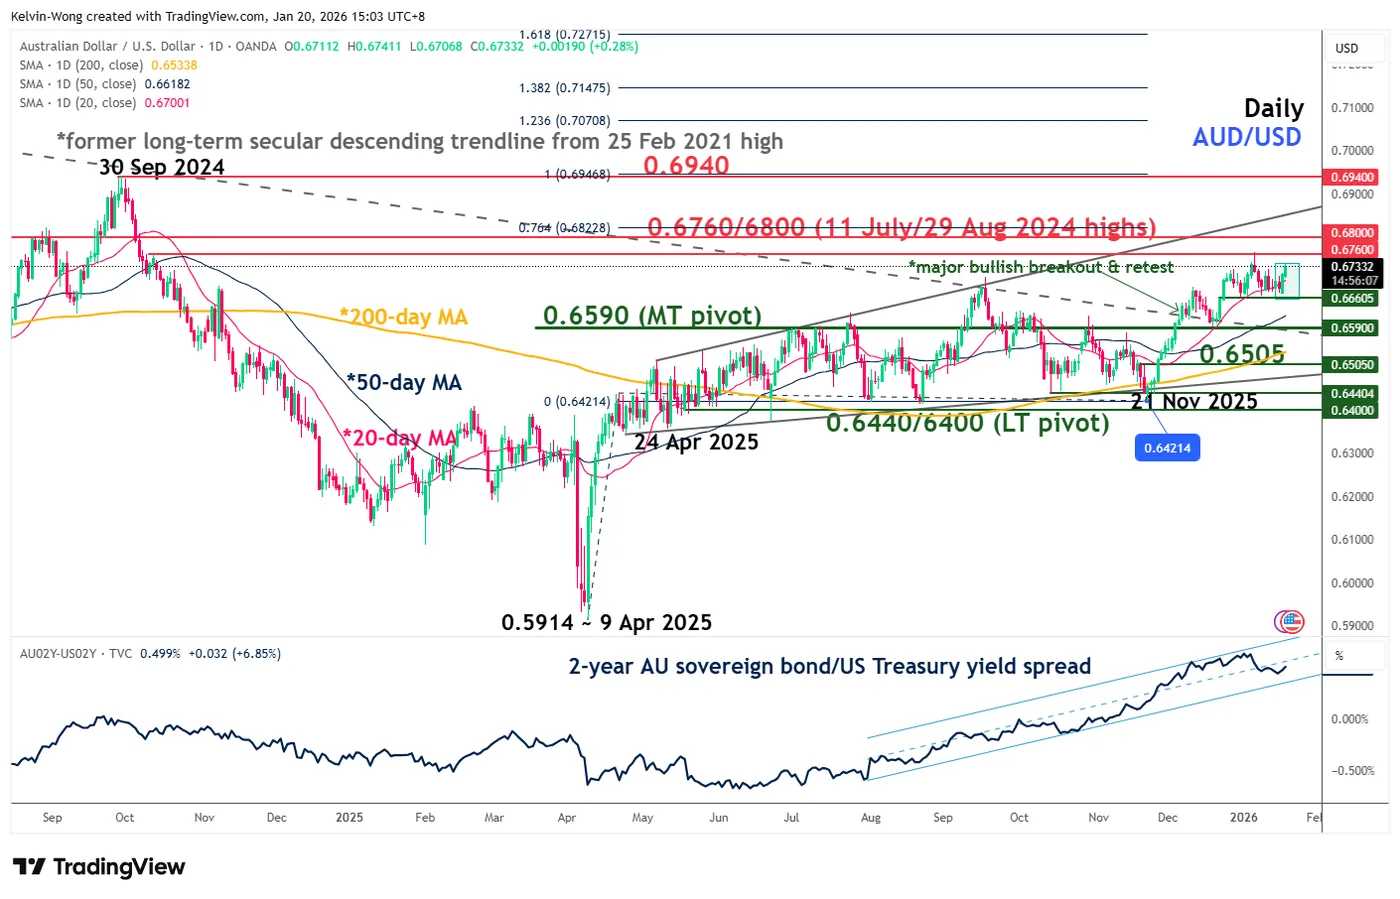
Fig. 3: AUD/USD medium-term trend as of 20 Jan 2026 (Source: TradingView)
Watch the 0.6690 short-term pivotal support (also the 20-day moving average). A clearance above 0.6760 is likely to see the next intermediate resistances come in at 0.6800 and 0.6830/6845 (see Fig. 2).
However, a break with an hourly close below 0.6690 invalidates the bullish breakout for another round of choppy minor corrective decline to retest the 0.6670/6600 minor range support. Failure to hold at 0.6660 may extend the decline to expose the next intermediate supports at 0.6630 and 0.6590 (also the close to the 50-day moving average).
Key elements to support the bullish bias on AUD/USD
- Today’s bullish breakout above 0.6720 has come after the formation of Monday, January 20’s daily “Bullish Engulfing” candlestick after a retest on the 20-day moving average (see Fig. 3).
- The hourly RSI momentum indicator has reached the overbought region, but without any bearish divergence condition.
- The monetary policy-sensitive yield spread of the 2-year Australian sovereign bond over the 2-year US Treasury note has rebounded to 0.50% from 0.43% printed on last Friday, January 16. The widening of the yield spread premium supports a further potential up move on the AUD/USD.
Price of Gold Rises Above $4,700 for the First Time
At the market open on Monday, 19 January, gold quotes (XAU/USD) formed a bullish gap and moved above the psychological level of $4,660, setting a new all-time high.
Today, 20 January, the market continues to show extremely bullish sentiment — for the first time ever, the price of gold has climbed to $4,720.
Why Is Gold Rising?
The main bullish driver is geopolitical tension. Following events in Venezuela, attention has shifted to the United States’ desire to acquire Greenland (through purchase or other means).
According to media reports:
→ Trump has threatened to impose tariffs on eight European countries that oppose his ambitions regarding Greenland. This further intensifies fears of a potential trade war between the US and Europe.
→ French President Emmanuel Macron has declined an invitation to join the Trump-proposed Gaza Peace Council and is also demonstrating opposition to Trump’s intentions concerning Greenland. In turn, German Chancellor Friedrich Merz stated that he is trying to persuade Macron to soften his response.
Technical Analysis of the XAU/USD Chart
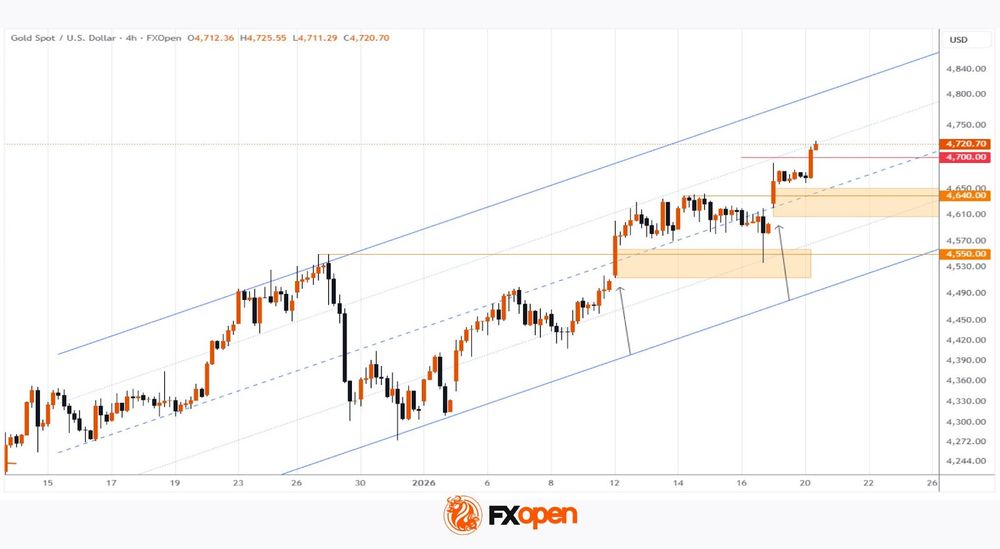
Eight days ago, on 12 January, when analysing the gold chart, we:
→ constructed an ascending channel;
→ highlighted signs of market overbought conditions;
→ suggested that if a corrective scenario were to unfold, it would be unlikely to be deep.
Indeed, this scenario played out. On Friday, 16 January, the market pulled back to the $4,550 level, but judging by the long lower wick, bulls aggressively regained control around the body of the candle that formed at the opening of last week.
At the same time, as indicated by the arrows, we can observe similarities in the nature of the market open this week and last week: bullish gaps on wide candles breaking through previous resistance levels.
It cannot be ruled out that history may repeat itself — any pullback attempts (if they occur) may again prove unsuccessful, while the boundaries of the ascending channel continue to define the market’s trajectory.
Be prepared for volatility spikes as the traditional Davos Forum approaches (19–23 January), where a meeting between Trump and European leaders is expected.
Start trading commodity CFDs with tight spreads (additional fees may apply). Open your trading account now or learn more about trading commodity CFDs with FXOpen.
This article represents the opinion of the Companies operating under the FXOpen brand only. It is not to be construed as an offer, solicitation, or recommendation with respect to products and services provided by the Companies operating under the FXOpen brand, nor is it to be considered financial advice.
Violent Sell-off at the Long End of JGB Curve
Markets
Greenland and all of its geopolitical consequences were top of mind yesterday. Trump slapped EU/NATO allies with an additional 10% import levy, to be raised to 25% in June, until a deal/sale of the much-wanted island is reached. The blatantly coercive move prompted a backlash from European officials which now threaten to halt the approval of the US/EU trade deal, discuss tariffing some €93bn of US goods and mull to deploy the anti-coercion instrument. The latter is the nuclear option and is only to be used as a last resort, only when the diplomatic route (Davos talks!) has been exhausted. US President Trump this morning said that he will meet with several parties during the upcoming World Economic Forum, hailing that he had a very good phone call with NATO secretary general Rutte.
While the Greenland crisis will continue to play this week, it’s something else that catches most attention this morning: a violent sell-off at the long end of the JGB curve. The Japanese 30-yr yield adds 24 bps. The Japanese 40-yr yield rises by a similar amount, breaching 4% in the process (4.21%). The Japanese long end is suffering ever since PM Takaichi won LDP leadership elections end last year. The move accelerated on rumours about snap elections to cement her position (regaining absolute majority in lower house) and push through a stimulative fiscal agenda. An election date has been set for February 8. This week, a proposal to suspend the sales tax on food (8%) for two years sent long term JGB’s into tailspin. Weak demand at this morning’s 20-yr bond sale added fuel to the fire. There are spill-over effects to other bond markets. Both German and UK yield curves steepened yesterday with the long end adding around 3 bps. US markets reopen after the long weekend (Martin Luther King Day) with the US 10-yr and 30-yr yields immediately 4.4 bps and 6.3 bps. The US 10-yr yield confirms last Friday’s technical break above important resistance at 4.2%. The US 30-yr yield (4.9%) rises to its highest level since early September with the psychologic 5% mark rapidly coming on the radar. Apart from the Japanese sell-off, the Greenland crisis also brings back echoes to the Q2 sell America trade. EUR/USD gradually creeps higher, from a 1.16 close last Friday to currently 1.1670. France adopting a budget (see below) is slightly supportive for the euro-side of the equation.
UK labour market data kicked off this week’s busy calendar this morning. The unemployment rate stabilized as expected at 5.1%. Employment change in the three months to November rose by a stronger than expected 82k (3M/3M), but monthly payrolls for December (-43k) disappointed. Overall, the employment data printed near consensus, leaving no traces on UK markets. EUR/GBP is marginally higher this morning, shadowing the EUR/USD move. There are no other meaningful data releases today. We especially eye the fate of the long end of the UK/German/US yield curve to shape overall market moves.
News and views
Boris Vujcic, the head of the central bank of Croatia, secured the backing from EMU Finance Ministers to become next ECB vice president. In this role he will replace Luis de Guindos from June 1st. It is the first time that a member from a former Eastern European country will obtain a seat in the six-member executive Board of the ECB. The appointment still has to be formally approved by the leaders of the European Union but they are expected to join the assessment of the Finance Ministers. Boris Vujcic is seen as one of the more hawkish members within the spectrum of ECB policy makers. Within the board, the positions of president, chief economist and head of market operations will also become vacant next year
French Prime Minister Lecornu invoked Article 49.3 of the constitution to adopt the 2026 budget without a vote in parliament. The government is now expected to face a no confidence vote on the use of the Article 49.3. The Socialist Party, which holds a small, but decisive, number of votes, is expected to abstain after getting more concessions on spending and taxes. That way, the absolute majority needed to topple the government is very unlikely to be reached. The government aims to cut the deficit from 5.4% of GDP last year to about 5% of GDP this year.
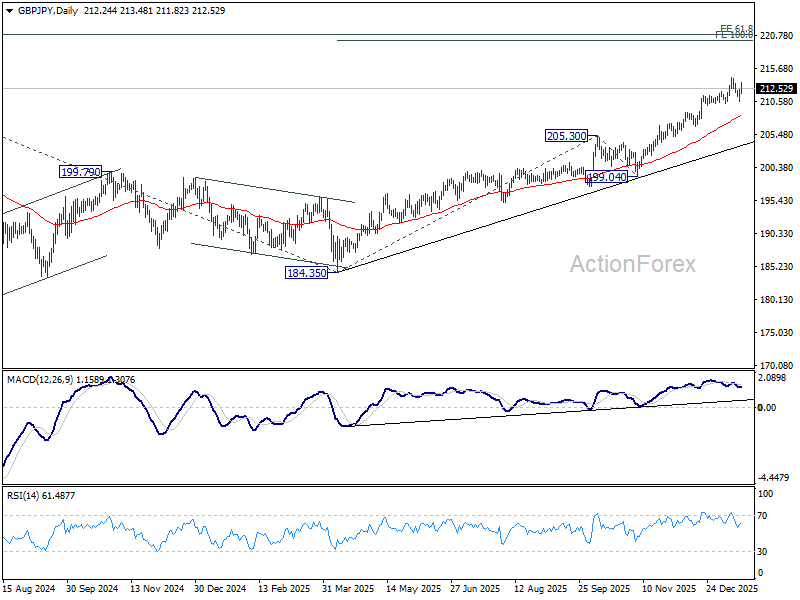
GBP/JPY Daily Outlook
Daily Pivots: (S1) 211.19; (P) 211.80; (R1) 212.90; More...
GBP/JPY is staying in range below 214.27 despite today's strong rebound, and intraday bias remains neutral. Further rise is still expected with 210.28 intact. Break of 214.27 will resume larger up trend to 100% projection of 184.35 to 205.30 from 199.04 at 219.99 next. Nevertheless, considering bearish divergence condition in 4H MACD, firm break of 210.28 will confirm short term topping, and turn bias to the downside for deeper pullback to 55 D EMA (now at 208.24).
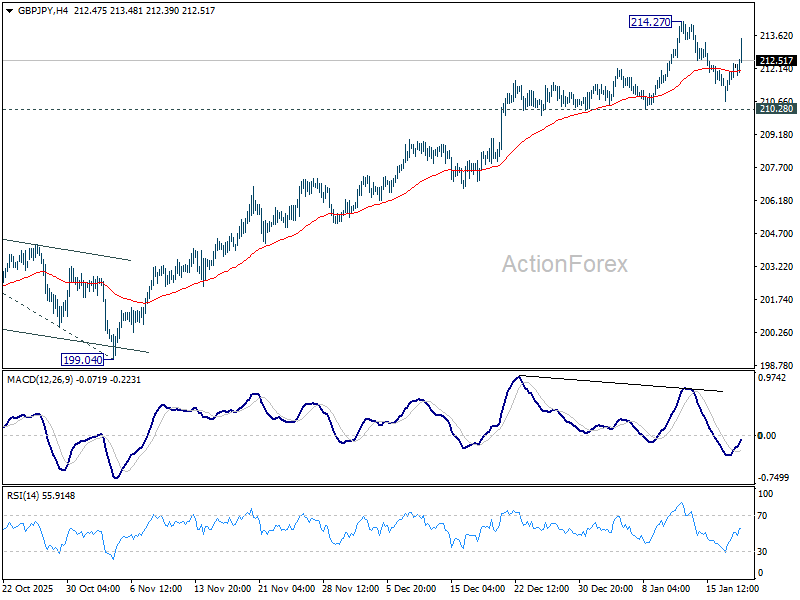
In the bigger picture, up trend from 123.94 (2020 low) is in progress. Next target is 61.8% projection of 148.93 (2022 low) to 208.09 (2024 high) from 184.35 at 220.90. On the downside, break of 205.30 resistance turned support is needed to indicate medium term topping. Otherwise, outlook will stay bullish even in case of deep pullback.
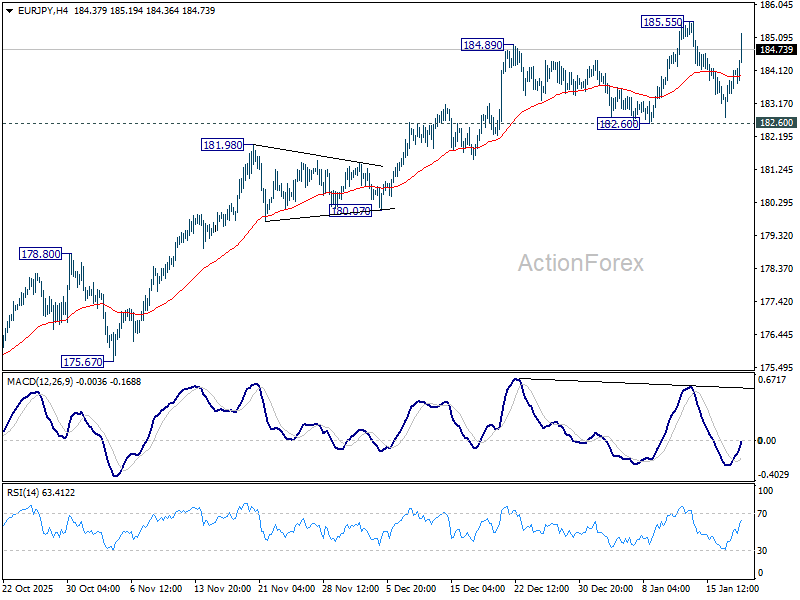
EUR/JPY Daily Outlook
Daily Pivots: (S1) 183.23; (P) 183.70; (R1) 184.64; More...
EUR/JPY rebounded strongly today but stays in range below 185.55. Intraday bias remains neutral first. Another rise is in favor as long as 182.60 support holds. Above 185.55 will target 186.31 projection level. However, considering bearish divergence condition in 4H MACD, firm break of 182.60 will confirm short term topping, and turn bias back to the downside for 55 D EMA (now at 181.69) and below.
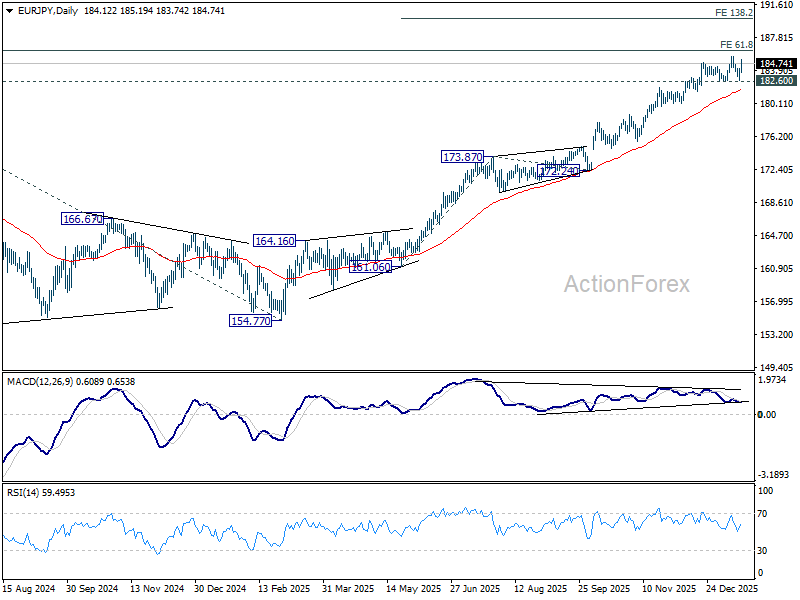
In the bigger picture, up trend from 114.42 (2020 low) is in progress and should target 61.8% projection of 124.37 to 175.41 from 154.77 at 186.31. Considering bearish divergence condition in D MACD, upside could be capped by 186.31 on first attempt. Still, outlook will stay bullish as long as 55 W EMA (now at 172.58) holds, even in case of deep pullback. Sustained break of 186.31 will pave the way to 78.6% projection at 194.88 next.
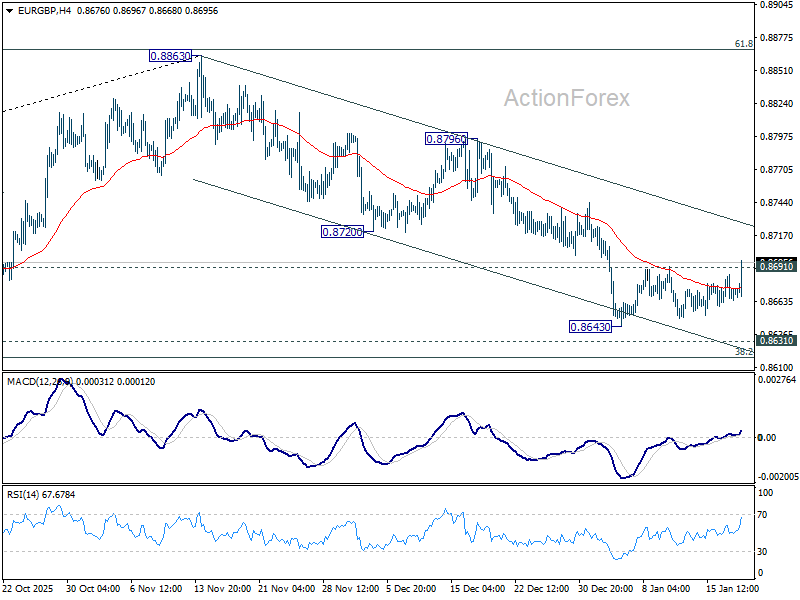
EUR/GBP Daily Outlook
Daily Pivots: (S1) 0.8665; (P) 0.8676; (R1) 0.8685; More…
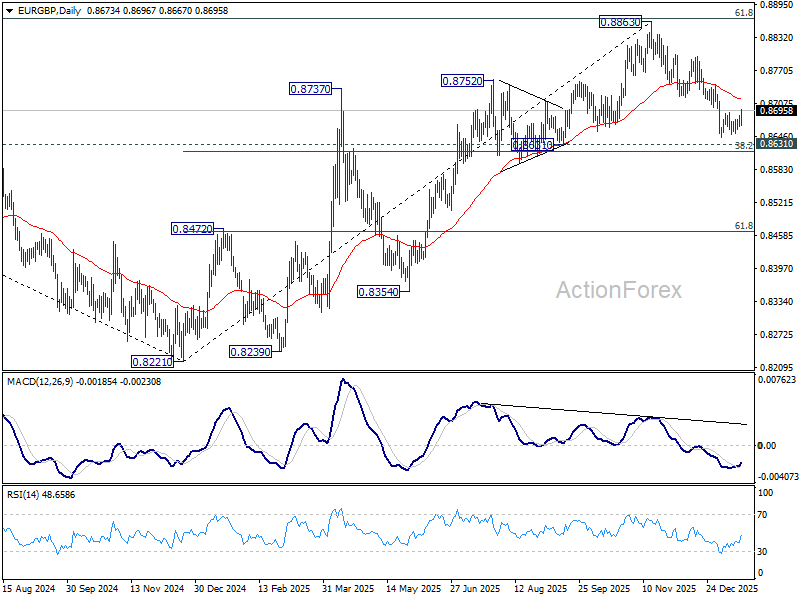
EUR/GBP's break of 0.8691 resistance suggests short term bottoming at 0.8643. Intraday bias is back on the upside for 55 D EMA (now at 0.8716) first. Sustained break there will argue that whole fall from 0.8863 has already completed. On the downside, though, break of 0.8643 will resume the decline to 0.8631 cluster support (38.2% retracement of 0.8221 to 0.8663 at 0.8618).
In the bigger picture, rise from 0.8221 medium term bottom (2024 low) is seen as a corrective move. Upside should be limited by 61.8% retracement of 0.9267 to 0.8221 at 0.8867. Sustained trading below 55 W EMA (now at 0.8623) should confirm that this corrective bounce has completed. In this case, deeper fall would be seen back to 0.8201/21 key support zone. However, decisive break of 0.8867 will suggest that EUR/GBP is already reversing whole decline from 0.9267 (2022 high). That should pave the way back to 0.9267.
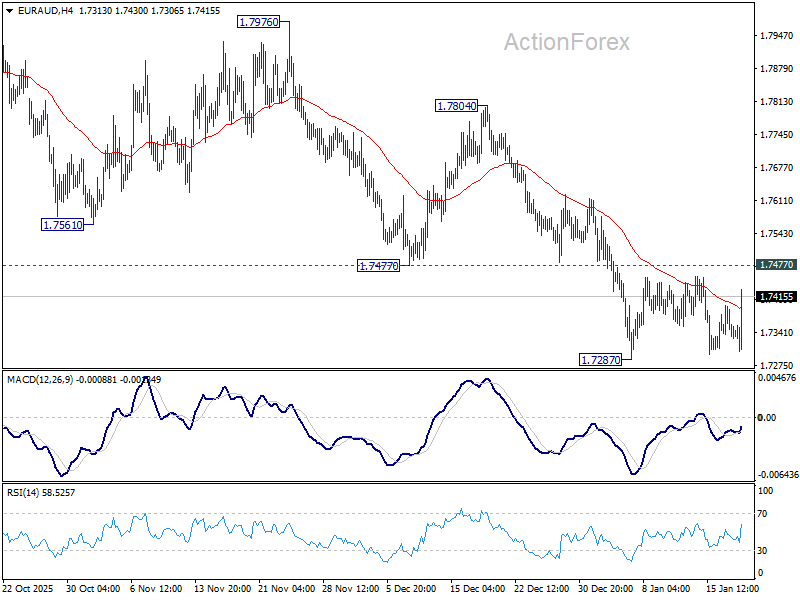
EUR/AUD Daily Outlook
Daily Pivots: (S1) 1.7319; (P) 1.7359; (R1) 1.7385; More...
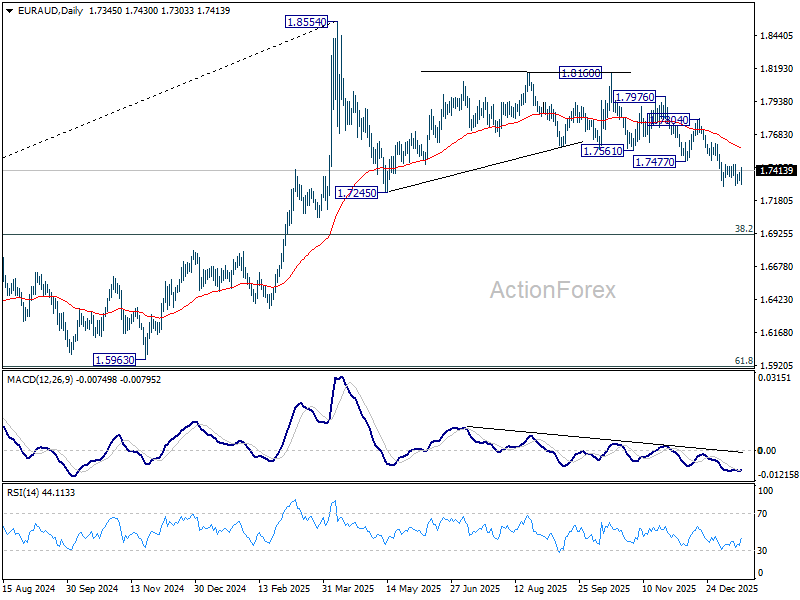
EUR/AUD is still bounded in range above 1.7287 and intraday bias stays neutral. Further decline is in favor with 1.7477 support turned resistance intact. On the downside, break of 1.7287 will resume the fall from 1.8160. As this is seen as the third leg of the corrective pattern from 1.8554, deeper fall should be seen to 1.7245 support and below. Nevertheless, firm break of 1.7477 will indicate short term bottoming, and bring stronger rebound back to 55 D EMA (now at 1.7577).
In the bigger picture, the break of 55 W EMA (now at 1.7464) argues that fall from 1.8554 medium term top is correcting whole up trend from 1.4281 (2022 low). Deeper decline is in favor to 38.2% retracement of 1.4281 to 1.8554 at 1.6922, and possibly below. Risk will stay on the downside as long as 1.8160 resistance holds, in case of strong rebound.
EUR/CHF Daily Outlook
Daily Pivots: (S1) 0.9271; (P) 0.9285; (R1) 0.9301; More....
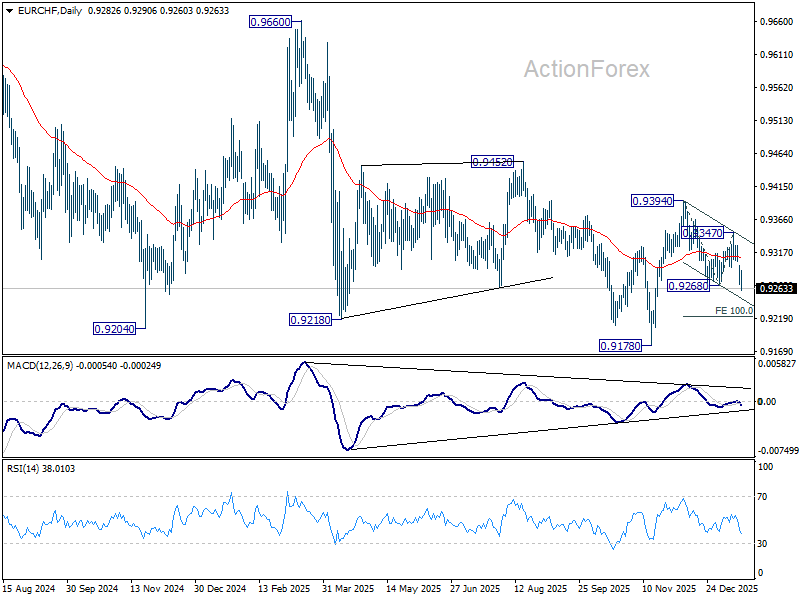
EUR/CHF's break of 0.9268 suggests that fall from 0.9394 is resuming. Intraday bias stays on the downside for 100% projection of 0.9394 to 0.9268 from 0.9347 at 0.9221. Break will bring retest of 0.9178 low. On the upside, above 0.9297 minor resistance will turn intraday bias neutral again first.
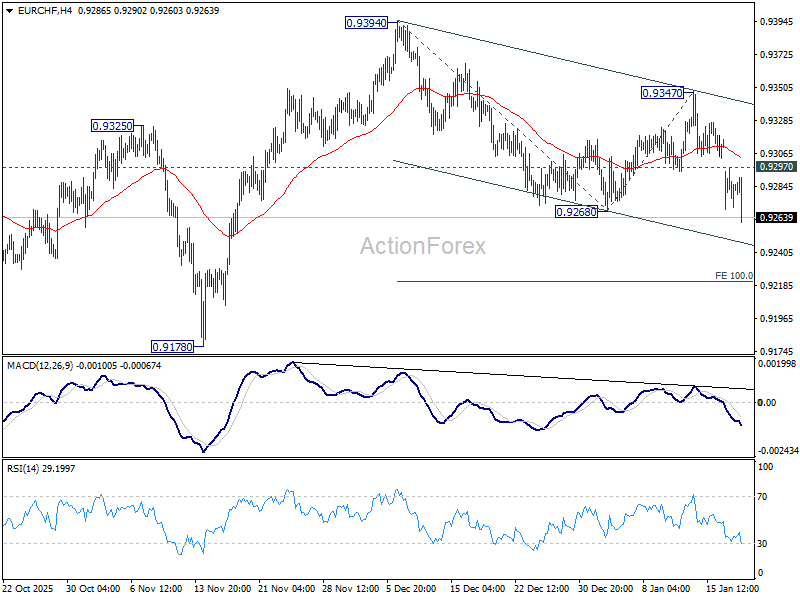
In the bigger picture, persistent bullish convergence condition in W MACD is a medium term bullish sign. Firm break of 0.9394 resistance should bring sustained trading above 55 W EMA (now at 0.9360). That should indicate medium term bottoming at 0.9178. Further break of 0.9452 resistance will bring stronger medium term rally towards 0.9928 resistance next, even still as a corrective bounce. Nevertheless, rejection by 55 W EMA will retain bearishness for another fall through 0.9178 at a later stage.
USD/CAD Daily Outlook
Daily Pivots: (S1) 1.3847; (P) 1.3883; (R1) 1.3905; More...
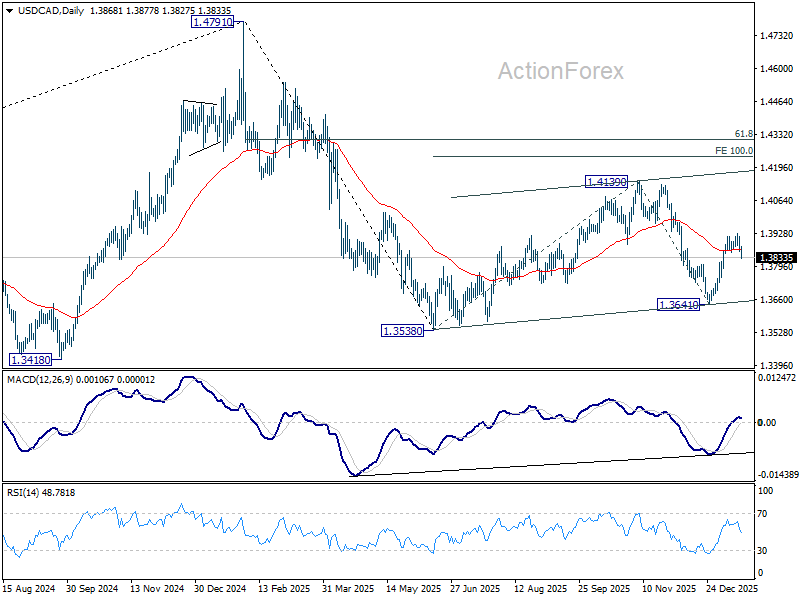
USD/CAD's retreat from 1.3927 extends lower, but stays above 1.3789 support. Intraday bias remains neutral first, and further rally is still in favor. ON the upside, Above 1.3927 will target 1.4139 first. Break there will target 100% projection of 1.3538 to 1.4139 from 1.3641 at 1.4242, as the third leg of the corrective pattern from 1.3538. However, firm break of 1.3789 will bring deeper fall back to 1.3641 support instead.
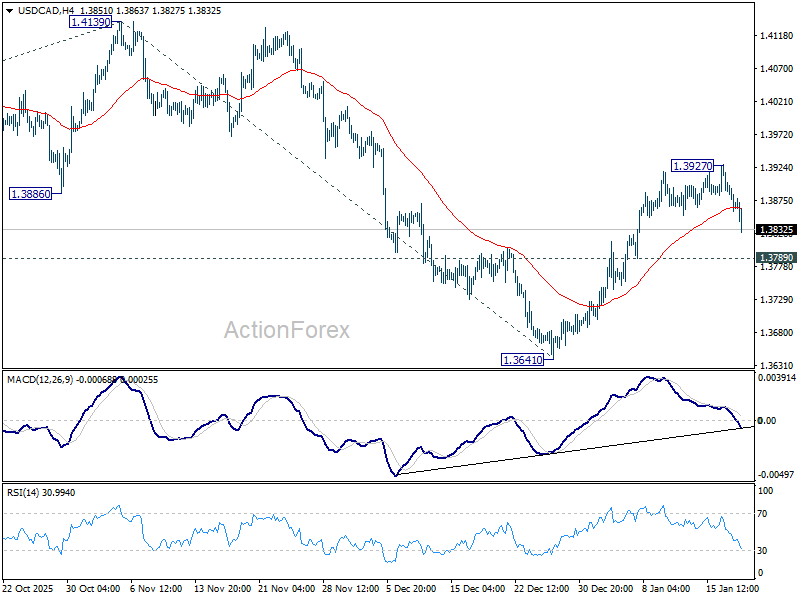
In the bigger picture, price actions from 1.4791 are seen as a corrective pattern to the whole up trend from 1.2005 (2021 low). Deeper fall could be seen as the pattern extends, and break of 1.3538 will target 61.8% retracement of 1.2005 to 1.4791 at 1.3069. For now, medium term outlook will be neutral until there are signs that the correction has completed.