
Sample Category Title
NZD/USD presses resistance Q4 CPI awaited on RBNZ hike guidance
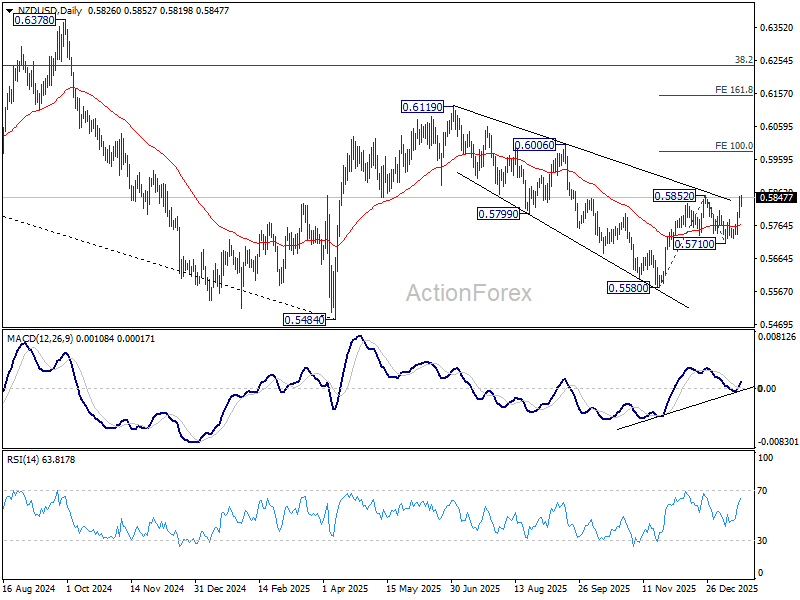
NZD/USD has surged sharply this week and is now pressing key near-term resistance at 0.5852, as shifting global risk dynamics unexpectedly favor the Kiwi. With Dollar and Euro under pressure from Greenland-related geopolitical tensions, both New Zealand dollar and Australian Dollar have surprisingly emerged as relative safe havens, benefiting from stable domestic backdrops and distance from the dispute.
At the same, Yen remains under pressure, weighed down by an aggressive selloff in Japanese government bonds as markets price in post-election fiscal expansion. That divergence has left antipodean currencies unusually well-bid, along with Swiss Franc.
For Kiwi, attention now turns to New Zealand Q4 CPI, due Friday in Asia. The annual rate is expected to hold at 3.0%, right at the top of the RBNZ’s 2–3% target band. With the Official Cash Rate at 2.25%, markets broadly agree the RBNZ has completed its easing cycle. The open question is timing of the next hike, not whether one eventually comes. CPI overshoot would sharply pull forward expectations and offer fresh support to NZD.
That focus will intensify at the February 18 OCR review, the first major policy decision under new Governor Anna Breman. Markets will be listening closely to the tone of the post-meeting press conference for clues on whether Breman leans hawkish, dovish, or neither.
Technically, NZD/USD's dip to 0.5710 earlier this month was a little deeper than expected. But that didn't alter the overall structure. The corrective down trend from 0.6119 (2025 high) should have completed with three waves down to 0.5580.
Firm break of 0.5852 will resume the whole rally from 0.5580 and target 100% projection of 0.5580 to 0.5852 from 0.5710 at 0.6015. Decisive break of 0.6015 will solidify that NZD/USD is in an impulsive move that should be resuming whole rise from 0.5484 (2025 low) through 0.6119. In any case, outlook will now stay bullish as long as 0.5710 support holds.
UK CPI rises to 3.4%, core holds at cycle low of 3.2%
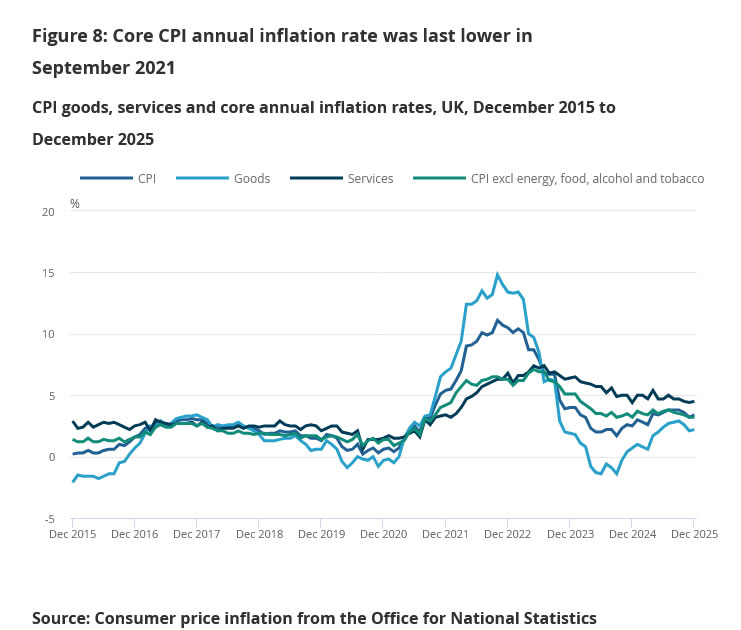
UK inflation firmed at the end of 2025, with headline pressure coming in slightly hotter than expected. CPI rose to 3.4% yoy in December, up from 3.2% and above expectations of 3.3%, while prices increased 0.4% mom, pointing to ongoing near-term inflation momentum.
The upside in headline inflation, however, masked relative stability in underlying pressures. Core CPI—excluding energy, food, alcohol and tobacco—was unchanged at 3.2% yoy, undershooting expectations of 3.3%, and marking the joint-lowest reading since December 2024. Core inflation was last lower in September 2021, reinforcing the view that underlying disinflation progress, while slow, remains intact.
By component, services inflation edged up to 4.5% yoy from 4.4%, keeping the sector firmly in focus for the BoE, while goods inflation rose to 2.2% from 2.1%.
Tensions on Japanese Bond Market Ease Somewhat
Markets
US President Trump’s key note speech at the World Economic Forum in Davos is scheduled around 2:30 pm CET today. In an opinion peace in the Financial Times, US secretary of commerce explained that the US administration isn’t going to Davos to uphold the globalist status quo, but to confront it head-on. “We aren’t going to Davos to blend in. We’re not asking permission or seeking approval. We are here to declare that the era of America Last has come to an end.” America first, although that doesn’t mean America alone. As long as you play ball with America of course. After his keynote speech, he’ll meet with EU leaders who hope to defuse the Greenland crisis or at least drop the tariff treats. An interview with CNBC is scheduled after European market close. Transatlantic relations hit rock bottom this week. Financial markets cramped, turning against US assets in general and selling off bonds and stocks in lockstep. Main US equity indices lost 1.75% (Dow) to 2.4% (Nasdaq) after reopening from the long weekend. EUR/USD closed at 1.1725 from a start at 1.1646. The US yield curve bear steepened with yields adding 1 bp (2-yr) to 8.2 bps (30-yr). The US 10-yr yield confirmed the technical break above 4.2%. Recall that the US administration in the aftermath of the Liberation Panic started moderating its aggressive opening gambits when long term US yields hit certain levels (respectively 4.5% and 5% area for 10y & 30y yield). It suggests that US rhetoric could remain hawkish going into the Feb 1st deadline for 10% tariffs on eight EU countries. We’re not yet inclined to step in and buy the dip already on US assets. On a sidetrack, we today follow the US supreme court hearing regarding President Trump’s Fed governor Cook. It boils down to the interpretation of firing board members “for cause”. That’s not formally defined but understood to mean because of serious malfeasance in office. Lower courts have ruled in favour of Cook, indicating a strict definition of “for cause”. A more expansive interpretation by the conservative supreme court hands the US president a strong precedent and harms legal protections against the independent US central bank. Such outcome is a wildcard for trading but would add fuel to the market fire.
Tensions on the Japanese bond market, another fire accelerator, ease somewhat this morning. The long end of the curve corrects 15 bps lower after this week’s violent JGB sell-off as markets fear that PM Takaichi might overdue it on the fiscal stimulus should her LDP party gain an outright majority in February 8 lower house (snap) elections. The Japanese FM tried to restore calm yesterday after Asian trading hours, suggesting that a sales tax cut proposal for food wouldn’t be funded by new borrowing. Japan’s second largest bank, Sumitomo Mitsui Financial Group, this morning announced plans to increase its Japanese government bond portfolio to as much as double the current JPY 10.6tn.
News & Views
In first public comments after becoming member of the MPC of the Polish National Bank end last year, Marcin Zarzecki agreed with the decision to leave to policy rate unchanged at 4% this month. He indicated that a return to interest rate cuts should only take place if the new projections clearly confirm that the disinflationary process is sustainable. Keeping rates at a reasonable level increases the anti-inflationary effectiveness of policy and solidifies the process of anchoring inflation expectations. Zarzecki even warned that soft incoming inflation figures shouldn’t automatically green light further easing as the MPC is focused on the inflation outlook. There as signs that there is some division within the MPC on the timing of further easing as other members recently left the door open for a Q1 rate cut. Zarzecki sees Governor Glapinski’s indications about the rate cut cycle bottoming out near 3.5% as a reasonable point of reference. The new MPC member also warned that an overly accommodative policy might limit the MPC’s ability to respond to potential external shocks, such as an escalation in geopolitical tensions.
Reuters reports that the German Government is in the process of lowering its GDP forecast for this year from 1.3% tot 1%. According to a draft report, also 2027 growth might be downwardly revised from 1.4% to 1.3%. The 2026 growth is still substantially higher compared to the 2025 outcome of 0.2% yearly growth. The revision might be included in the annual economic report of the Ministry of Finance that will be revealed on January 28.
The Greenland Chaos Will Remain the Main Course of the Week
An exotic blend of rising geopolitical tensions between the US and the EU — over Donal Trump’s willingness to buy Greenland — and a major selloff in Japanese government bonds, in the context of Japanese PM Sanae Takaichi confirming a snap election on February 8 in hopes of consolidating power and injecting more public money into the Japanese economy, rattled global financial markets yesterday.
The US 10-year yield flirted with the 2.40% level, while the 30-year jumped more than 25 basis points — a huge move — past 3.90%, and the 40-year pushed above 4%. Selling pressure eased and yields are lower this morning, but the violence of the move almost made investors forget about the US’ willingness to buy Greenland.
In FX markets, dollar and yen bears raced each other to see who could sell faster. Dollar bears were ahead, with the USDJPY fluctuating around the 158 level, while the dollar index fell the most in 10 days.
On the bond side, the US 10-year yield briefly traded above the 4.30% level, as investors continued to reduce US exposure, worried that:
- The US is becoming too aggressive for allies to continue viewing its government debt as a safe haven, and
- The exploding US debt pile is unsustainable — the good old US debt story — possibly amplified by fears that military spending must rise if the US becomes more assertive globally.
The bad news is that elsewhere, appetite for bonds didn’t look much better. European benchmark 10-year yields also rose, alongside growing cracks among European members facing differentiated US treatment over the Greenland story — only a handful being subject to fresh tariffs, not all of them.
We heard the German Chancellor say it is normal that the French react more because they are more sensitive to US tariffs, while Italy attempt to mediate the dispute — with little conviction from European peers so far.
The Greenland chaos will remain the main course of the week and will be served again today, as Donald Trump prepares to rock the boat in Davos. The rally in gold to $4’876 per ounce is a good indicator of how uncertain and tense markets have become.
I hope I am wrong — but there is a greater chance that the two sides of the Atlantic will not reach an agreement on Greenland in a single day. The UK and the Irish took almost a decade to reach an agreement on fishing rights; here, we are talking about an issue that could mark the beginning of the end for NATO. The implications would be huge — so huge that no one can fully grasp their extent. What we do know is that, either way, Europe will have to strengthen its defence. All members will need to set aside budgets for increased military spending in the coming years. Regardless of who takes the tariff or military hit today, tomorrow it will be someone else’s turn.
As a result, capital is flowing into European defence stocks, while at the index level, selling pressure dominates.
Across the Atlantic, market mood is no better. Major US indices gapped lower at the open of the holiday-shortened week — which is healthy. It is a sign that investors still care. The S&P 500 lost more than 2%, while the tech-heavy Nasdaq fell even more, on fears that tensions with the EU could finally push Europeans to tax US Big Tech companies.
This would add to the growing list of investor discomforts: circular AI deals, overleveraged investments, delayed ROI, rising metals prices, and higher memory chip costs. It is therefore unclear whether earnings will be enough to soothe nerves. Headline numbers will be tested, as investors dig into the details: has Nvidia converted receivables into cash? What are companies’ real cross-exposures in an environment where everyone’s hand is in everyone’s pocket?
Speaking of earnings, Netflix announced that it amended its offer to buy Warner Bros to an all-cash deal and reported Q4 earnings after the bell. The company narrowly beat earnings and revenue estimates. Ad revenue grew more than 2.5x year-on-year to over $1.5bn — something that could help soothe worries that OpenAI – which will shortly bring ads on its free chatbot - is not generating enough cash to match its massive infrastructure investment. However, Netflix shares fell in after-hours trading as Netflix warned of higher program spending and WB acquisition-related costs.
Looking ahead, we will keep an eye on the Greenland story — impossible to miss — Japanese yields, and upcoming earnings. The only certainty is uncertainty.
As a result, equity volatility is rising, and bond volatility — which had been falling due to strong demand for bonds of all kinds since last year — is likely to rebound from the lowest levels seen since Q4 2021.
Developed-market sovereign bonds no longer offer the diversification investors need in the current environment. They remain under pressure from geopolitical tensions that will drive higher security spending, at a time when debt levels are already unsustainable.
Where does capital go? Into gold, silver, copper, industrial metals, rare earths – hard commodities.
In short, investors are moving into anything tangible. What is striking is that Bitcoin has had little to no role in this flight to real assets. I would have expected stronger performance, but seemingly, the technology appetite weighs heavier than its 'commodity' status.
UK CPI in Focus, But Davos and Fed Independence Take Spotlight
In focus today
In the UK, focus turns to the December inflation print. While price pressures have eased recently, paving the way for potential Bank of England rate cuts, core inflation remains elevated at 3.2% y/y.
In Denmark, November payroll data will be released. Payrolls rose by 3,500 in October, slightly lower than September's increase but still indicating solid progress in the Danish labour market.
In the US, the Supreme Court will hear arguments on whether President Trump can remove Fed Governor Lisa Cook for cause over alleged mortgage fraud. The case has reignited tensions around Fed independence, particularly after last week's issuance of grand jury subpoenas to the Fed related to Fed Chair Powell. Oral arguments begin at 16.00 CET, with the timing of the ruling uncertain, potentially arriving in February or as late as the end of the term in June.
We will also look to developments from the World Economic Forum in Davos. Among the speakers are ECB's Lagarde and President Trump. Trump is scheduled to deliver a special address from 14.30-15.15 CET and has plans to discuss the Greenland dispute with various parties at the forum.
Economic and market news
What happened overnight
In the US, President Trump signed an executive order aimed at boosting home-ownership by restricting large institutional investors from purchasing single-family homes. The order also directs federal agencies, including the DOJ and FTC, to review investor acquisitions for anti-competitive practices in the single-family rental market, while promoting home sales to individual buyers. These measures come as Trump faces pressure to address housing affordability ahead of congressional elections.
What happened yesterday
In Germany, the January ZEW index rose more than expected, with the assessment of the current situation at -72.7 (cons: -76.0, prior: -81.0) and expectations at 59.6 (cons: 50.0, prior: 45.8). This marks the highest levels since August and summer 2021, respectively. With the infrastructure package now "live," we expect the growth momentum from Q4 2025 to continue into 2026, forecasting a 1.2% y/y rise in GDP as consumers also benefit from an increase in real incomes. However, President Trump's recent tariff threats pose a clear downside risk if implemented, as Germany's economy is more exposed to the US than other major euro area countries, with exports accounting for 4% of GDP.
In France, PM Lecornu invoked Article 49.3 of the French constitution to pass the revenue side of the 2026 budget without a parliamentary vote, exposing his government to no-confidence motions on Friday. Socialist Party leader Olivier Faure confirmed his party would not back efforts by far-left and far-right parties to topple the government, ensuring Lecornu's survival and increasing the likelihood of the budget passing before February. Following the vote on Friday, Lecornu is expected to trigger Article 49.3 immediately again to pass the spending side of the budget, triggering another vote next week, and finally a third activation and vote to pass the full budget. The new budget aims to cut France's deficit to 5% of GDP, which, all else equal, should be supportive for French government bonds.
In the UK, the December/November labour market report came in close to expectations. Payrolls declined by 43K in December, indicating a renewed acceleration in job losses. However, revisions to the October/November job loss makes up for the poorer December. Private sector wage growth (3M rolling average) slowed to 3.6% y/y in November (prior: 3.9%). Average earnings excluding bonus were 4.5%, as expected. The unemployment rate held steady at 5.1% in November.
Equities: Global equities sold off sharply yesterday, led by the US and cyclicals. However, the internal market dynamics are more nuanced than the headline suggests. Small caps outperformed large caps, value outperformed growth, and in Europe there was virtually no difference between cyclical and defensive performance. This is a key point for the current investment narrative. The rotation away from US growth/tech/AI leadership started well before the Greenland headlines and the renewed tariff threats against eight countries. What has changed more recently is the framing. As geopolitical tensions escalate, the story is increasingly morphing into a sell-America/de-dollarization narrative. We flagged this already in yesterday's Morning Espresso, but it became materially clearer throughout the session. This dynamic is also politically relevant: it does little to strengthen the US president's leverage in his Greenland project. Overnight, Asian equities are lower. European futures point down, while US futures are marginally higher.
FI and FX: After a violent, record sell-off in Japanese bonds yesterday that weighed also on global fixed income markets, things have stabilised somewhat overnight with 30Y Japanese yields coming 6-7bp lower. This has contributed to improving global risk appetite with the large equity futures modestly in green this morning. In FX markets the JPY has been remarkably stable despite both higher Japanese yields and risk-off. The GBP and USD have done poorly with market attention returning to the "Sell US"-narrative while the SEK and CHF have made for a quite unusual pair of winners in Majors space. This likely reflects the CHF safe-haven status on the one hand and the SEK's reverse "Sell US" properties. The NOK FX price action has mirrored global risk appetite closely while EUR/DKK declined yesterday likely reflecting rebalancing flows countering the usual upward pressure on the cross during periods of equity sell-offs. Finally, EUR/USD xCCY basis markets exhibited a slight widening pressure yesterday.
Gold Explodes to New Highs, WTI Crude Searches for Support
Gold price started a fresh surge above $4,800 and traded to a new all-time high. Crude oil is recovering and might rise toward $61.20.
Important Takeaways for Gold and WTI Crude Oil Prices Analysis Today
- Gold price rallied to a new all-time high and traded above $4,845 against the US Dollar.
- A key bullish trend line is forming with support at $4,775 on the hourly chart of gold at FXOpen.
- WTI Crude oil is recovering losses and trading above $59.00.
- There is a rising channel forming with support at $59.40 on the hourly chart of XTI/USD at FXOpen.
Gold Price Technical Analysis
On the hourly chart of Gold at FXOpen, the price formed support near $4,535. The price remained in a bullish zone and started a fresh increase above $4,600.
The bulls pushed the price above $4,800 and the 50-hour simple moving average. Finally, it traded to a new all-time high at $4,849. The price is still showing bullish signs above $4,800, and the RSI is above 80.
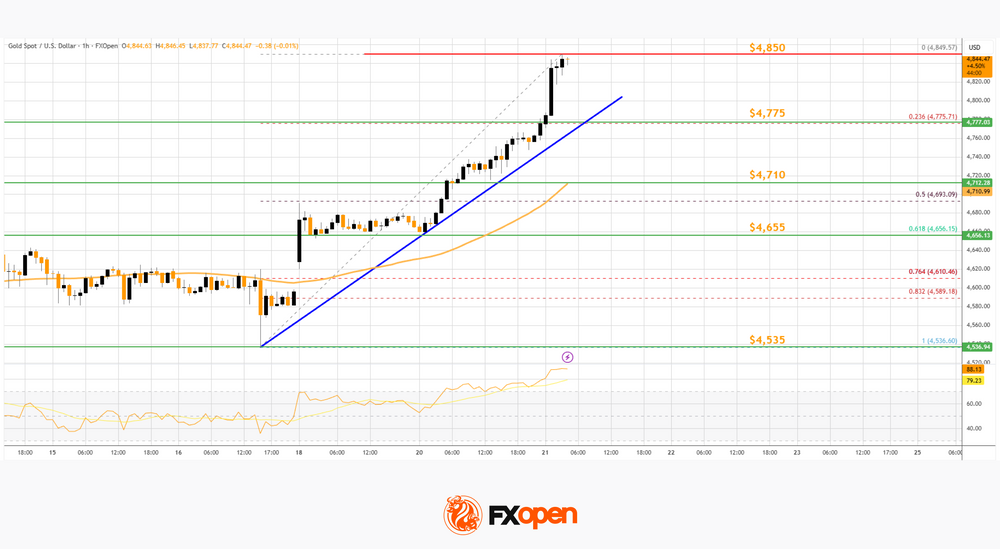
Initial bid zone on the downside could be near the 23.6% Fib retracement level of the upward move from the $4,536 swing low to the $4,849 high at $4,775. There is also a key bullish trend line forming with support at $4,775.
The next area of interest might be near the 50-hour simple moving average at $4,710. A downside break below $4,710 might send the price to $4,655 and the 61.8% Fib retracement.
If the bulls fail to protect $4,655, the price could start a larger downside correction. In the stated case, Gold could drop toward $4,535. The next area for the bulls might be $4,500. A daily close below $4,500 could spark bearish moves and send the price to $4,350.
If there is a fresh increase, the price could face resistance at $4,845. The next sell zone might be $4,880. An upside break above the $4,880 resistance could send Gold price toward $4,950. Any more gains may perhaps set the pace for an increase to $5,000.
WTI Crude Oil Price Technical Analysis
On the hourly chart of WTI Crude Oil at FXOpen, the price found support near $58.50 against the US Dollar. The price formed a base and started a recovery wave above $59.00 and the 50-hour simple moving average.
The bulls were able to push the price to the 50% Fib retracement level of the downward move from the $62.17 swing high to the $58.53 swing low. Besides, there is a rising channel forming with support at $59.40.
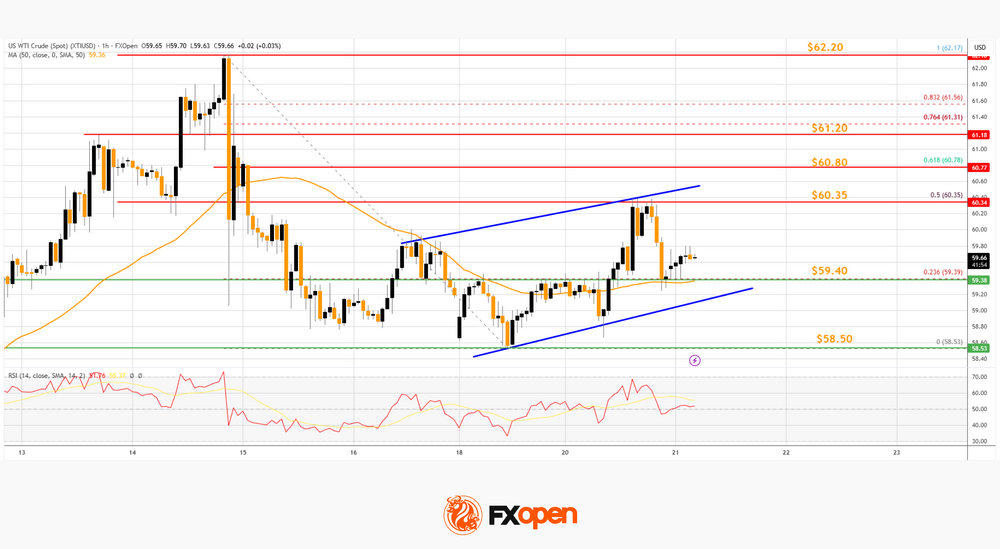
The hourly RSI is above the 80 level, and the price is currently consolidating below the $60.30 barrier. The next hurdle could be $60.80 and the 61.8% Fib retracement.
A clear move above $60.80 could send the price toward $61.20. Any more gains might open the doors for a test of $62.200. Conversely, the price might start a fresh decline from $60.35 or $60.80. Immediate support sits near $59.40 or the 50-hour simple moving average.
The key breakdown zone on the WTI crude oil chart might be $58.50. If there is a downside break, the price might decline toward $58.00. Any more losses might encourage the bears for a push toward $56.50.
Start trading commodity CFDs with tight spreads (additional fees may apply). Open your trading account now or learn more about trading commodity CFDs with FXOpen.
This article represents the opinion of the Companies operating under the FXOpen brand only. It is not to be construed as an offer, solicitation, or recommendation with respect to products and services provided by the Companies operating under the FXOpen brand, nor is it to be considered financial advice.
Bitcoin Gives Up Ground, Eyes Shift to Crucial Support Below
Key Highlights
- Bitcoin failed above $95,000 and trimmed most gains.
- BTC/USD traded below a bullish trend line with support at $92,000 on the 4-hour chart.
- Ethereum also dipped below $3,200 and $3,000.
- Gold extended its surge to a new record high above $4,720.
Bitcoin Price Technical Analysis
Bitcoin price failed to settle above $95,000 against the US Dollar. BTC started a fresh decline below $93,500 and $92,000.
Looking at the 4-hour chart, the price traded below a bullish trend line with support at $92,000. There was a move below the 50% Fib retracement level of the upward move from the $89,161 swing low to the $97,944 high.
The price even settled below the 100 simple moving average (red, 4-hour) and the 200 simple moving average (green, 4-hour). Immediate support sits at $88,200.
A downside break below $88,2000 might start another decline. The next major support is $87,500, below which BTC could decline toward $86,000. If there is a recovery wave, the price could face resistance at $90,500.
The first key hurdle is $92,000 and the same trend line. A close above $92,000 and then the 100 simple moving average (red, 4-hour) could start a steady increase. In the stated case, the price may perhaps rise toward the $95,000 level. Any more gains might call for a test of $97,000.
Looking at Ethereum, the price also reacted to the downside below $3,000. The bears might now aim for a drop below $2,880.
Today’s Key Economic Releases
- President Trump’s speech.
- ECB's President Lagarde speech.
Risk-Sentiment Sours Further, Gold (XAU/USD) Explodes
EU–US tensions are worsening, with the EU now pushing to suspend the tariff deal agreed upon in July, further clouding the political atmosphere.
US President Trump is currently addressing the public to celebrate “365 Days, 365 Wins,” highlighting what he frames as his key achievements over the past year as he marks the first anniversary of his second term.
He is, unsurprisingly, showcasing the strongest anecdotes from his perspective.
However, such addresses are unlikely to sit well with several EU leaders, especially amid growing pushback against the President’s recent rhetoric regarding Greenland.
The FX pair to watch to monitor how serious current discussions get is USD/CHF, situated at the perfect intercept between European issues, safe-haven demand and dedollarization trends – Down 1.90% since Friday!
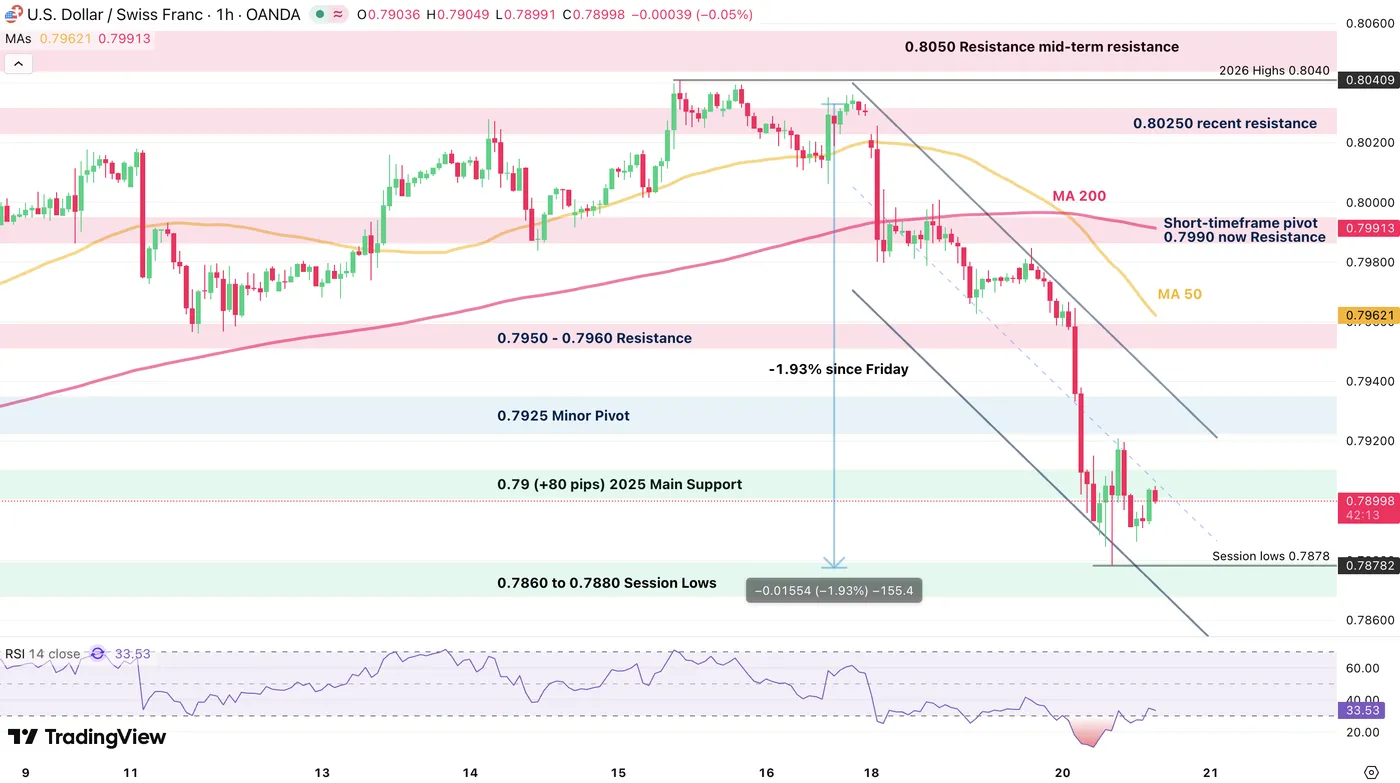
USD/CHF 2H Chart – January 20, 2026 – Source: TradingView
While this morning’s appearance by Treasury Secretary Scott Bessent briefly eased the tone — urging everyone to “take a deep breath and let things play out” — markets did not take comfort for long.
Gold had already gapped higher in yesterday’s session and continued to extend gains as US traders returned from the Martin Luther King Day holiday, now pushing toward $4,760. Silver and other metals are following suit, printing fresh highs.
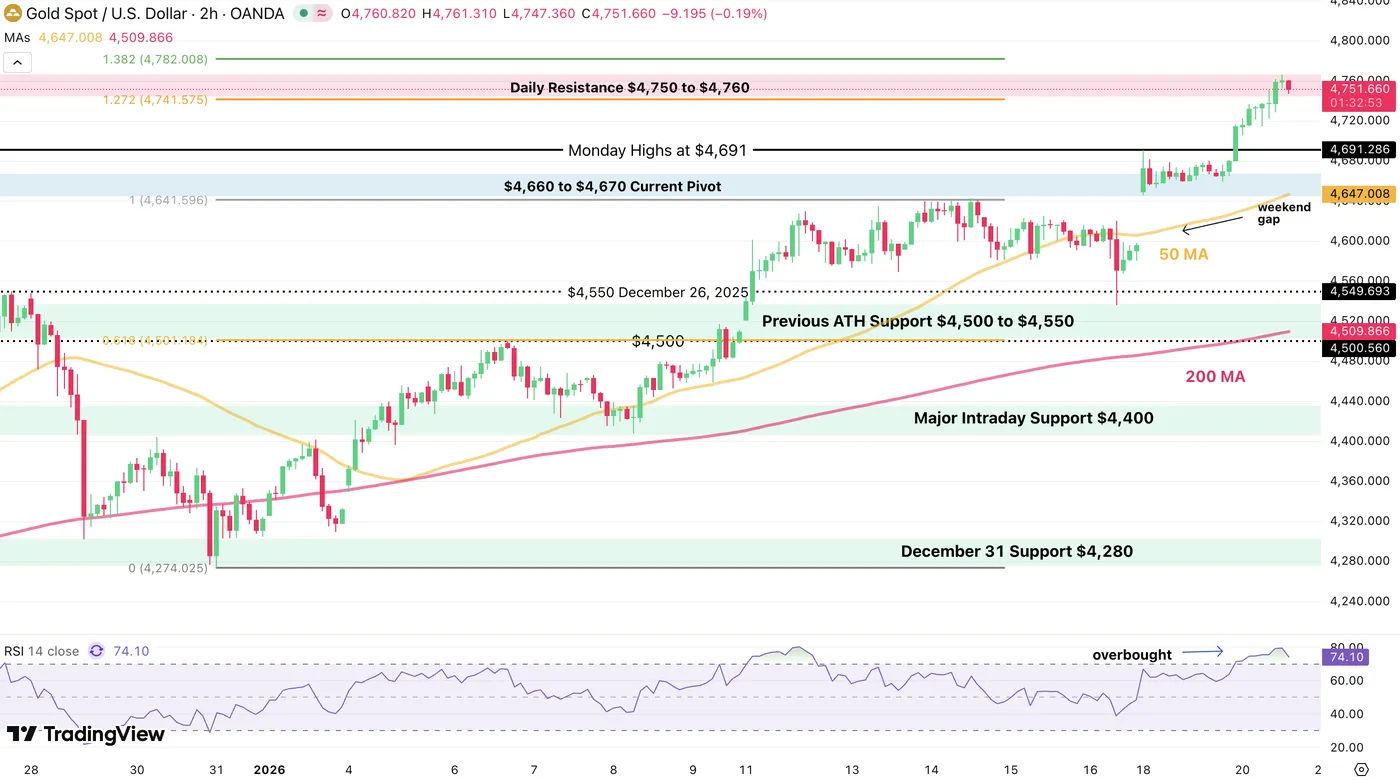
XAU/USD (Gold) 2H Chart – January 20, 2026 – Source: TradingView
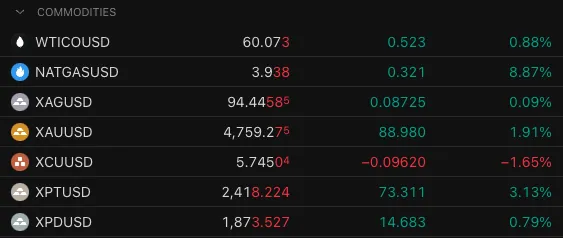
A look at the daily performance in Commodities, January 20, 2026 – Source: TradingView. XAG = Silver, XAU = Gold, XCU = Copper, XPT = Platinum, XPD = Palladium
Equities, on the other hand, tell a very different story. Stock indices bounced early in the session but topped quickly and failed to recover. The Dow Jones is now down 1.80%, while both the Nasdaq and S&P 500 are lower by around 2%.
The key question now shifts to US Treasuries, which are facing renewed selling pressure as European banks and funds consider further diversification away from the US dollar.
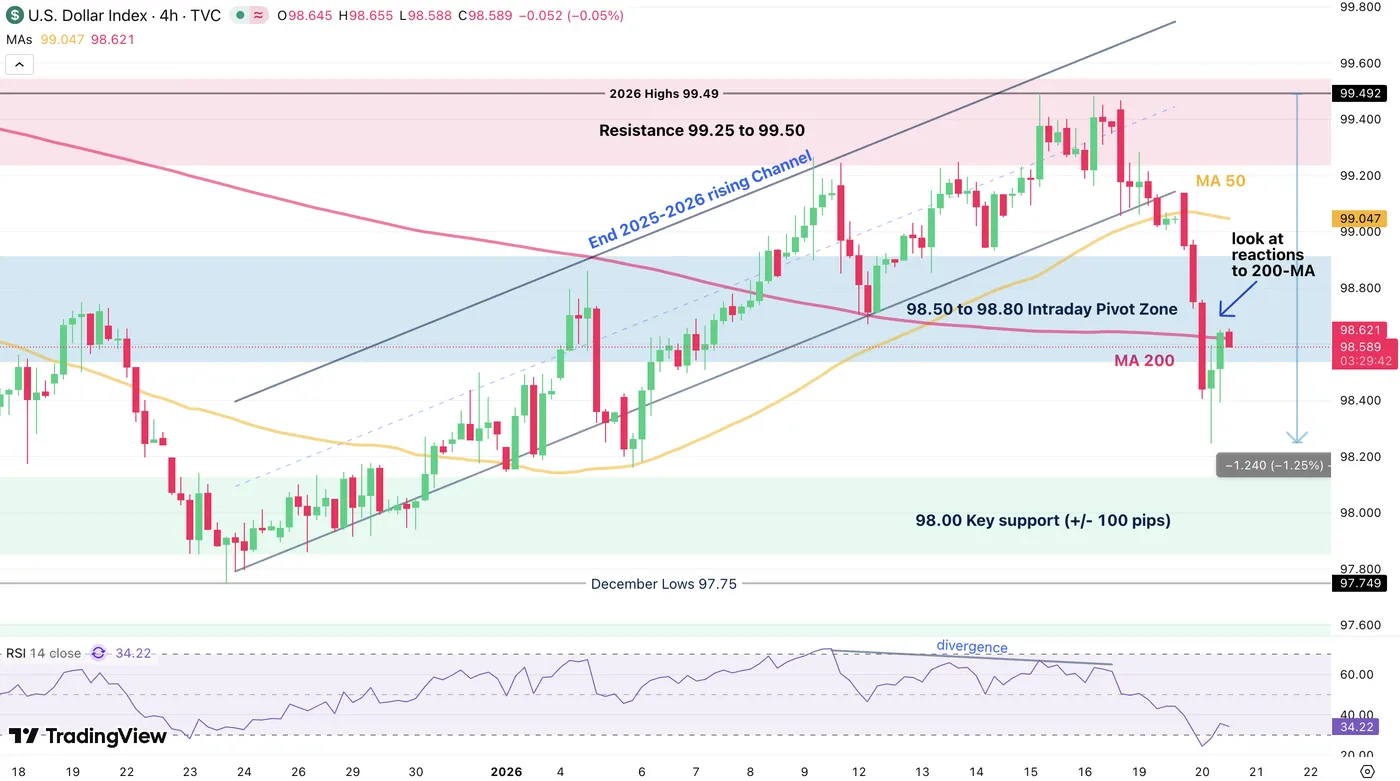
Dollar Index (DXY) 2H Chart, January 20, 2026 – Source: TradingView
The weaponization of foreign-owned assets has set a precedent — as seen with Russian assets in Europe and the US — and remains a growing concern for investors as Global leaders call out the New World Order and the World Economy Conference is ongoing.
Safe Trades!
Elliott Wave Outlook: Dow Futures (YM) Correcting Cycle From Nov 2025
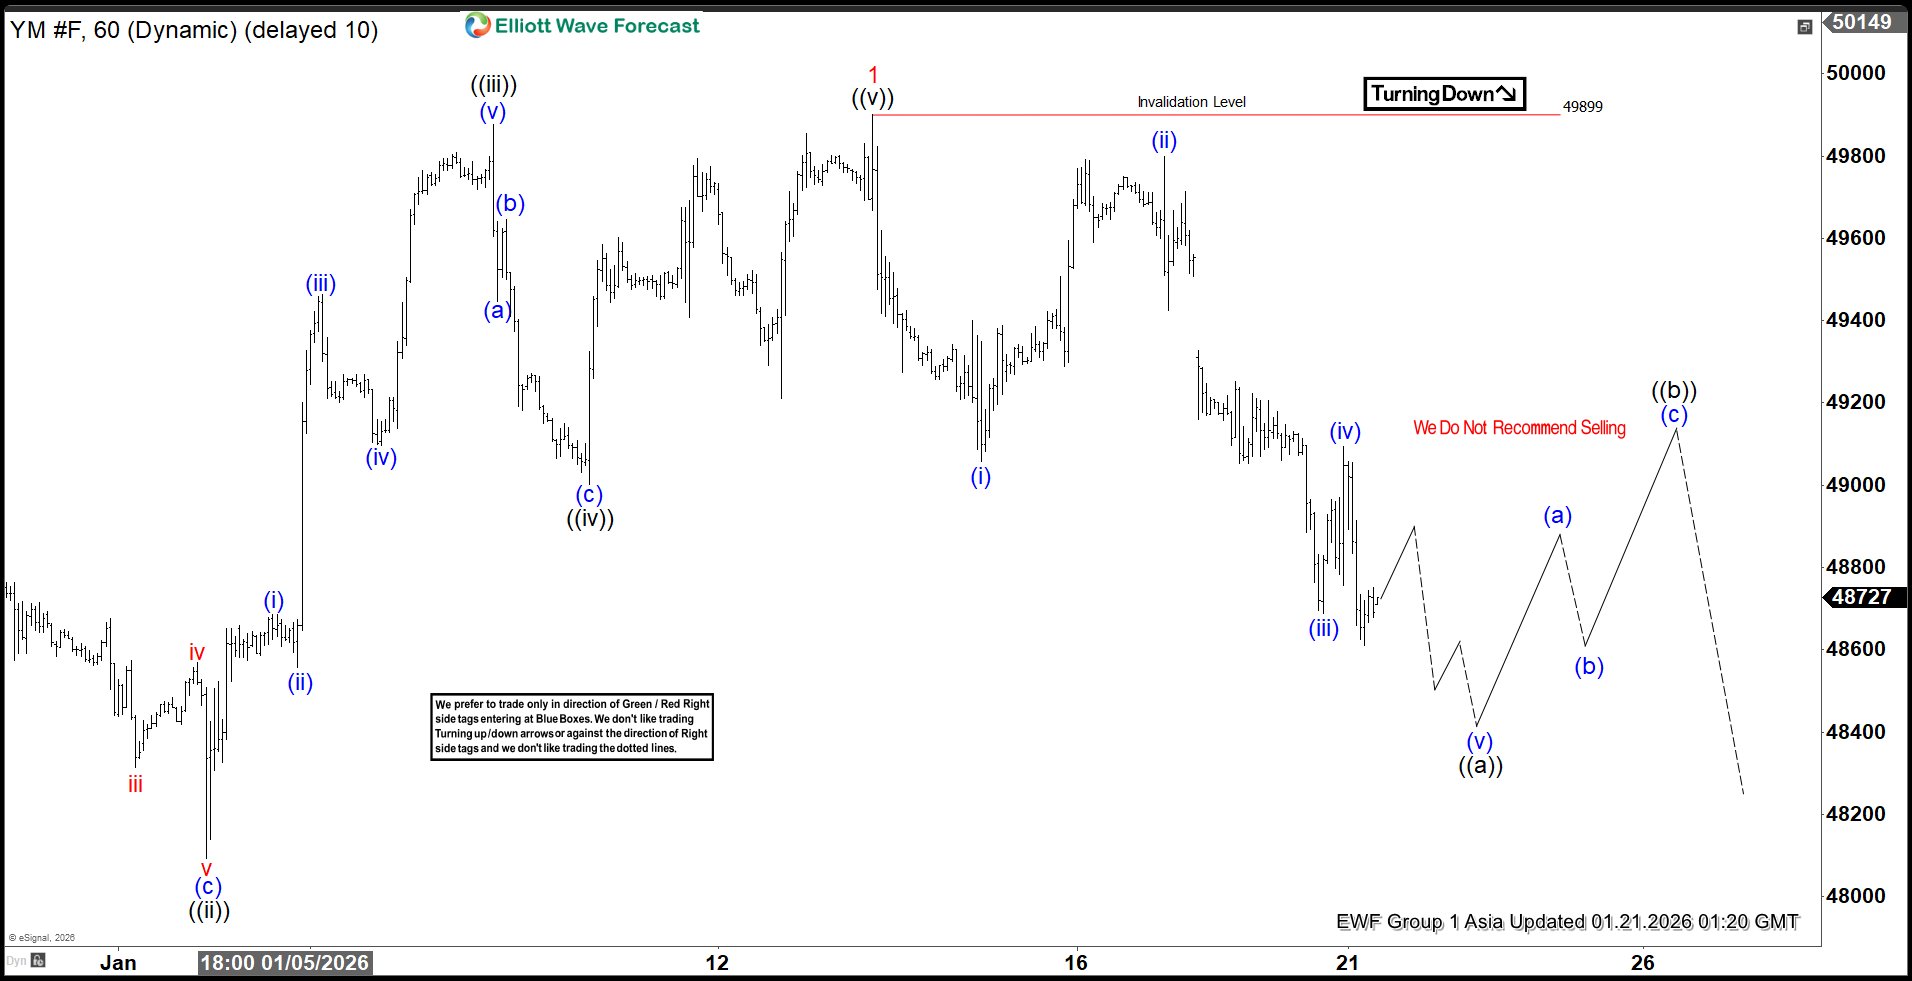
The short-term Elliott Wave view in Dow Futures (YM) indicates that the cycle from the November 21, 2025 low has concluded as a five-wave diagonal. From that low, wave ((i)) advanced to 49,299, followed by a corrective pullback in wave ((ii)) that reached 48,092, as shown in the one-hour chart. The subsequent rally in wave ((iii)) unfolded as a clear five-wave impulse. Within this sequence, wave (i) terminated at 48,686, while wave (ii) retraced to 48,556. Momentum then carried wave (iii) higher to 49,463, before a modest pullback in wave (iv) ended at 49,096. The final push in wave (v) reached 49,899, completing wave ((iii)). Afterward, the index corrected in wave ((iv)) toward 49,001, and the final leg in wave ((v)) advanced to 49,899, thereby completing wave 1 of a higher degree cycle.
Currently, the index is retracing in wave 2, correcting the advance from November 21. The internal structure of wave 2 is unfolding as a zigzag formation. From the peak of wave 1, wave (i) declined to 49,057, while wave (ii) rallied to 49,799. The downward move in wave (iii) reached 48,689, and wave (iv) rebounded to 49,095. The market is now expected to complete wave (v) of ((a)) shortly. Once this occurs, a corrective rally in wave ((b)) should follow, addressing the cycle from the January 13, 2026 high. This rally is anticipated to unfold in three, seven, or eleven swings, consistent with Elliott Wave guidelines. Afterward, the index is projected to resume its downward trajectory, continuing the broader corrective phase.
Dow Futures (YM) 60 minute chart
YM Elliott Wave video:
https://www.youtube.com/watch?v=CRSqWUUOBoo
Eco Data 1/21/26
| GMT | Ccy | Events | Act | Cons | Prev | Rev |
|---|---|---|---|---|---|---|
| 07:00 | GBP | CPI M/M Dec | 0.40% | 0.40% | -0.20% | |
| 07:00 | GBP | CPI Y/Y Dec | 3.40% | 3.30% | 3.20% | |
| 07:00 | GBP | Core CPI Y/Y Dec | 3.20% | 3.30% | 3.20% | |
| 07:00 | GBP | RPI M/M Dec | 0.70% | 0.50% | -0.40% | |
| 07:00 | GBP | RPI Y/Y Dec | 4.20% | 4.10% | 3.80% | |
| 07:00 | GBP | PPI Input M/M Dec | -0.20% | -0.10% | 0.30% | 0.50% |
| 07:00 | GBP | PPI Input Y/Y Dec | 0.80% | 1.10% | ||
| 07:00 | GBP | PPI Output M/M Dec | 0.00% | 0.10% | 0.10% | |
| 07:00 | GBP | PPI Output Y/Y Dec | 3.40% | 3.40% | ||
| 07:00 | GBP | PPI Core Output M/M Dec | -0.10% | 0.00% | 0.10% | |
| 07:00 | GBP | PPI Core Output Y/Y Dec | 3.20% | 3.50% | 3.60% | |
| 13:30 | CAD | Industrial Product Price M/M Dec | -0.60% | 0.30% | 0.90% | |
| 13:30 | CAD | Raw Material Price Index Dec | 0.50% | -0.50% | 0.30% | |
| 15:00 | USD | Pending Homeles M/M Dec | -9.30% | -0.30% | 3.30% |
| 07:00 | GBP |
| CPI M/M Dec | |
| Actual | 0.40% |
| Consensus | 0.40% |
| Previous | -0.20% |
| 07:00 | GBP |
| CPI Y/Y Dec | |
| Actual | 3.40% |
| Consensus | 3.30% |
| Previous | 3.20% |
| 07:00 | GBP |
| Core CPI Y/Y Dec | |
| Actual | 3.20% |
| Consensus | 3.30% |
| Previous | 3.20% |
| 07:00 | GBP |
| RPI M/M Dec | |
| Actual | 0.70% |
| Consensus | 0.50% |
| Previous | -0.40% |
| 07:00 | GBP |
| RPI Y/Y Dec | |
| Actual | 4.20% |
| Consensus | 4.10% |
| Previous | 3.80% |
| 07:00 | GBP |
| PPI Input M/M Dec | |
| Actual | -0.20% |
| Consensus | -0.10% |
| Previous | 0.30% |
| Revised | 0.50% |
| 07:00 | GBP |
| PPI Input Y/Y Dec | |
| Actual | 0.80% |
| Consensus | |
| Previous | 1.10% |
| 07:00 | GBP |
| PPI Output M/M Dec | |
| Actual | 0.00% |
| Consensus | 0.10% |
| Previous | 0.10% |
| 07:00 | GBP |
| PPI Output Y/Y Dec | |
| Actual | 3.40% |
| Consensus | |
| Previous | 3.40% |
| 07:00 | GBP |
| PPI Core Output M/M Dec | |
| Actual | -0.10% |
| Consensus | |
| Previous | 0.00% |
| Revised | 0.10% |
| 07:00 | GBP |
| PPI Core Output Y/Y Dec | |
| Actual | 3.20% |
| Consensus | |
| Previous | 3.50% |
| Revised | 3.60% |
| 13:30 | CAD |
| Industrial Product Price M/M Dec | |
| Actual | -0.60% |
| Consensus | 0.30% |
| Previous | 0.90% |
| 13:30 | CAD |
| Raw Material Price Index Dec | |
| Actual | 0.50% |
| Consensus | -0.50% |
| Previous | 0.30% |
| 15:00 | USD |
| Pending Homeles M/M Dec | |
| Actual | -9.30% |
| Consensus | -0.30% |
| Previous | 3.30% |