Sample Category Title
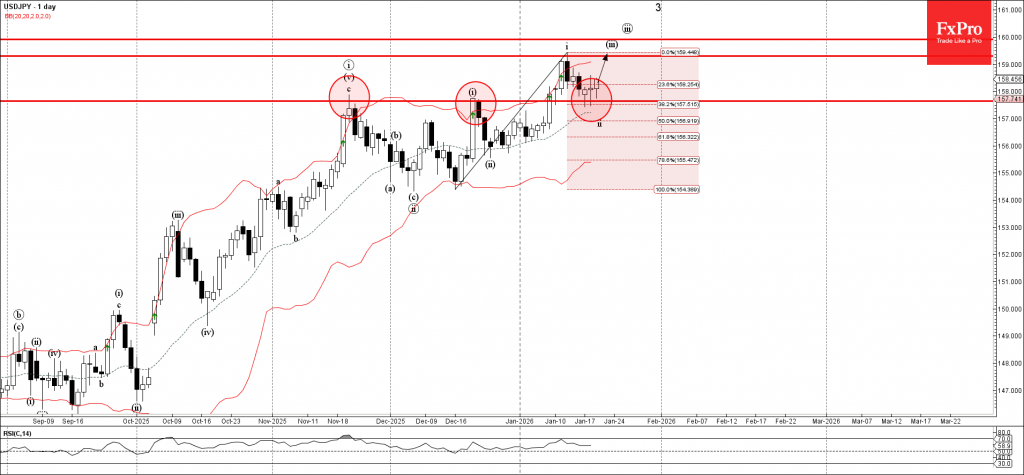
USDJPY Wave Analysis
USDJPY: ⬆️ Buy
- USDJPY reversed from support area
- Likely to rise to resistance level 5.50
USDJPY currency pair recently reversed up from the support area between the support level 157.75 (former strong resistance from November and October) and the 38.2% Fibonacci correction of the upward impulse from December.
The upward reversal from this support area continues the active multi-impulse upward sequence 3 from September.
Given the ы, Uniswap cryptocurrency can be expected to rise to the next resistance level 5.50 (former support from the start of January).
Eco Data 1/22/26
| GMT | Ccy | Events | Act | Cons | Prev | Rev |
|---|---|---|---|---|---|---|
| 23:50 | JPY | Trade Balance (JPY) Dec | -0.21T | -0.01T | 0.06T | 0.01T |
| 00:30 | AUD | Employment Change Dec | 65.2K | 26.5K | -21.3K | -28.7K |
| 00:30 | AUD | Unemployment Rate Dec | 4.10% | 4.40% | 4.30% | |
| 07:00 | GBP | Public Sector Net Borrowing (GBP) Dec | 11.6B | 13.5B | 11.7B | |
| 12:30 | EUR | ECB Monetary Policy Meeting Accounts | ||||
| 13:30 | CAD | New Housing Price Index M/M Dec | -0.20% | -0.20% | 0.00% | |
| 13:30 | USD | Initial Jobless Claims (Jan 16) | 200K | 209K | 198K | |
| 13:30 | USD | GDP Annualized Q3 | 4.40% | 4.30% | 4.30% | |
| 13:30 | USD | GDP Price Index Q3 | 3.70% | 3.80% | 3.80% | |
| 15:00 | USD | Personal Income M/M Nov | 0.30% | 0.40% | 0.10% | |
| 15:00 | USD | Personal Spending M/M Nov | 0.50% | 0.50% | 0.50% | |
| 15:00 | USD | PCE Price Index M/M Nov | 0.20% | 0.20% | 0.20% | |
| 15:00 | USD | PCE Price Index Y/Y Nov | 2.80% | 2.80% | 2.70% | |
| 15:00 | USD | Core PCE Price Index M/M Nov | 0.20% | 0.20% | 0.20% | |
| 15:00 | USD | Core PCE Price Index Y/Y Nov | 2.80% | 2.80% | 2.70% | |
| 15:00 | EUR | Eurozone Consumer Confidence Jan P | -12 | -13 | -15 | |
| 15:30 | USD | Natural Gas Storage (Jan 16) | -120B | -90B | -71B | |
| 17:00 | USD | Crude Oil Inventories (Jan 16) | 3.6M | -1.0M | 3.4M |
| 23:50 | JPY |
| Trade Balance (JPY) Dec | |
| Actual | -0.21T |
| Consensus | -0.01T |
| Previous | 0.06T |
| Revised | 0.01T |
| 00:30 | AUD |
| Employment Change Dec | |
| Actual | 65.2K |
| Consensus | 26.5K |
| Previous | -21.3K |
| Revised | -28.7K |
| 00:30 | AUD |
| Unemployment Rate Dec | |
| Actual | 4.10% |
| Consensus | 4.40% |
| Previous | 4.30% |
| 07:00 | GBP |
| Public Sector Net Borrowing (GBP) Dec | |
| Actual | 11.6B |
| Consensus | 13.5B |
| Previous | 11.7B |
| 12:30 | EUR |
| ECB Monetary Policy Meeting Accounts | |
| Actual | |
| Consensus | |
| Previous | |
| 13:30 | CAD |
| New Housing Price Index M/M Dec | |
| Actual | -0.20% |
| Consensus | -0.20% |
| Previous | 0.00% |
| 13:30 | USD |
| Initial Jobless Claims (Jan 16) | |
| Actual | 200K |
| Consensus | 209K |
| Previous | 198K |
| 13:30 | USD |
| GDP Annualized Q3 | |
| Actual | 4.40% |
| Consensus | 4.30% |
| Previous | 4.30% |
| 13:30 | USD |
| GDP Price Index Q3 | |
| Actual | 3.70% |
| Consensus | 3.80% |
| Previous | 3.80% |
| 15:00 | USD |
| Personal Income M/M Nov | |
| Actual | 0.30% |
| Consensus | 0.40% |
| Previous | 0.10% |
| 15:00 | USD |
| Personal Spending M/M Nov | |
| Actual | 0.50% |
| Consensus | 0.50% |
| Previous | 0.50% |
| 15:00 | USD |
| PCE Price Index M/M Nov | |
| Actual | 0.20% |
| Consensus | 0.20% |
| Previous | 0.20% |
| 15:00 | USD |
| PCE Price Index Y/Y Nov | |
| Actual | 2.80% |
| Consensus | 2.80% |
| Previous | 2.70% |
| 15:00 | USD |
| Core PCE Price Index M/M Nov | |
| Actual | 0.20% |
| Consensus | 0.20% |
| Previous | 0.20% |
| 15:00 | USD |
| Core PCE Price Index Y/Y Nov | |
| Actual | 2.80% |
| Consensus | 2.80% |
| Previous | 2.70% |
| 15:00 | EUR |
| Eurozone Consumer Confidence Jan P | |
| Actual | -12 |
| Consensus | -13 |
| Previous | -15 |
| 15:30 | USD |
| Natural Gas Storage (Jan 16) | |
| Actual | -120B |
| Consensus | -90B |
| Previous | -71B |
| 17:00 | USD |
| Crude Oil Inventories (Jan 16) | |
| Actual | 3.6M |
| Consensus | -1.0M |
| Previous | 3.4M |
The U.S. Dollar in 2025: Down, But Not Out
Highlights
- The U.S. dollar is coming off a difficult year, but concerns that global investors are fleeing it in droves are overblown.
- The depreciation over the past year still leaves the dollar close to 2024 levels on a trade-weighted basis and in line with its long-term average against many major currencies.
- Looking ahead to 2026, we see additional downside to the greenback of around 3%.
- There is little evidence that the diversification away from dollar-centric systems has accelerated, but it does continue gradually.
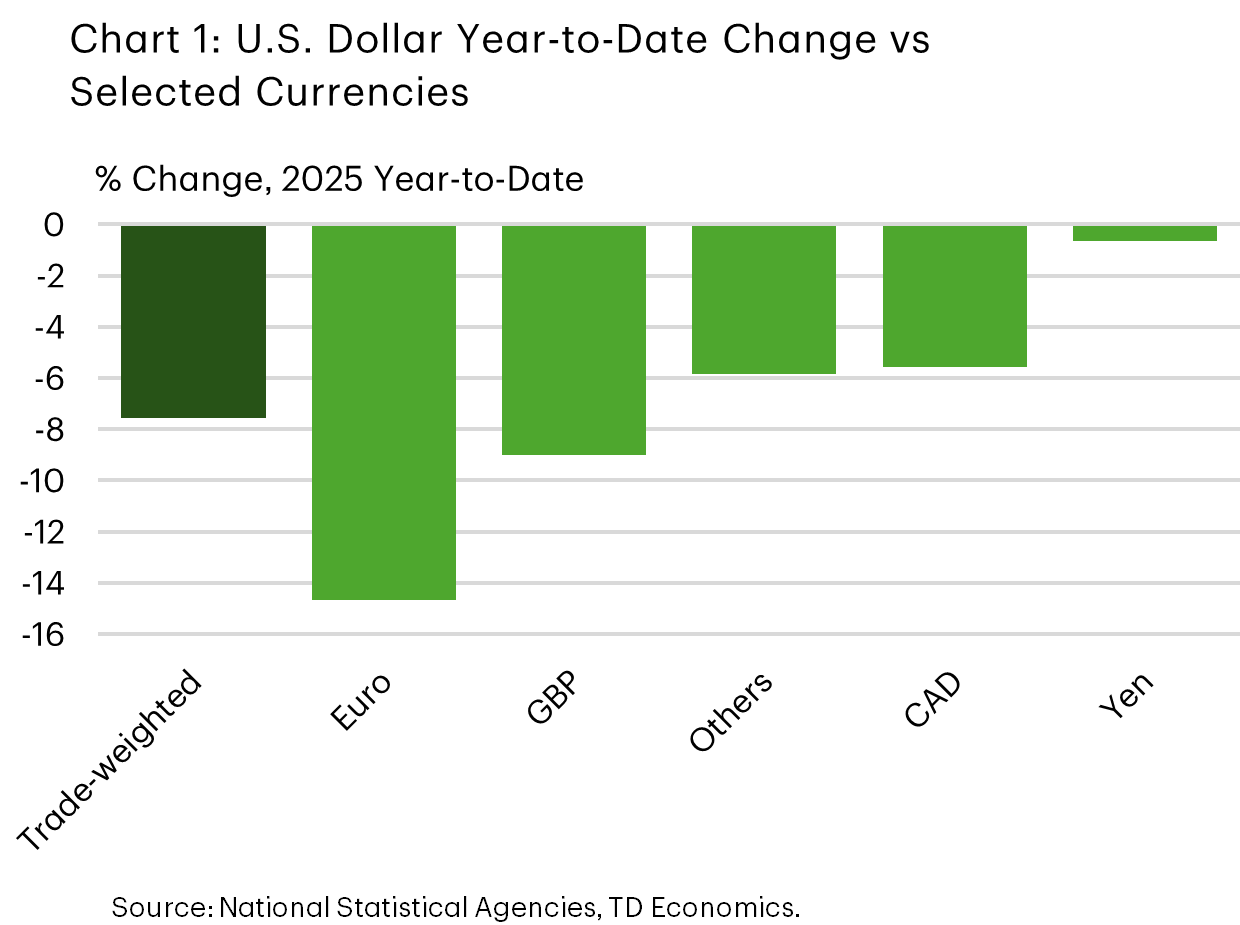
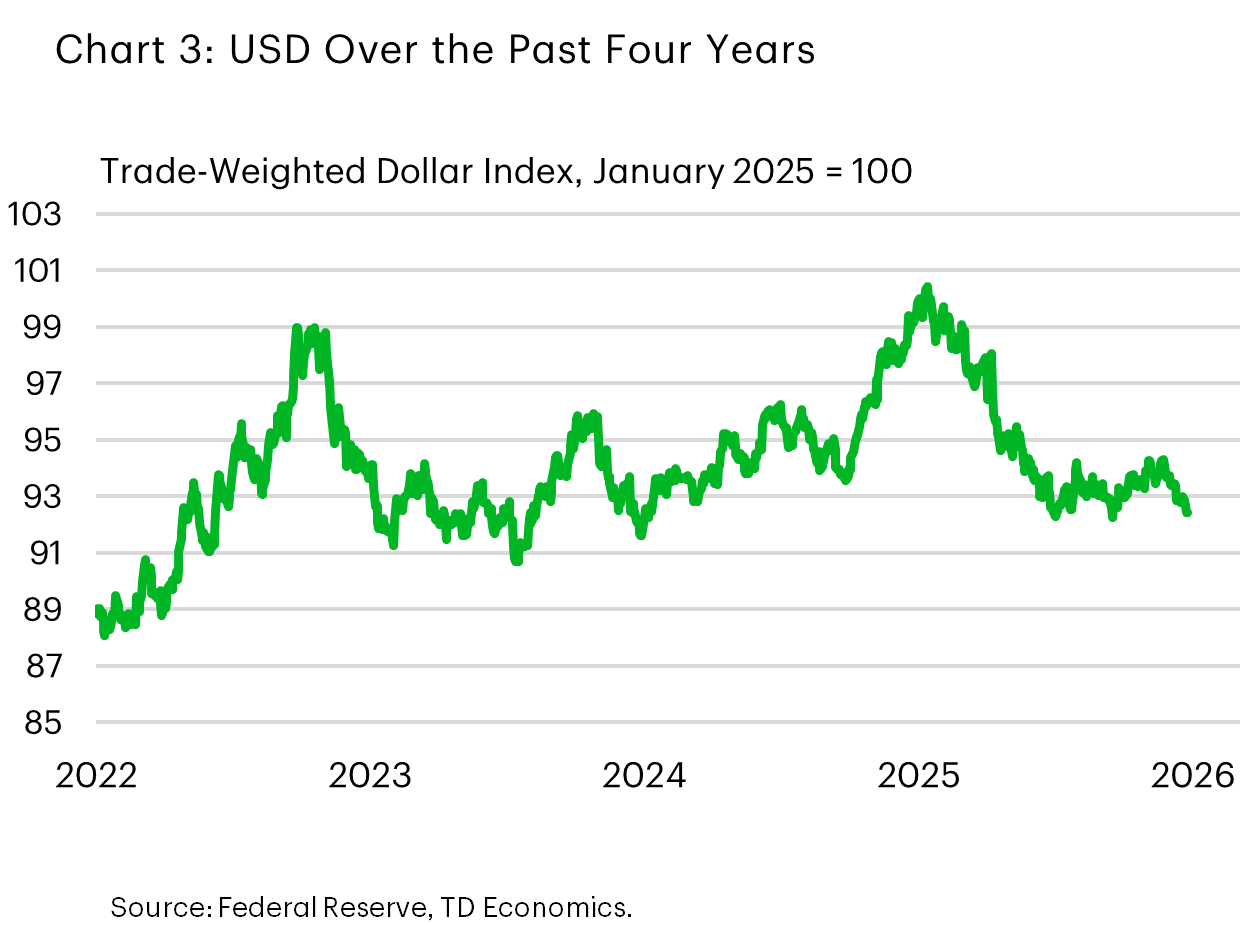
In broad trade‑weighted terms, the U.S. dollar fell roughly 8% in 2025, with a more notable ~10% decline against the majors (Chart 1). This marked an end to a fairly steady run of appreciation since the end of 2023.
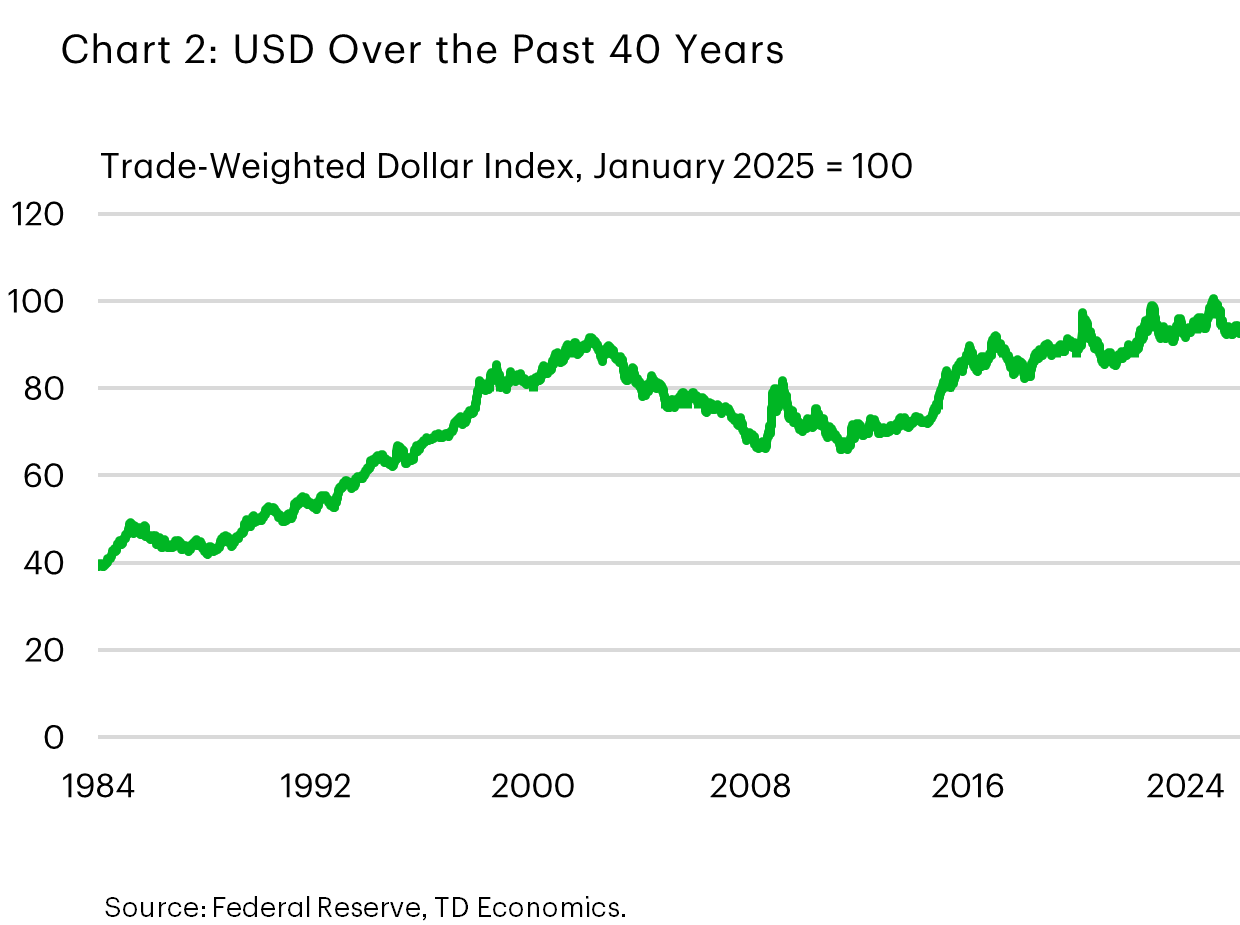
Still, for all the recent chatter around the greenback’s woes the currency is hardly plumbing the depths. Last year’s pull-back only took the USD back to its level prevailing in 2024 and close to its average level over the past decade. Taking an even longer perspective, the trade-weighted dollar continued to hold near its 3-decade high (Chart 2 & 3).
Factors conspiring against the dollar
Part of the perception is fueled by the delta between actual USD performance and the lofty expectations at the start of last year. Many forecasters had anticipated another step up in the dollar in 2025, under the assumption that U.S. import tariffs would be imposed, which in theory should be currency supportive. Moreover, many expected that U.S. growth exceptionalism since the pandemic would carry over into the first half of last year.
It didn’t take long for that thesis to unravel as 2025 got underway. Market attention quickly shifted to the potential negative impact tariffs would have on the U.S. expansion and hopes for Fed rate cuts. Although the rate relief was ultimately delayed until the autumn due to stubborn core inflation, investors never lost hope that U.S. central bank rate cuts would eventually materialize. And, indeed, as the Fed resumed monetary easing in the closing months of 2025, the extra yield offered by dollar-denominated assets relative to global assets narrowed.
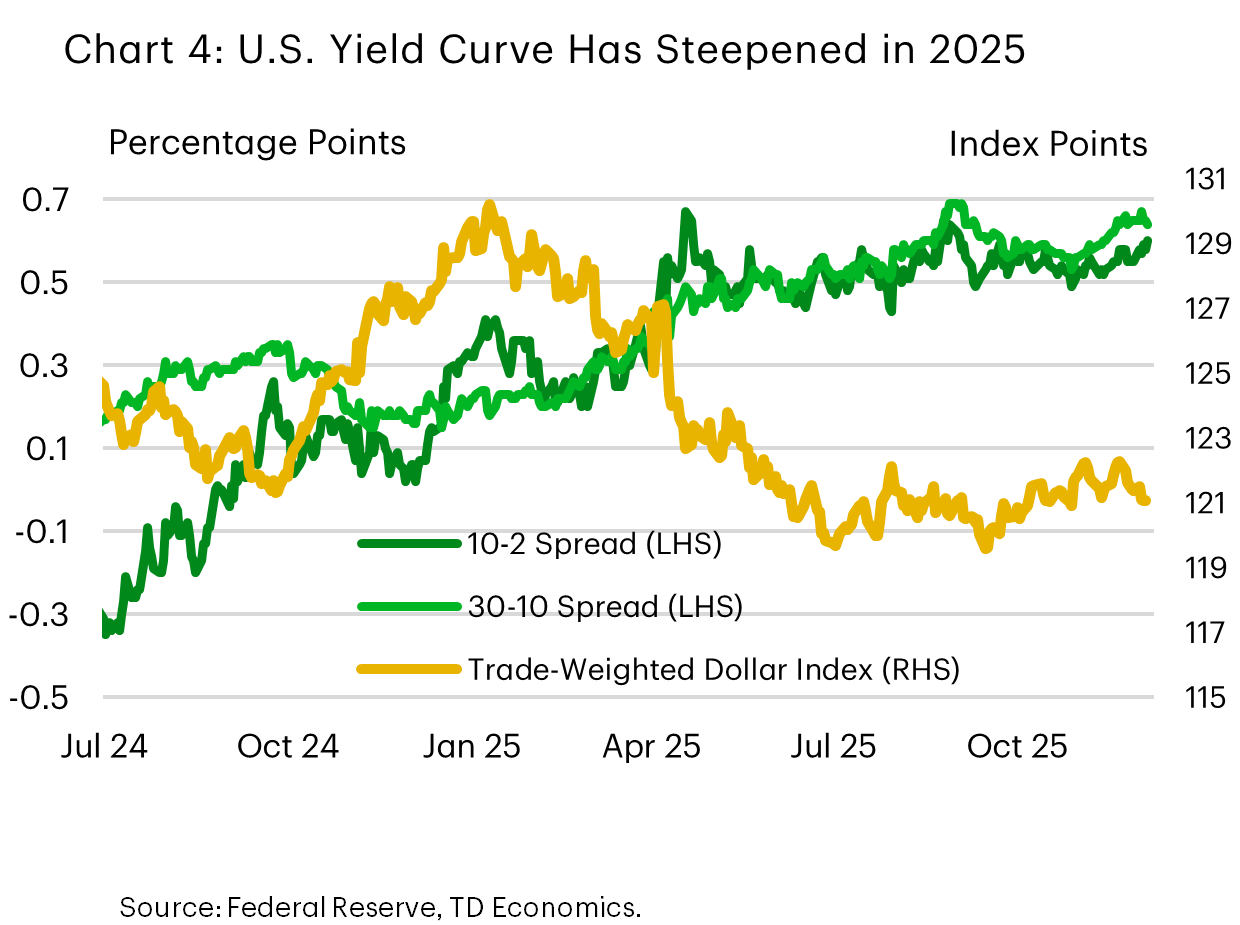
Technical factors also contributed to the bout of dollar weakness. Research from the Bank for International Settlements indicates that a decline in hedging costs between January and May spurred increased foreign currency hedging activity. This effect was particularly pronounced during Asian trading hours, placing incremental downward pressure on the dollar1. We suspect, as well, that the steepening yield curve through May 2025, as the United States Congress debated the One Big Beautiful Bill and its impact on the national debt – alongside discussion around Fed independence – contributed to a souring in sentiment towards the dollar. The depreciation coincided with the increased spreads witnessed on long-term U.S. Treasuries relative to short-term Treasuries (Chart 4).
Euro and pound record the strongest gains
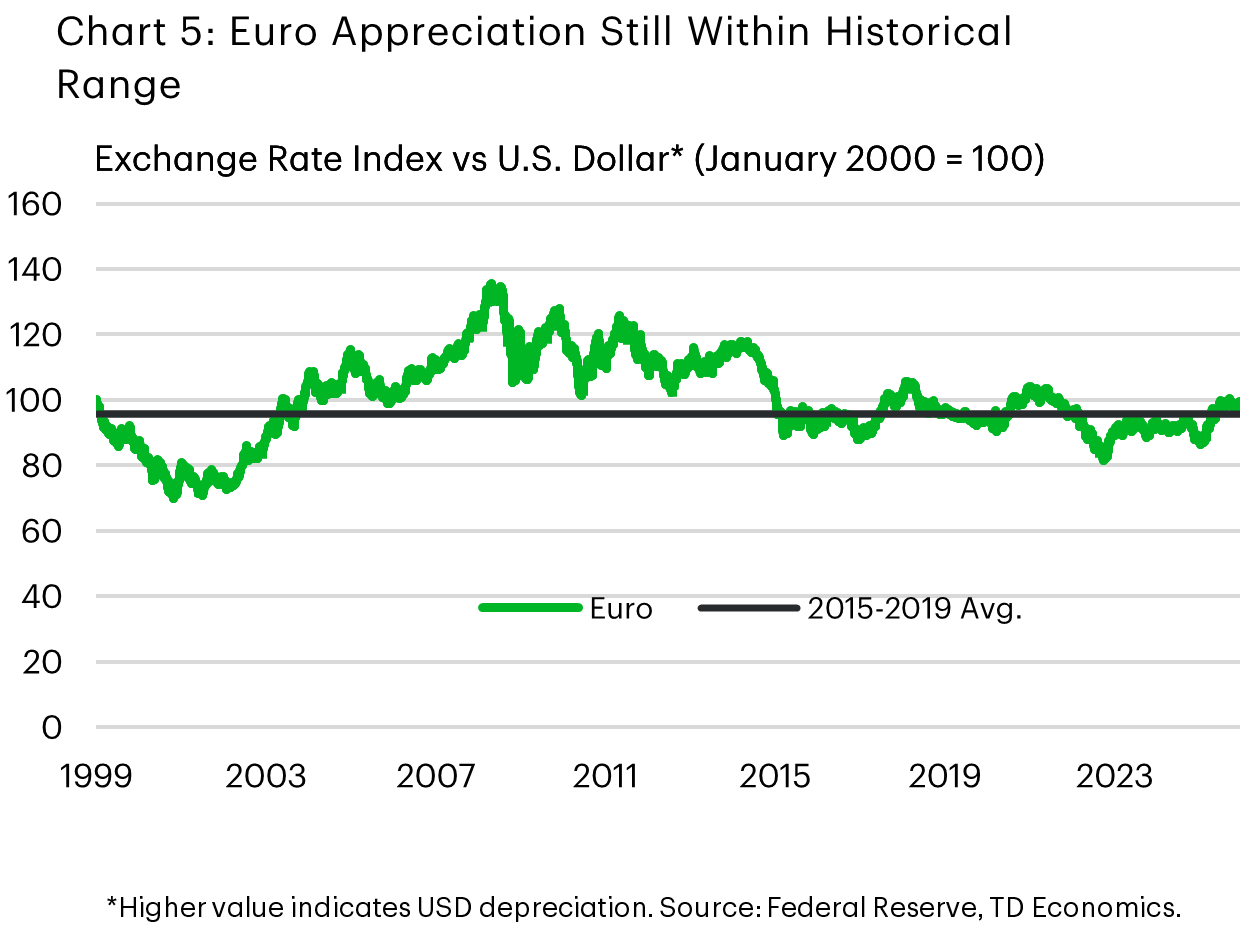
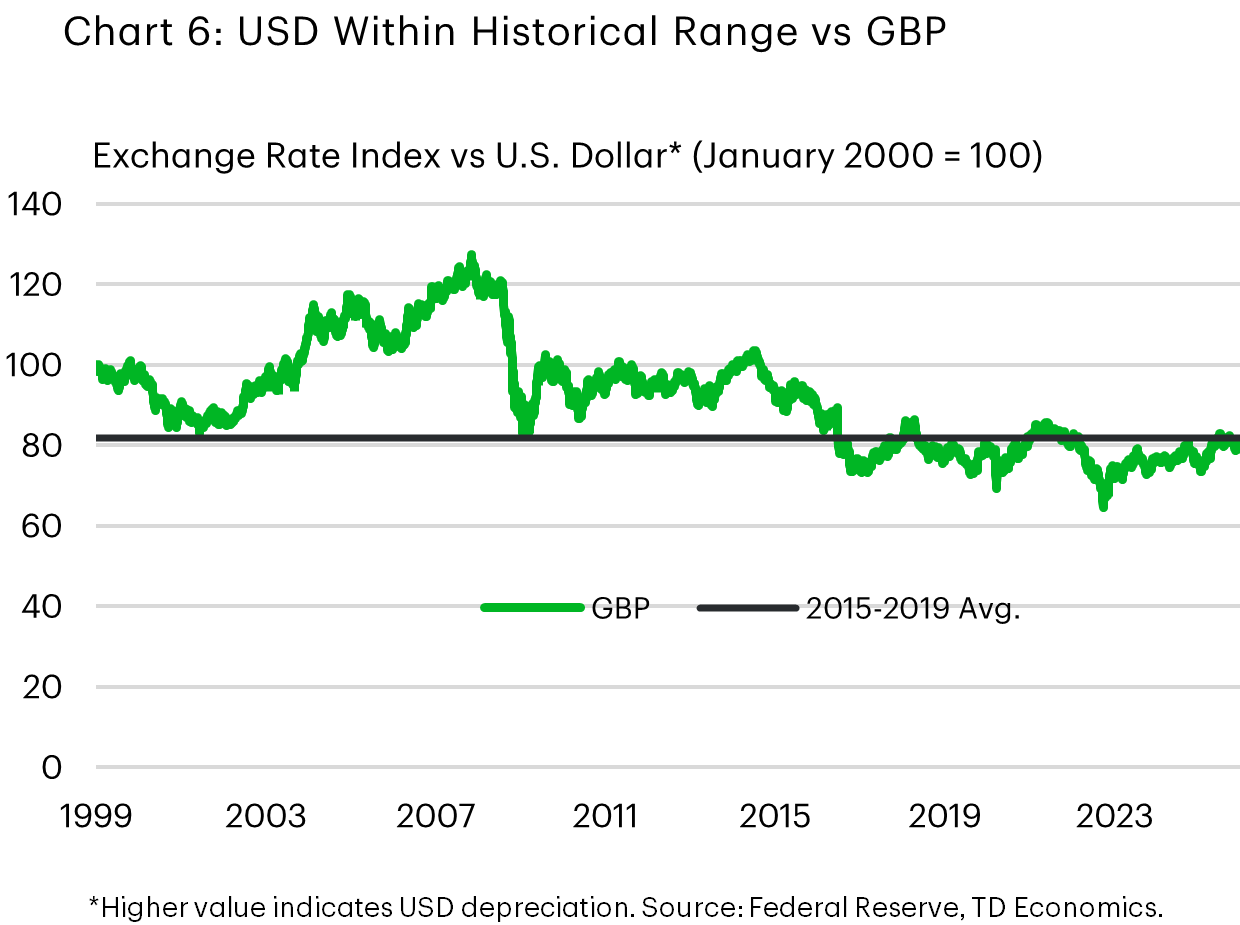
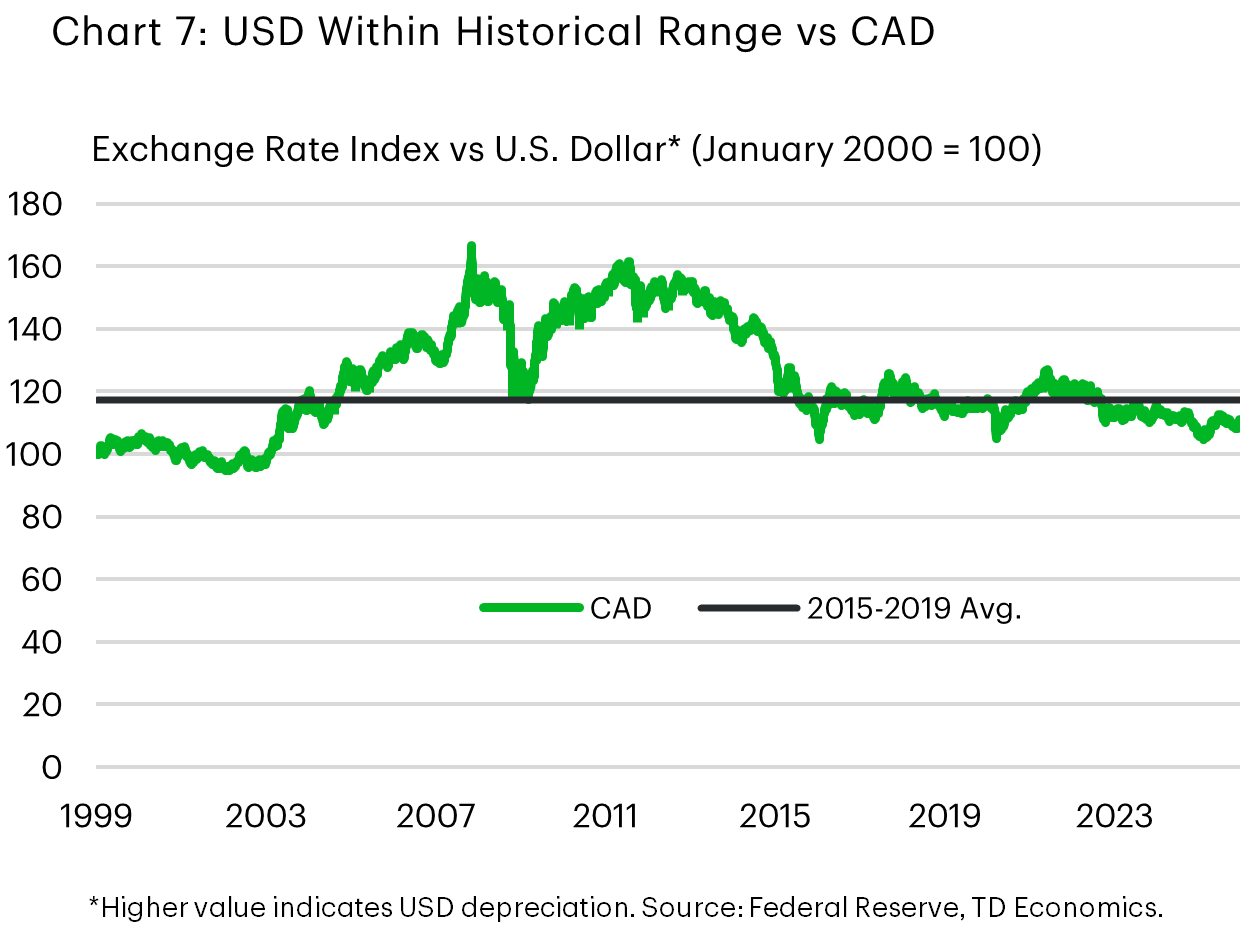
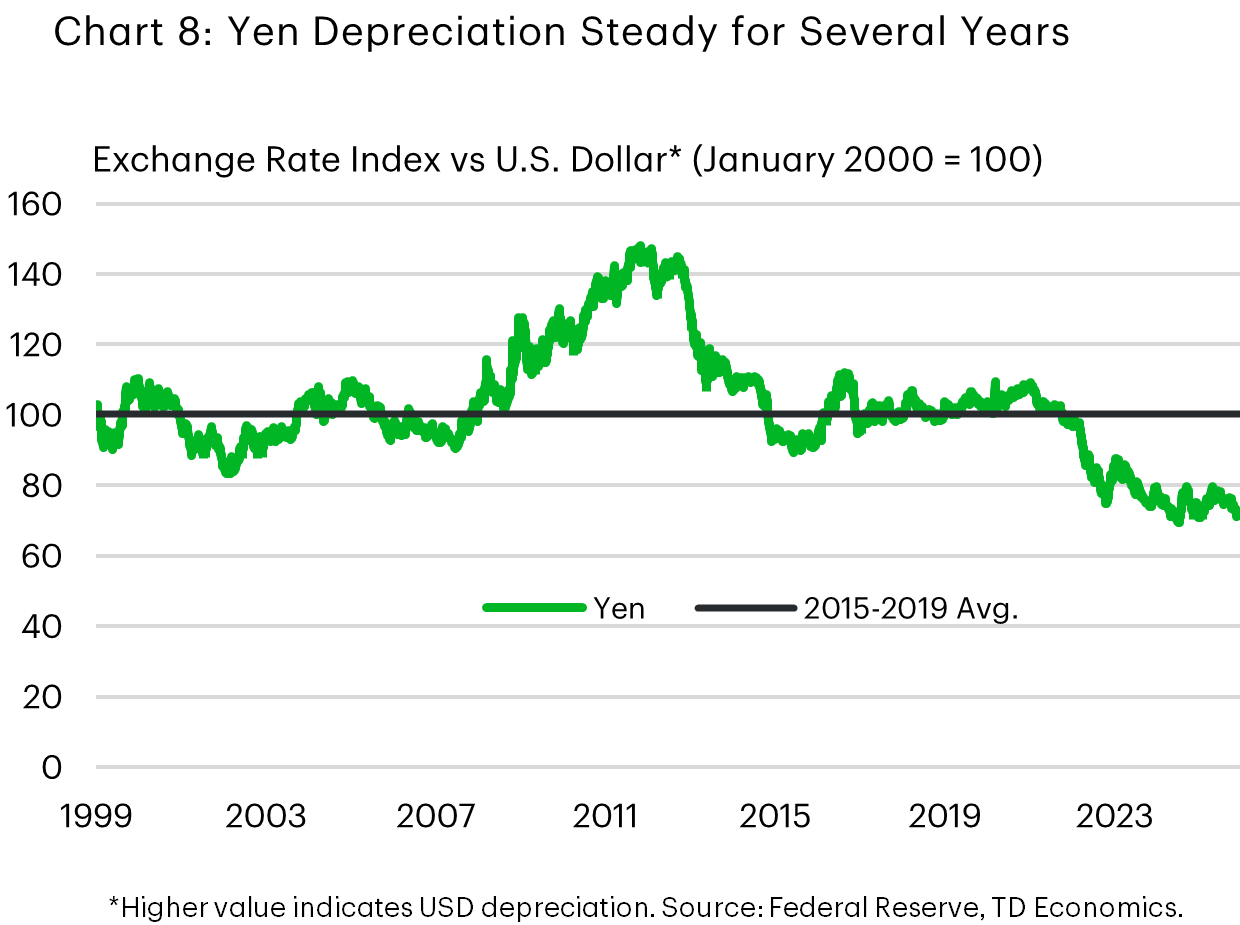
Taking a look under the hood, the U.S. dollar lost ground across board last year, led by a nearly 15% depreciation against the euro and a 9% depreciation against the pound sterling. Smaller 6-8% drops were recorded vis-à-vis the Canadian dollar and the Australian dollar, while the USD was roughly flat against the Japanese yen. The USD was not alone in depreciating against the euro, which reached an all-time high in trade-weighted terms in September, benefiting from perceptions that Europe’s fiscal and strategic shift would raise growth in the coming years.
Charts 5-8 show 2025-ending levels for the dollar against their major counterparts. Against the euro, the pound, and the Canadian dollar, the dollar now trades close to its 2015–2019 averages. Bucking the trend is the yen, which sits well below its pre-pandemic levels, hit by concerns around the direction of Japanese fiscal policy, and more recently, the pro-stimulus, expansionary policy bent of the new Prime Minister.
Further downside in store for 2026
We are not expecting a repeat of 2025 but do see scope for a further USD modest depreciation on the order of 3% in the year ahead. U.S. growth is likely to be a relatively neutral factor on the dollar, as the U.S. continues to outperform most other developed market currencies. However, the rate-differential story will likely translate into some downdraft in the greenback against the euro, CAD, and GBP. The other major central banks have largely concluded their easing cycles, but we see room for the Federal Reserve to lower interest rates this summer. While additional monetary easing is already priced into the market, we still see further selling pressure as the specter of the cuts draws nearer.
We see this modest appreciation shared across most of the majors. In Canada, a continued gradual easing in trade uncertainty is likely to support a 2-3% bounce in the Loonie to around the 0.74 CAD per USD level. A similar gain is expected in the euro (to around 1.20) predicated on promised fiscal expansions and defense spending commitments materializing. On the flip side, the yen appears oversold, and should start to the turn the corner, though a snap election set in Japan in the coming weeks and a period of heightened uncertainty about the direction of policy could keep it below 150 to a dollar for longer.
Based on our estimate, the trade-weighted USD is currently at a level not far off its fundamental value and consistent with our baseline macro outlook. Thus, a large move from the prevailing level would likely take the realization of major downside or upside surprise, such as a major geopolitical event, a more durable erosion of central bank independence than we have seen to date, or a significant change to the economic growth outlook.
What about “De-dollarization”?
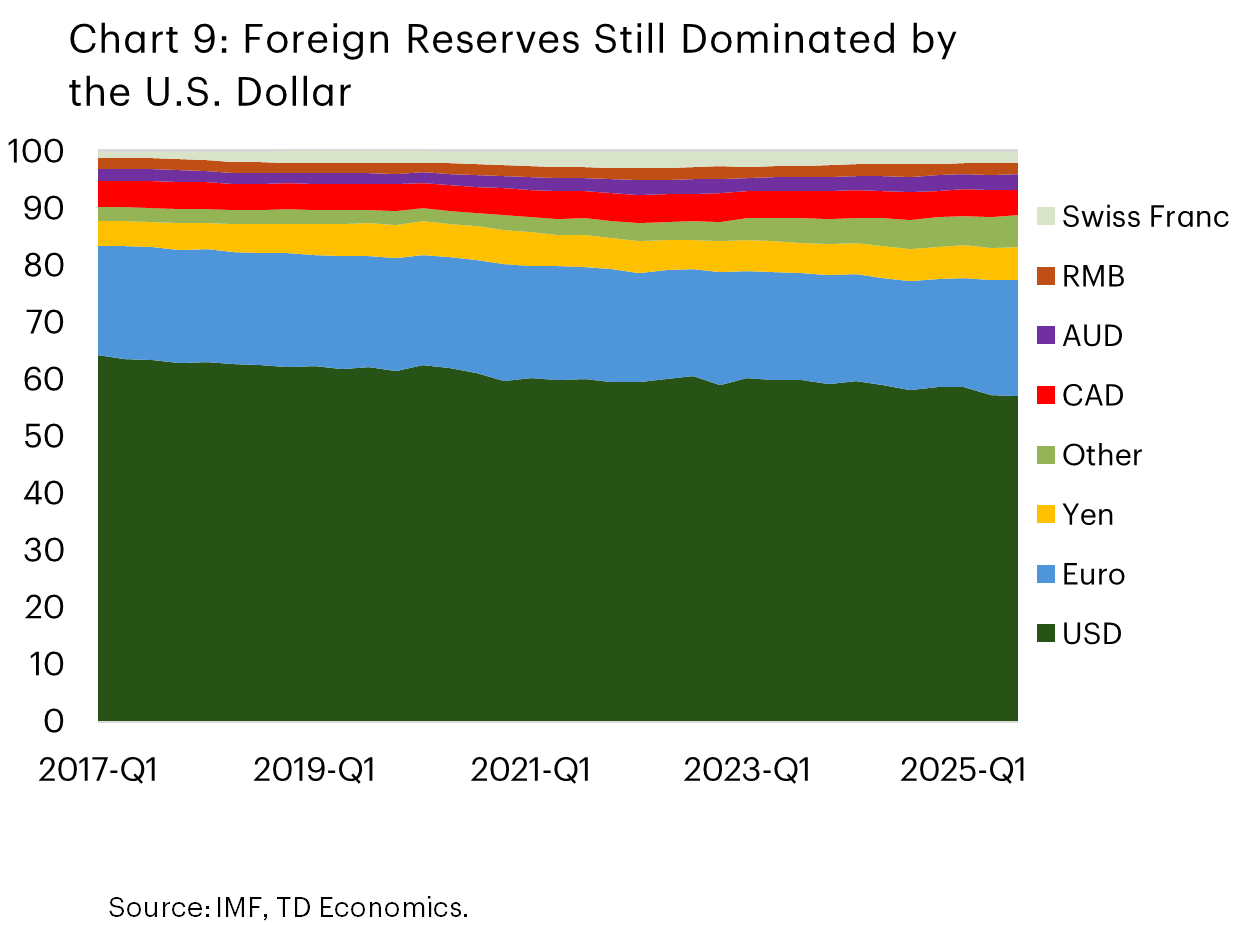
Turning back to the “de-dollarization” theme that has made lots of hay over the past year, the truth of the matter is that a gradual move away from the greenback has been ongoing for many years. For example, official foreign exchange reserves have been slowly, but steadily, trending away from the greenback (Chart 9). The small move down we see over 2025 in the USD share of official reserves is almost entirely attributable to the depreciation and not official sales of USD reserves2, which is to say that 2025 largely looks like another year on the same trend, rather than an abrupt shift in the status and perception of the dollar.
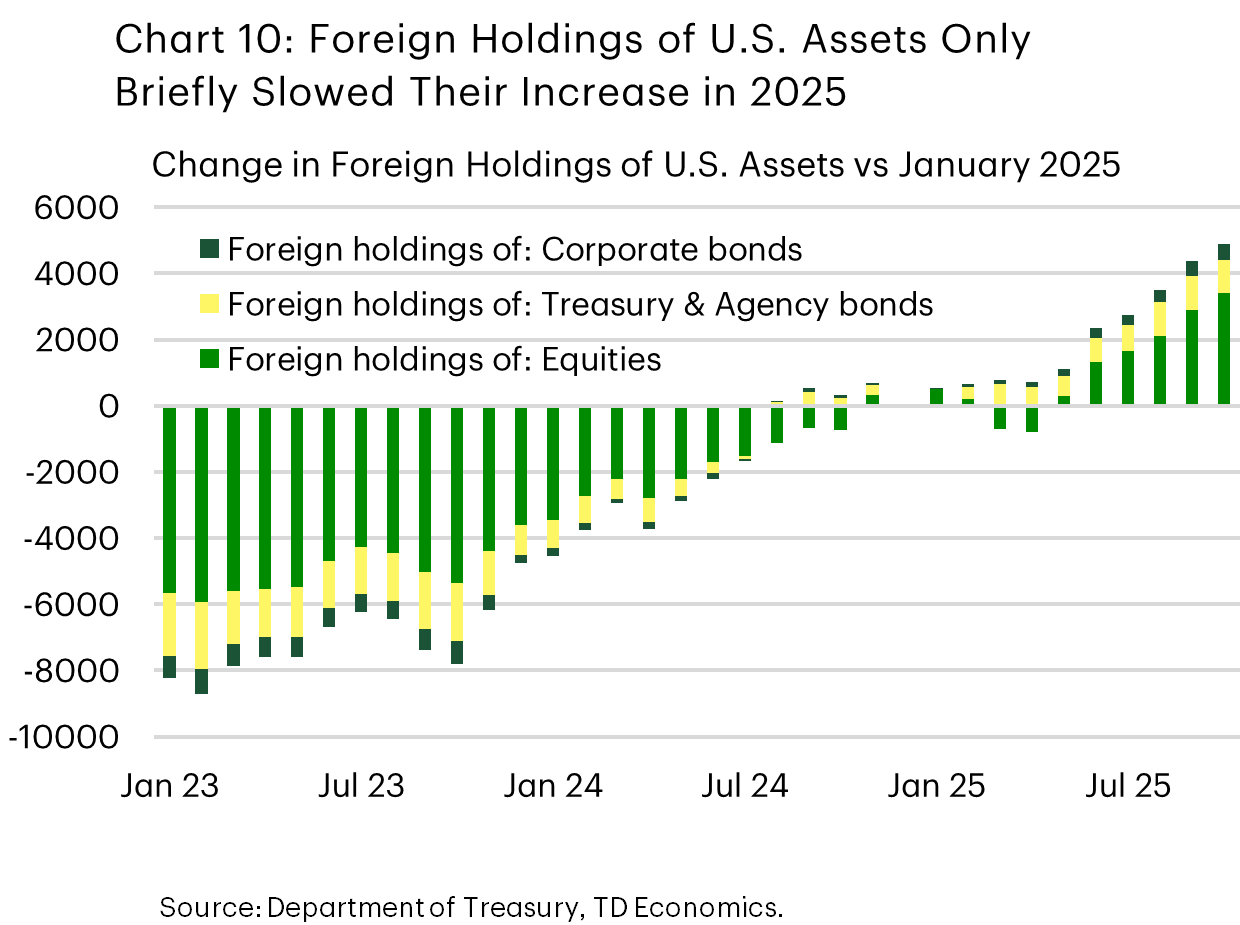
We also do not see a prolonged decrease in investor appetite for U.S.-dollar assets; in fact, foreign investors had a healthy appetite for US dollars in the second half of 2025. There was a brief pause in foreign investors’ accumulation of U.S. assets in early-2025 and outflows in April and May, and accumulation resumed thereafter (Chart 10). Undoubtedly, some of the factors we previously touched on were on the minds of investors – the expanding deficit, the uncertain impact of tariffs, and the change in the Federal Reserve’s stance all seemed to come together to briefly sour sentiment on the dollar in those months, but this was clearly temporary. The $US 4 trillion inflow into USD assets show in Chart 8 likely dwarfs the flows into alternative assets such as crypto and gold over 2025 – and stablecoin demand is actually positive for the USD in its current form, since most are backed by the USD. Gold had a banner year in 2025, but available data show that flows into gold-related funds were a small fraction of broader flows into USD assets, around $US 100 billion in 20253.
This underscores that there is no clear alternative to the U.S. dollar, even while there may be appetite for one. Competitors such as China have sought alternatives that would free it and the countries it has close economic ties with from reliance on the U.S. dollar and the associated constellation of financial architecture. It created the Cross-Border Interbank Payment System to build a cross-border payments network that settles transactions in yuan to further this end. While the growth in this system has been substantial, having seen participation by over 18 countries and exceeding US$50 billion in daily transactions, the RMB still only accounts for a low-single-digit share of global cross-border payments. Related initiatives underway elsewhere the world. The European Union, for example, is moving to adopt a digital euro, which would allow electronic retail payments to occur without the involvement of payment processors (primarily U.S. businesses), but this is not yet fully approved and remains years from being operational.
It is all but certain that many economies’ quests to reduce their reliance on the U.S. dollar will continue apace in the coming years, but completely displacing the USD as the global reserve currency and the central currency in international trade and finance is not realistically in the cards. Chart 11 shows how the closest competitors, in our view, lack the characteristics necessary to take on the role of a reserve asset. The U.S. dollar and U.S.-dollar denominated assets exist in far greater supply and have shown to provide more liquidity than the closest substitutes that exist today.

As it stands, there is little evidence that de-dollarization has accelerated. Flows into dollar-based assets have returned to trend, dollar use has been relatively stable, official reserves are mostly unchanged, and the world still lacks a convincing alternative. The U.S. dollar remains, by far, the most widely available, freely traded, and commonly accepted currency, in part because it has been issued by the world’s largest economy for nearly eighty years now. This is a privileged position that it cannot be dislodged from quickly.
Going forward, we expect that the international financial system will continue to become more multi-polar and less dominated by the dollar, as innovations in payments technologies continue, rivals further development of competing architecture to the existing dollar-based systems, and alternatives expand in size. But this gradual diversification away from the U.S. dollar globally still leaves the greenback in a leading position for some time to come.
Crypto Market Has Fallen Through the Ice
Market Overview
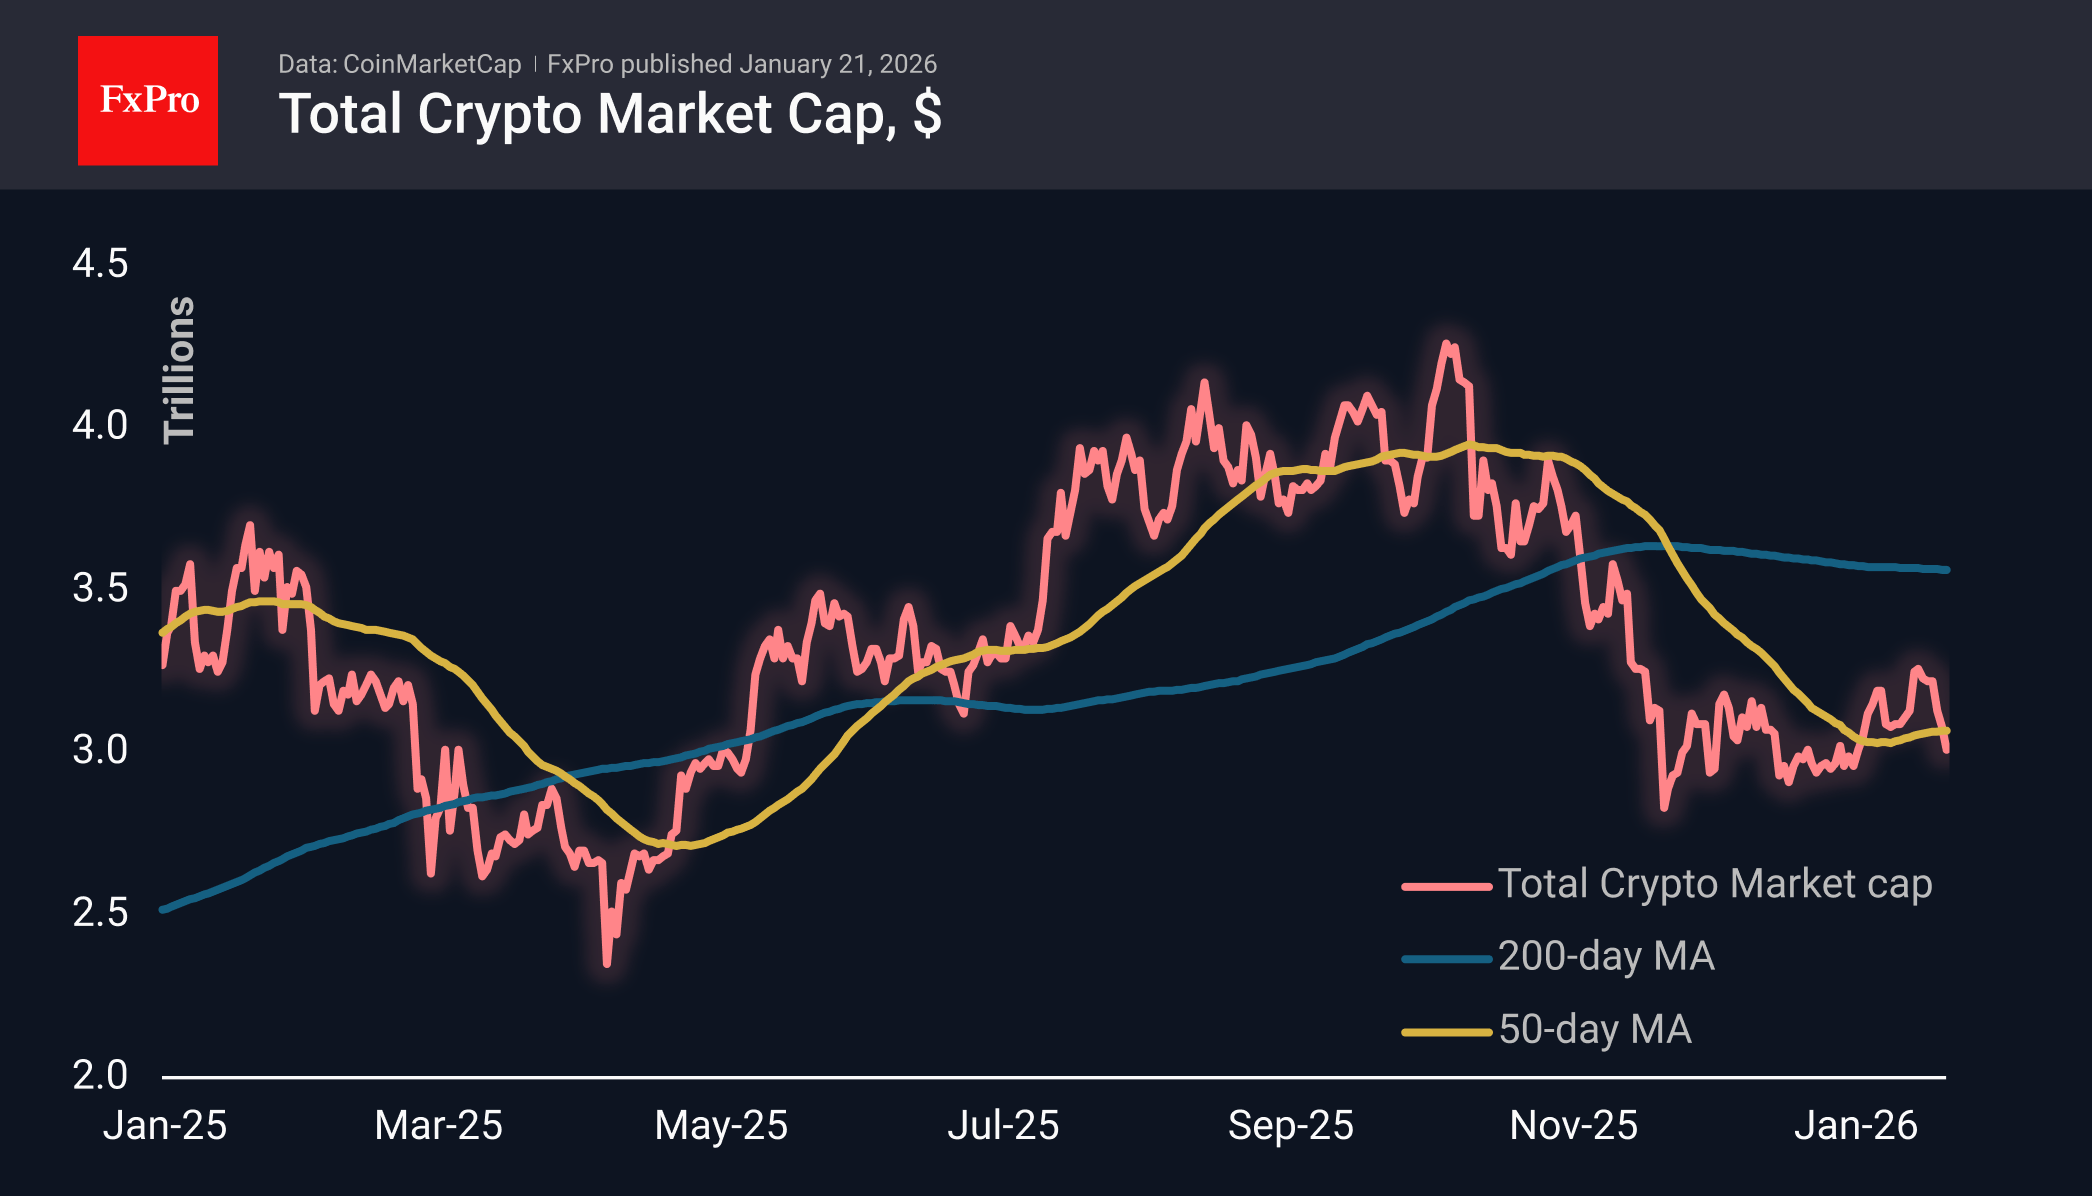
The crypto market capitalisation fell below $3T, slightly exceeding this round level at the start of active trading in Europe, but losing more than 2% in 24 hours. The market is once again below the 50-day moving average, and the growth momentum at the start of the year seems to have fallen through thin ice. The current situation contrasts with last year’s market behaviour, when we saw two dips below this trend line.
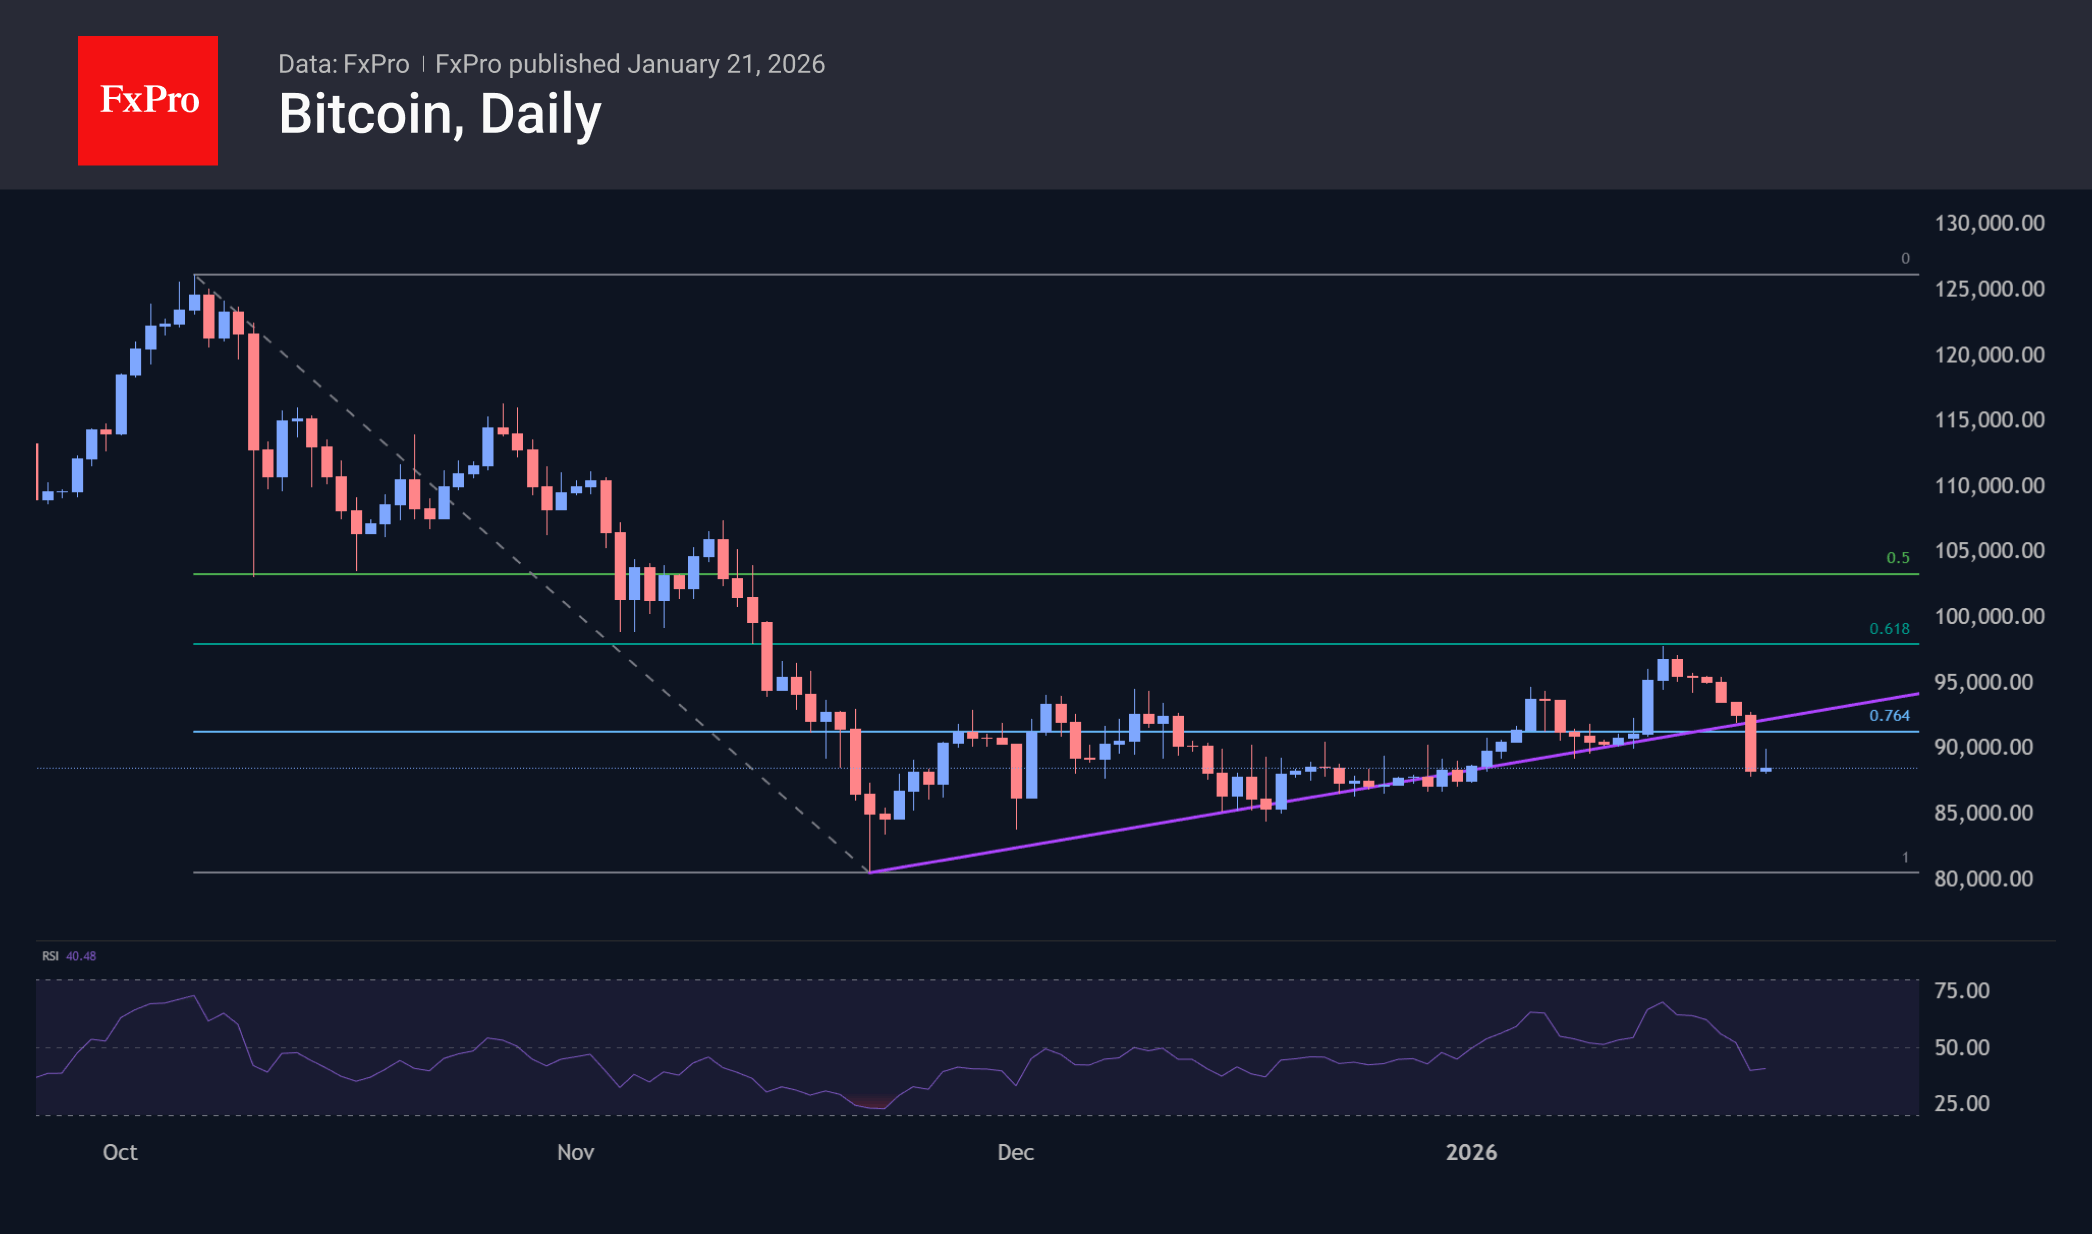
There is even more contrast between how Bitcoin is reacting to tariff threats now and in April. In April last year, Bitcoin rose alongside gold on the ‘sell America’ trade. Now, the first cryptocurrency looks even weaker than the stock market, as the S&P 500 has retreated from its high just over a week ago by only 3%. For comparison, BTC’s high was set more than three months ago and has since retreated by more than 30%.
The bearish picture is further underscored by the fact that the recovery rebound stalled at the classic 61.8% retracement of the autumn decline. At the same time, the pace of decline has increased significantly in recent days. In these conditions, it is worth being prepared for an imminent test of necessary medium-term support in the $80-84K range, where Bitcoin was bought in November and December.
News Background
Bitcoin could fall to the $58K- $62K range, predicts analyst Peter Brandt. According to him, attention has now shifted to this year’s opening levels around $87K as potential support.
Traders on the Deribit derivatives exchange estimate the probability of Bitcoin falling below $80K by the end of June at 30%. At the same time, the likelihood of growth above $120K by the exact date is only 19%.
Strategy has made another large purchase of Bitcoin. Between 12 and 18 January, the company bought 22,305 BTC ($2.12 billion) at an average price of $95,284 per coin. Strategy now owns 709,715 BTC, purchased for $53.9 billion at an average price of $75,979 per bitcoin.
Bitmine, the largest corporate holder of Ethereum, also added 35,268 ETH ($108 million) to its crypto reserves last week. The company’s reserves exceeded 4.2 million ETH.
Canadian billionaire Frank Giustra has questioned Bitcoin’s status as a safe-haven asset. In his opinion, the first cryptocurrency is much easier to confiscate than precious metals, which makes investing in digital assets risky.
Markets Take Davos in Stride, Trump Rules Out Force, Keeps Pressure on Greenland
Market reaction to US President Donald Trump’s highly anticipated speech at the World Economic Forum was relatively muted, suggesting investors had already priced in a confrontational tone. Greenland remained the central issue for market participants. Trump’s remarks offered partial relief, as he appeared to rule out military action to secure control of the island, addressing one of the market’s most immediate tail risks.
Trump explicitly said he would not use force, stating that while the U.S. could act with “excessive strength,” he had no intention of doing so. That clarification removed the most extreme scenario from the near-term outlook and helped cap further risk escalation.
However, the relief was narrow. Trump continued to press firmly for U.S. control of Greenland, repeatedly framing the issue as one of strategic necessity, not negotiation posture. He argued that ownership—not leasing or basing rights—is essential for defense, saying the U.S. cannot protect Greenland under a lease arrangement. He framed the island as a future strategic battleground, emphasizing missile trajectories and North Atlantic security.
He also launched a pointed critique of Denmark, arguing it lacks the capacity to secure Greenland and asserting that the island is effectively part of North America. Trump said no country other than the U.S. could guarantee Greenland’s security. Crucially, Trump reiterated his intent to pursue immediate negotiations over acquisition, keeping geopolitical uncertainty firmly alive. While the threat of force was dialed back, the broader standoff with Europe remains unresolved.
Markets reflected this mixed message. U.S. equity indexes opened mildly higher, suggesting relief that rhetoric did not escalate further. Meanwhile, the 10-year Treasury yield eased back toward 4.28%, stabilizing after recent volatility. Yet beneath the surface, stress signals persist. Gold remains firm above 4,800, hovering just below the 5,000 psychological level. The inability of gold to correct meaningfully despite calmer headlines points to underlying distrust and hedging demand.
In FX markets, Dollar remains at the bottom of the weekly performance table, followed by Yen and Sterling. Kiwi Leads, with Swiss Franc and Aussie close behind, while Euro and Loonie sit mid-pack—consistent with a market that is calmer, but far from comfortable.
In Europe, at the time of writing, FTSE is up 0.19%. DAX is down -0.64%. CAC is up 0.18%. UK 10-year yield is down -0.006 at 4.456. Germany 10-year yield is up 0.015 at 2.876. Earlier in Asia, Nikkei fell -0.41%. Hong Kong HSI rose 0.37%. China Shanghai SSE rose 0.08%. Singapore Strait Times fell -0.38%. Japan 10-year JGB yield fell -0.056 to 2.288.
SNB Schlegel sees no issue with negative inflation prints if temporary
The SNB is not alarmed by recent soft inflation data, according to Chairman Martin Schlegel. He said inflation is expected to pick up, but the SNB is prepared to tolerate temporary negative readings, provided medium-term price stability remains intact.
"If we have some negative prints this year, for example, this is not a problem with the Swiss National Bank, because we look at the medium-term price stability," he added.
He also pointed to recent global political turbulence as a driver of Swiss Franc appreciation, reflecting its traditional safe-haven role. On reserve management, Schlegel declined to comment directly on whether the exchange-rate move would lead to changes in Dollar holdings, but reiterated the SNB’s commitment to diversification across currencies and asset classes, noting the bank continuously reviews its "investment universe" and stands ready to act if needed.
ECB's Lagarde: Tariffs manageable, Trump's constant reversals more damaging
ECB President Christine Lagarde said she expects only a "minimal" inflationary impact from additional U.S. tariffs, arguing that Eurozone price pressures remain firmly under control. Speaking to RTL, Lagarde noted that inflation is currently around 1.9%, leaving little scope for tariffs to materially disrupt the ECB’s inflation outlook.
Though, she acknowledged that the impact would not be evenly distributed, with Germany likely more exposed than France given its export-heavy manufacturing base. However, Lagarde argued that Europe would be far more resilient if it focused on removing non-tariff trade barriers within the EU, strengthening internal trade and competitiveness rather than reacting defensively to external shocks.
Lagarde’s sharper warning was reserved for uncertainty, not tariffs themselves. Referring to renewed threats from US President Donald Trump, who has vowed to impose escalating tariffs on several European countries over Greenland, she said the "constant reversals" and unpredictability pose a more serious risk. Trump, she added, often takes a transactional approach, setting demands at “sometimes completely unrealistic” levels.
UK CPI rises to 3.4%, core holds at cycle low of 3.2%
UK inflation firmed at the end of 2025, with headline pressure coming in slightly hotter than expected. CPI rose to 3.4% yoy in December, up from 3.2% and above expectations of 3.3%, while prices increased 0.4% mom, pointing to ongoing near-term inflation momentum.
The upside in headline inflation, however, masked relative stability in underlying pressures. Core CPI—excluding energy, food, alcohol and tobacco—was unchanged at 3.2% yoy, undershooting expectations of 3.3%, and marking the joint-lowest reading since December 2024. Core inflation was last lower in September 2021, reinforcing the view that underlying disinflation progress, while slow, remains intact.
By component, services inflation edged up to 4.5% yoy from 4.4%, keeping the sector firmly in focus for the BoE, while goods inflation rose to 2.2% from 2.1%.
AUD/USD Mid-Day Report
Daily Pivots: (S1) 0.6713; (P) 0.6730; (R1) 0.6753; More...
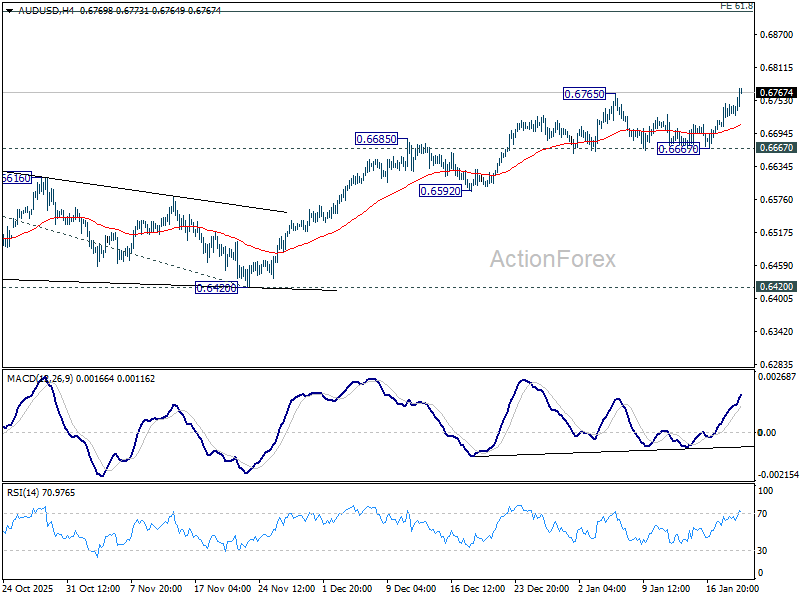
AUD/USD's rally from 0.5913 resumed by breaking through 0.6765 resistance today. Intraday bias is back on the upside. Further rise should be seen to 61.8% projection of 0.5913 to 0.6706 from 0.6420 at 0.6910 next. For now, near term outlook will stay bullish as long as 0.6667 support holds, in case of retreat.
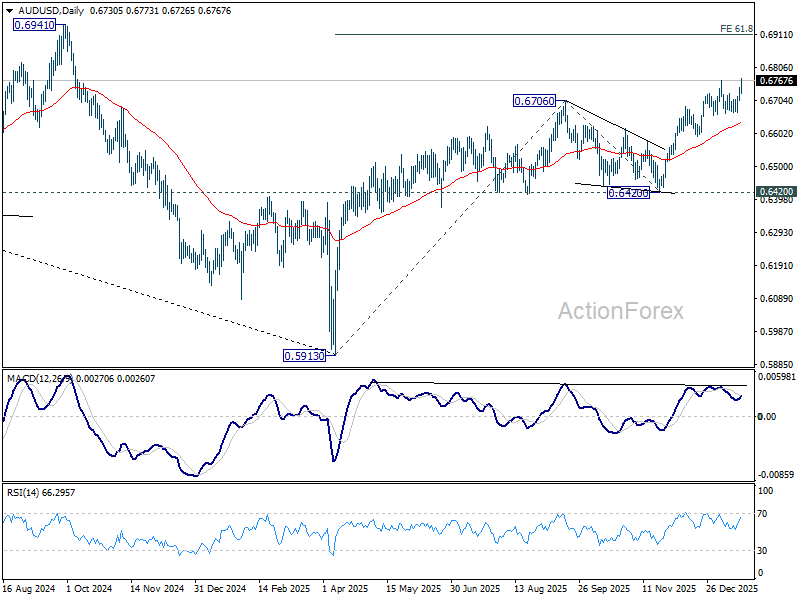
In the bigger picture, current development argues that rise from 0.5913 (2024 low) is reversing whole down trend from 0.8006 (2021 high). Further rally should be seen to 61.8% retracement of 0.8006 to 0.5913 at 0.7206. This will remain the favored case as long as 0.6420 support holds, even in case of deep pullback.
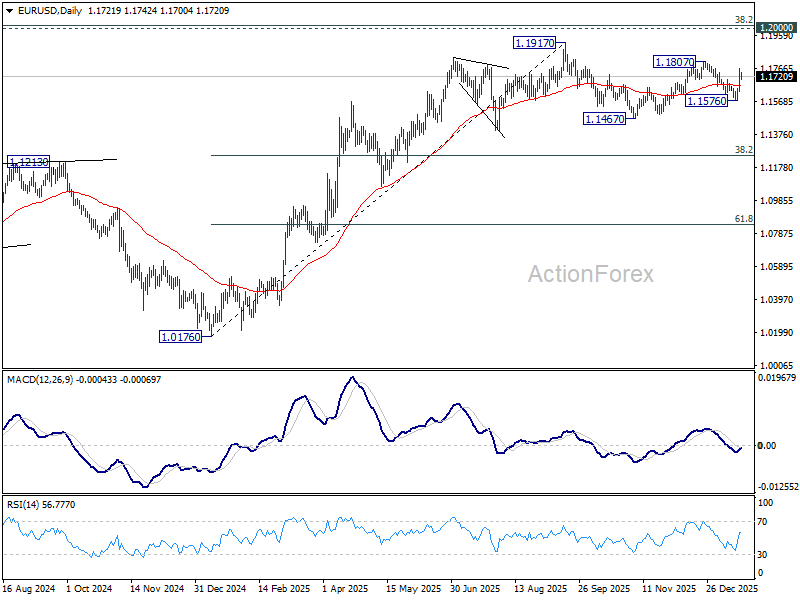
EUR/USD Mid-Day Outlook
Daily Pivots: (S1) 1.1649; (P) 1.1709; (R1) 1.1785; More….
Intraday bias in EUR/USD stays on the upside for 1.1807 resistance. Firm break there will resume whole rally from 1.1467, and target a retest on 1.1917 key resistance level. For now, risk will stay on the upside as long as 55 4H EMA (now at 1.1670) holds, in case of retreat.
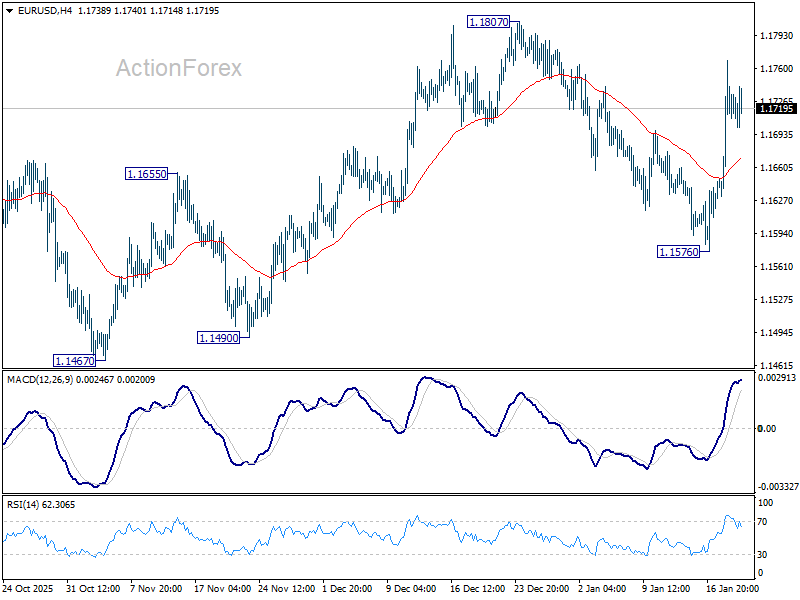
In the bigger picture, as long as 55 W EMA (now at 1.1413) holds, up trend from 0.9534 (2022 low) is still in favor to continue. Decisive break of 1.2 key psychological level will carry larger bullish implication. However, sustained trading below 55 W EMA will argue that rise from 0.9534 has completed as a three wave corrective bounce, and keep long term outlook bearish.
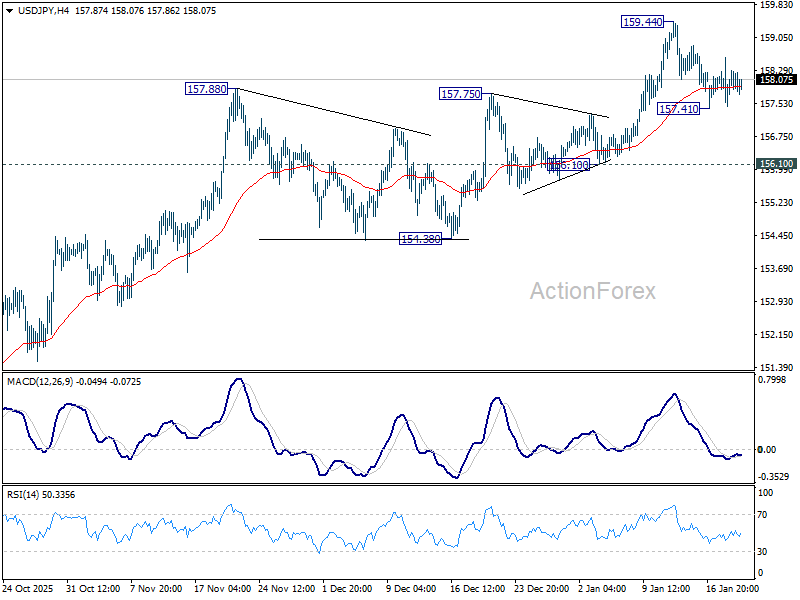
USD/JPY Mid-Day Outlook
Daily Pivots: (S1) 157.55; (P) 158.07; (R1) 158.68; More...
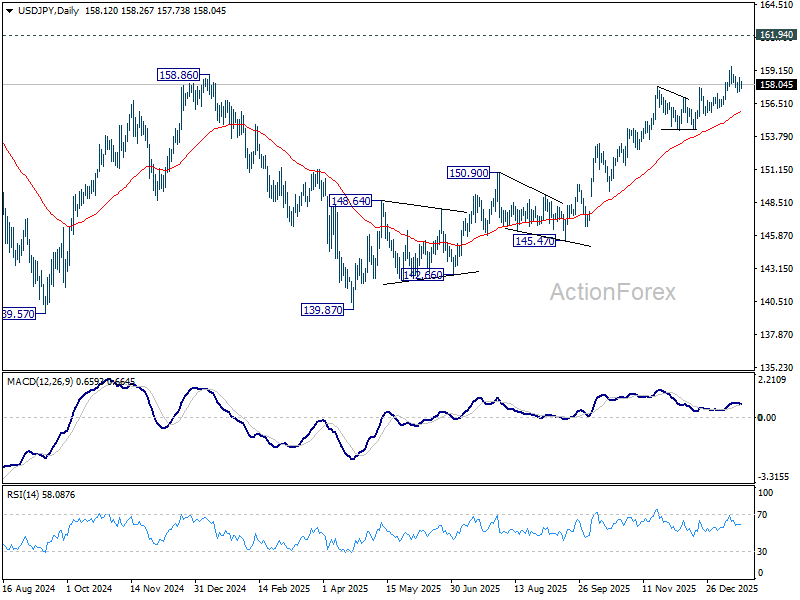
USD/JPY is extending consolidations below 159.44 and intraday bias remains neutral at this point. With 156.10 support intact, outlook remains bullish. On the upside, break of 159.44 will resume the rise from 139.87 towards 161.94 high. However, firm break of 156.10 will confirm short term topping, and turn bias back to the downside for deeper pullback.
In the bigger picture, corrective pattern from 161.94 (2024 high) should have completed with three waves at 139.87. Larger up trend from 102.58 (2021 low) could be ready to resume through 161.94. Decisive break of 158.86 structural resistance will solidify this bullish case and target 161.94 for confirmation. On the downside, break of 154.38 support will dampen this bullish view and extend the corrective range pattern with another falling leg.
GBP/USD Mid-Day Outlook
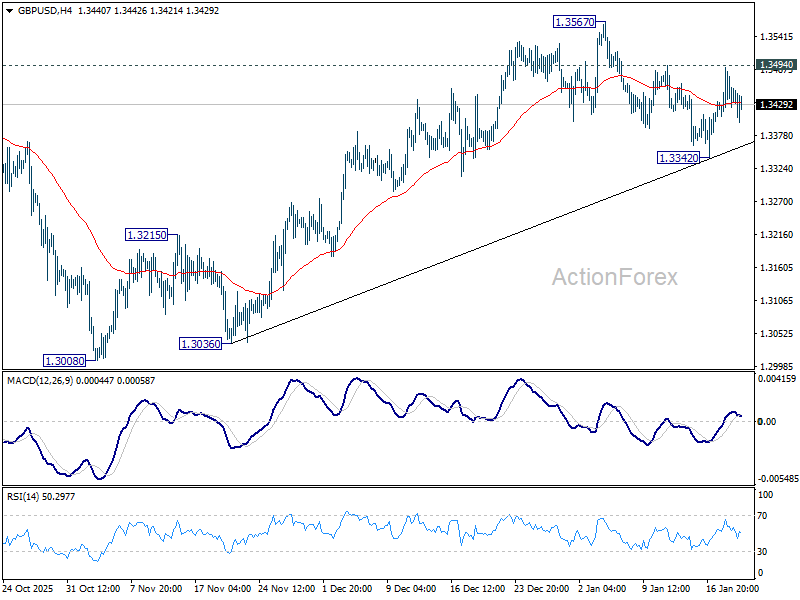
Daily Pivots: (S1) 1.3398; (P) 1.3445; (R1) 1.3488; More...
Intraday bias in GBP/USD remains neutral for the moment. On the upside, firm break of 1.3494 will suggest that pullback from 1.3567 has completed at 1.3342, after drawing support from 55 D EMA (now at 1.3379). Intraday bias will be back on the upside for 1.3567 first. Break there will resume the rally from 1.3008 to retest 1.3787 high. On the downside, sustained trading below 55 D EMA will argue that the decline is another falling leg in the corrective pattern from 1.3787.
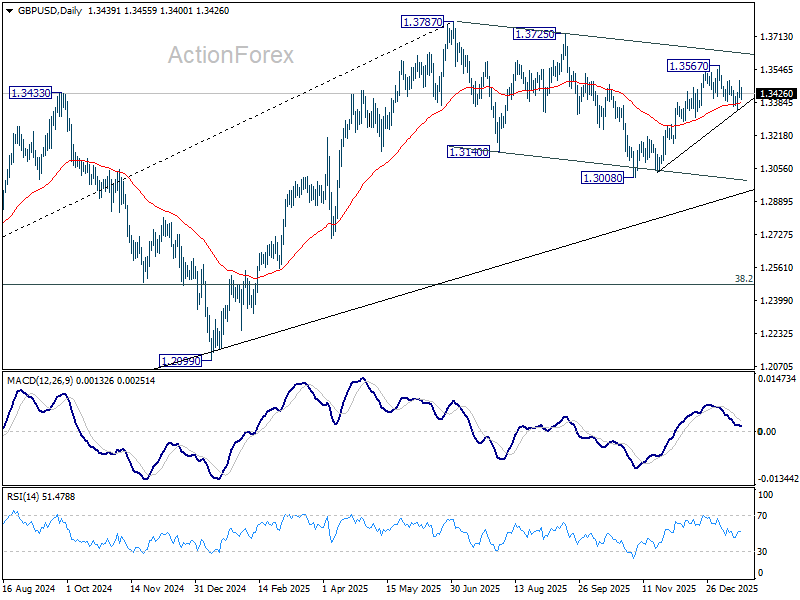
In the bigger picture, price actions from 1.3787 (2025 high) are seen as a correction to the larger up trend from 1.3051 (2022 low). Deeper decline could be seen as the pattern extends, but downside should be contained by 38.2% retracement of 1.0351 to 1.3787 at 1.2474 to bring rebound. Break of 1.3787 for up trend resumption is expected at a later stage.
USD/CHF Mid-Day Outlook
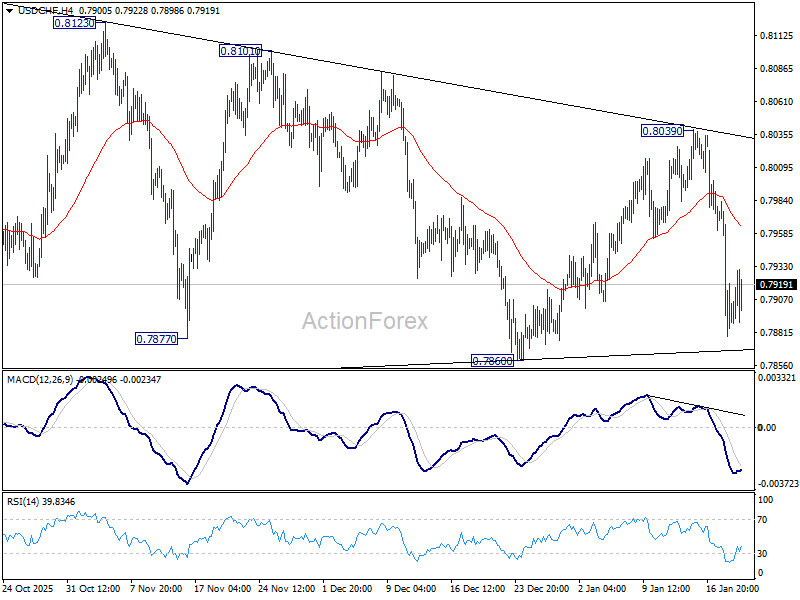
Daily Pivots: (S1) 0.7858; (P) 0.7921; (R1) 0.964; More….
Intraday bias in USD/CHF remains mildly on the downside at this point. Firm break of 0.7860 support will argue that larger down trend is ready to resume through 0.7828 low. Next target will be 0.7382 projection level. For now, risk will stay on the downside as long as 55 4H EMA (now at 0.7963) holds, in case of recovery.
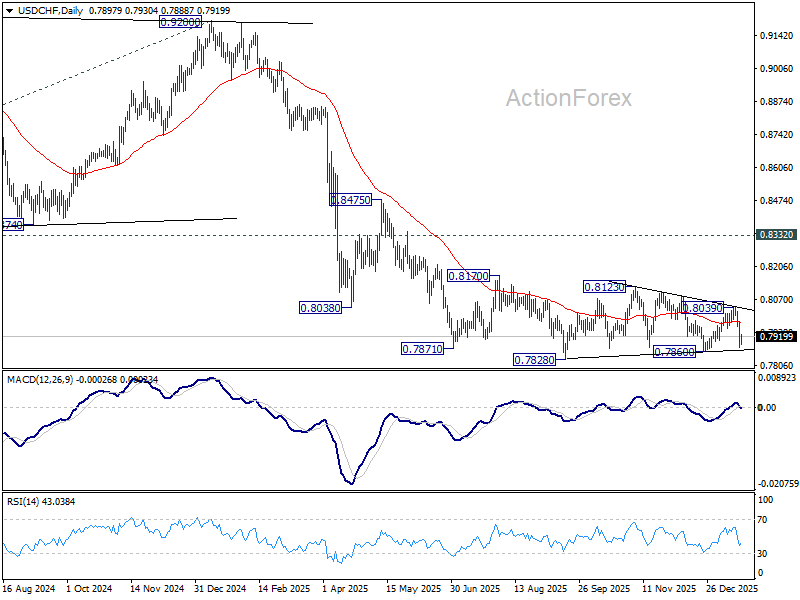
In the bigger picture, price actions from 0.7828 are seen as a correction. Larger down trend from 1.0342 (2017 high) is still in progress. Break of 0.7828 will target 100% projection of 1.0146 (2022 high) to 0.8332 from 0.9200 at 0.7382. In any case, outlook will stay bearish as long as 0.8332 support turned resistance holds (2023 low).
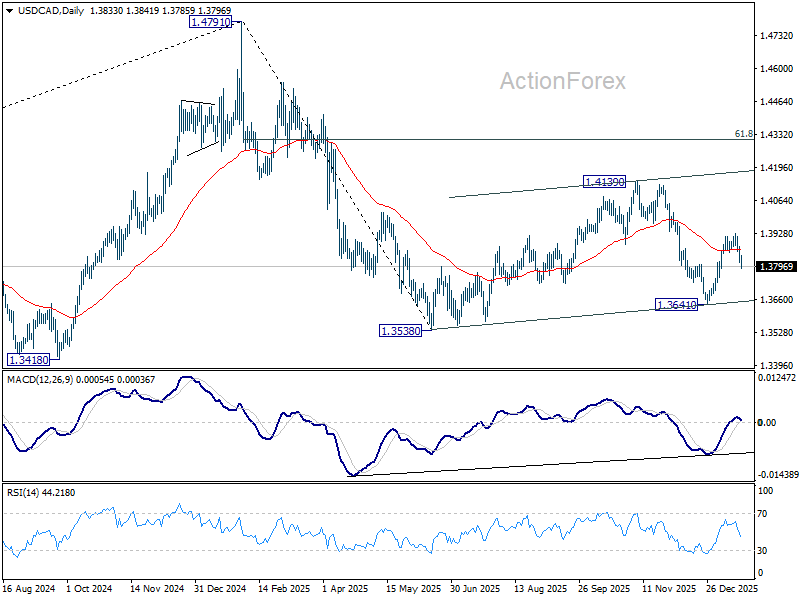
USD/CAD Mid-Day Outlook
Daily Pivots: (S1) 1.3808; (P) 1.3844; (R1) 1.3873; More...
Immediate focus in on 1.3789 support as USD/CAD's fall from 1.3927 accelerates lower. Firm break there will argue that rebound from 1.3641 has completed. Deeper decline should be seen back to 1.3538/3641 support zone. ON the upside, above 1.3927 will resume the rebound towards 1.4139 resistance. Overall price actions from 1.3538 are seen as a consolidation to the fall from 1.4791, and might still extend.
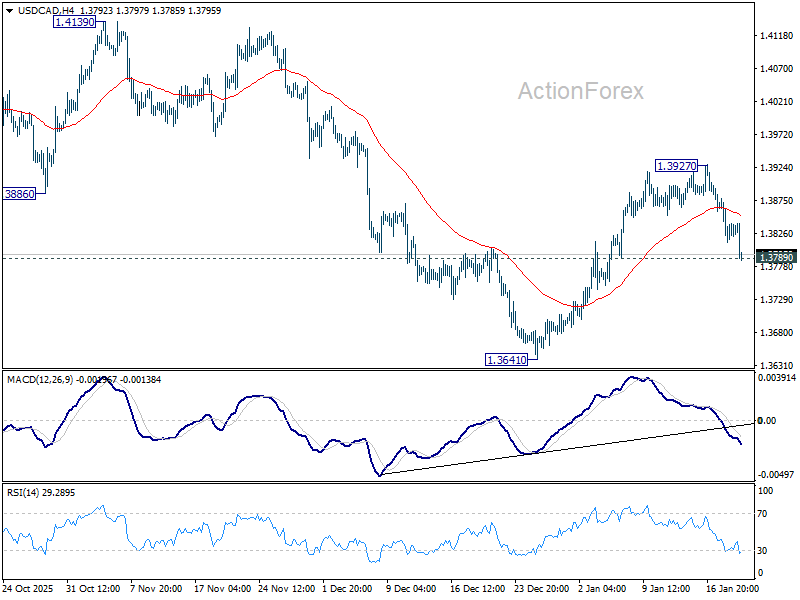
In the bigger picture, price actions from 1.4791 are seen as a corrective pattern to the whole up trend from 1.2005 (2021 low). Deeper fall could be seen as the pattern extends, and break of 1.3538 will target 61.8% retracement of 1.2005 to 1.4791 at 1.3069. For now, medium term outlook will be neutral until there are signs that the correction has completed.