Sample Category Title
Australian Retail Sales Post Surprise Bounce
July sales: +1.3%mth (market +0.3%), 16.5%yr. Rate hikes, sentiment slump yet to impact.
The ABS preliminary estimates of official retail sales showed a much stronger than expected 1.3% gain in July. That compares to a subdued 0.2% rise in June and marks the strongest monthly gain since March. The consensus forecast was for a 0.3% rise. The detail shows a broad-based lift with nothing to suggest the monthly gain is a ‘rogue’. That said, rising retail prices undoubtedly account for a sizeable part of the rise, with volumes likely to have been somewhat flatter.
Recall that the ABS retail release now comes in two stages: an early preliminary release with limited detail; and a final estimate that may see some revisions and provides the full range of additional detail.
The limited detail available for July shows a strong rebound for department stores (+3.8%mth, reversing a similar-sized decline in June), and a strong gain for clothing & footwear (+3.3%mth), with robust rises for cafes & restaurants (+1.8%mth), ‘other retail’ (+1.6%mth) and basic food (+1.2%mth). The only soft spot was around household goods which saw a second consecutive monthly decline, down 1.1%mth. That weakness may be a sign that housing-related and big ticket durables spend is contracting but the rest of the detail suggests this is being more than offset by strong gains in both ‘small ticket’ discretionary categories and essentials.
By state, retailers reported strong rebounds in Vic (+1.8%mth) NSW (+1.3%mth), and SA (+1.2%mth), which were all coming off poor June months. WA also recorded a robust 1.6%mth gain. Qld was on the softer side with a 0.4%mth rise but had bucked the wider trend in June, posting a 0.7% gain.
Overall, the July update suggests initial rate rises have done little to slow the consumer. We still expect the RBA’s tightening and slumping consumer sentiment to eventually weigh on demand but that may not come until late in Q3.
FOMC Chair Powell Gives a Decisive But Conditional Commitment
Chair Powell's remarks at Jackson Hole 2022 were brief but to the point.
At the Jackson Hole Symposium of 2022, FOMC Chair Powell was clear on the Committee’s resolve to bring inflation to heel and their purpose in doing so – it being necessary to safe-guard the long-term welfare of the US economy.
In fact, the key opening remarks referred to his “overarching focus right now” being to “bring inflation back down to our 2 percent goal”. The clear objective of that statement is to send a strong message that the FOMC is fully committed to restoring inflation to target and containing inflationary expectations.
On the timing of further hikes, “[r]estoring price stability will take some time and requires using our tools forcefully” speaks to a need for rapid policy tightening; and “[w]e will keep at it until we are confident the job is done” implies the Committee do not intend to pause mid-way through this cycle.
Elsewhere in Chair Powell’s speech, justification for charting this course is found. Quoting Chairman Paul Volcker from 1979, "Inflation feeds in part on itself, so part of the job of returning to a more stable and more productive economy must be to break the grip of inflationary expectations". Further, in Chair Powell’s own words, “[h]istory shows that the employment costs of bringing down inflation are likely to increase with delay”. Finally, “[r]estoring price stability will likely require maintaining a restrictive policy stance for some time” emphasises the Committee plan to hold the fed funds rate at its peak level for an extended period, with reducing inflation “likely to require a sustained period of below-trend growth”.
However, the number of hikes from here was left relatively open by Chair Powell. The need for “restrictive” policy signals an expected peak rate above 3.0% -- the top of the ‘neutral range’ Chair Powell has previously given as a guide. While reference to the June FOMC “median federal funds rate” forecast being “slightly below 4 percent through the end of 2023” arguably leaves 4.0% as an upper limit for the peak given a downtrend is forming in the CPI detail and as a material negative output gap has already been established compared to the FOMC’s June forecast of trend growth through 2022-2024.
Our current forecast for a peak fed funds range of 3.25%-3.50% in December sits right in the middle of this range and looks to be consistent with the FOMC’s planned timing. Yet the same could also be said for a 3.50%-3.75% range, the additional 25bps coming in the form of either a 75bp September hike (our current forecast is 50bps), or via a second 50bp increase in November (our current forecast is 25bps). Either path would require a 25bp last move come December.
For our current forecast to be achieved, nonfarm payroll growth must decelerate from the next read (the August report is due this Friday). August also needs to record another benign CPI inflation print, with the scale and breadth of domestic price pressures critical. Even if both outcomes are as we expect and the FOMC hike by 50bps in September, a 50bp move come November will remain a material risk.
A final word on financial conditions. Term interest rates can quickly reverse course, the US 10 year as an example falling from a peak of 3.50% to near 2.60% in around 6 weeks from mid-June to the beginning of August. If yields jolt lower again before a downtrend in inflation is firmly established, the FOMC may decide to take out additional short-term insurance. Fed funds rate cuts are unlikely before late-2023, but will continue through 2024.
EUR/USD Weekly Outlook
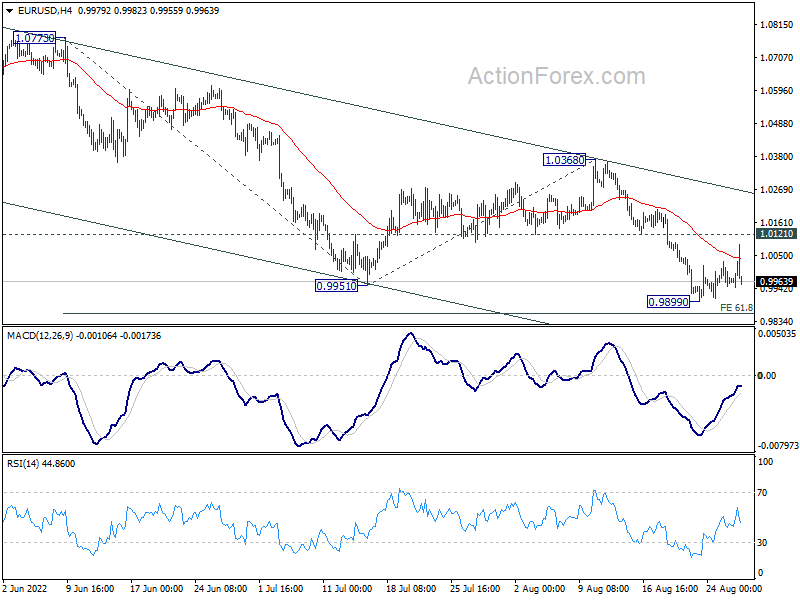
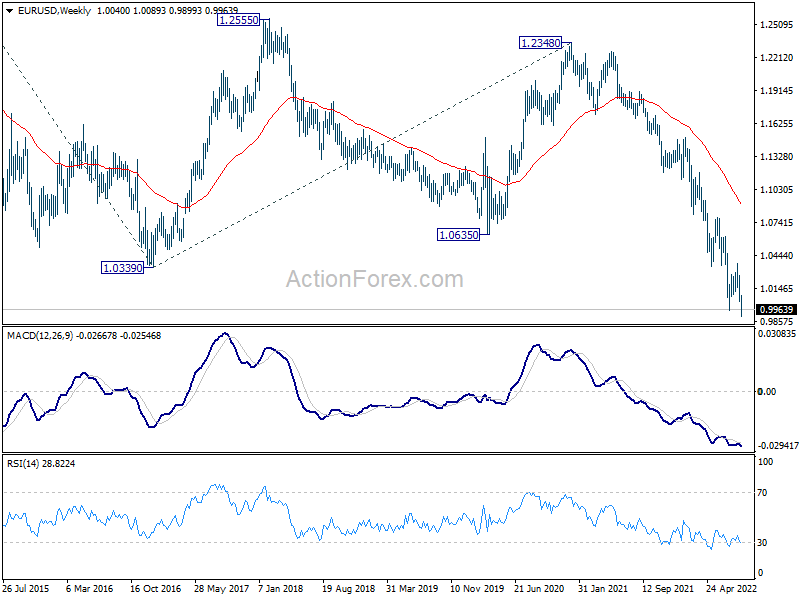
EUR/USD's down trend resumed last week and dropped to 0.9899. But it then turned into consolidation. Initial bias remains neutral this week first. Upside of recovery should be limited by 1.0121 minor resistance to bring another fall. Break of 0.9899 will resume larger down trend to 61.8% projection of 1.0773 to 0.9951 from 1.0368 at 0.9860. Firm break there should prompt downside acceleration to 100% projection at 0.9546. However, firm break of 1.0121 will dampen this view and turn focus to 1.0368 resistance instead.
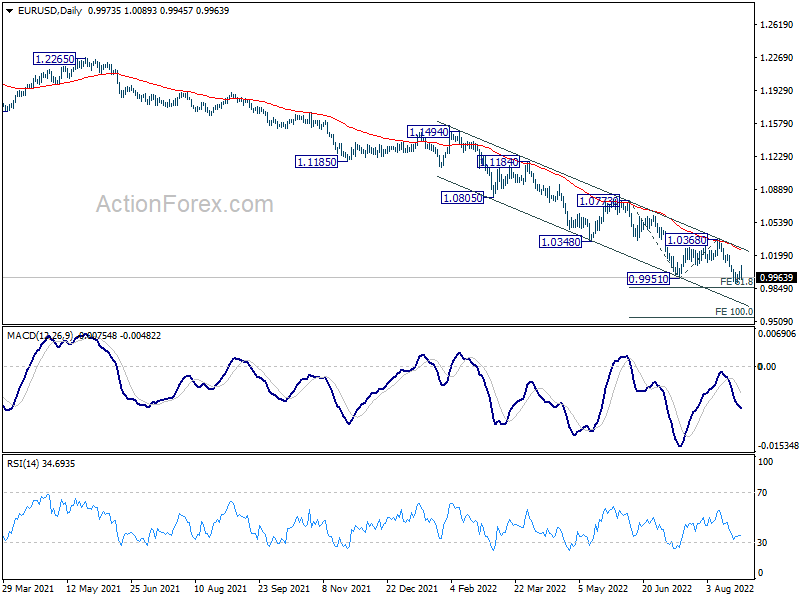
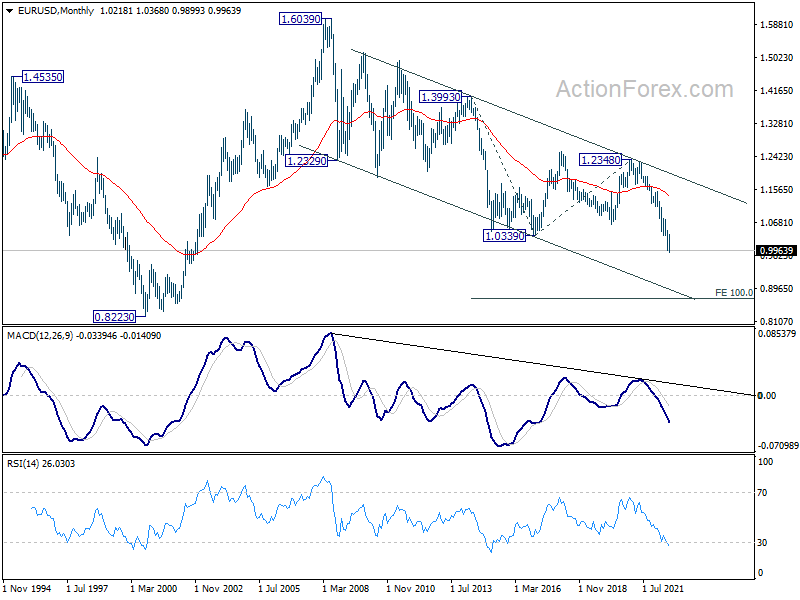
In the bigger picture, down trend from 1.6039 (2008 high) is still in progress. Next target is 100% projection of 1.3993 to 1.0339 from 1.2348 at 0.8694. In any case, outlook will stay bearish as long as 1.0368 resistance holds, in case of strong rebound.
In the long term picture, long term down trend from 1.6039 (2008 high) is extending. Next target is 100% projection of 1.3993 to 1.0339 from 1.2348 at 0.8694. This will now remain the favored case as long as 1.0638 support turned resistance holds.
USD/JPY Weekly Outlook
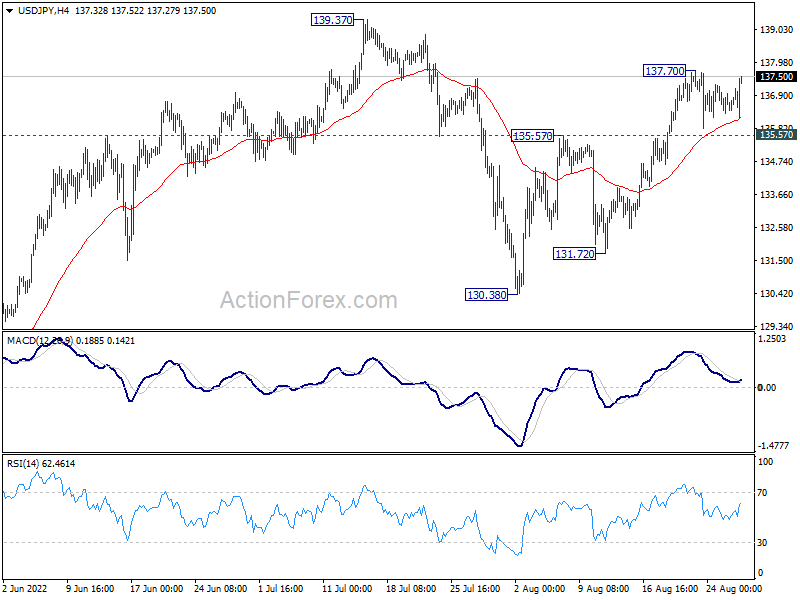
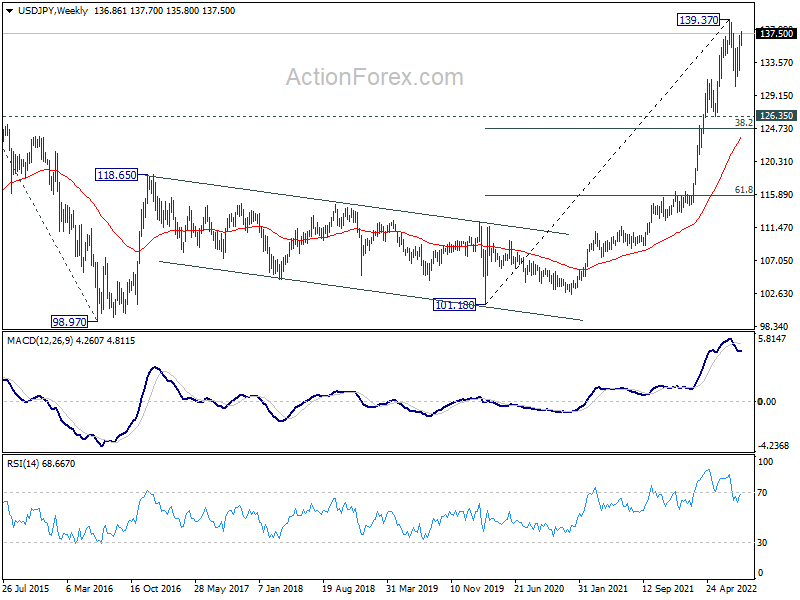
USD/JPY rose to 137.70 last week but turned sideway since then. Initial bias is neutral this week first. Overall, price actions from 139.37 are seen as a corrective pattern, with rise from 130.38 as the second leg. Above 137.70 will extend the rebound but upside should be limited by 139.37. On the downside, firm break of 135.57 will suggest that the third leg of the pattern has started, and turn intraday bias back to the downside for 131.72 support first.
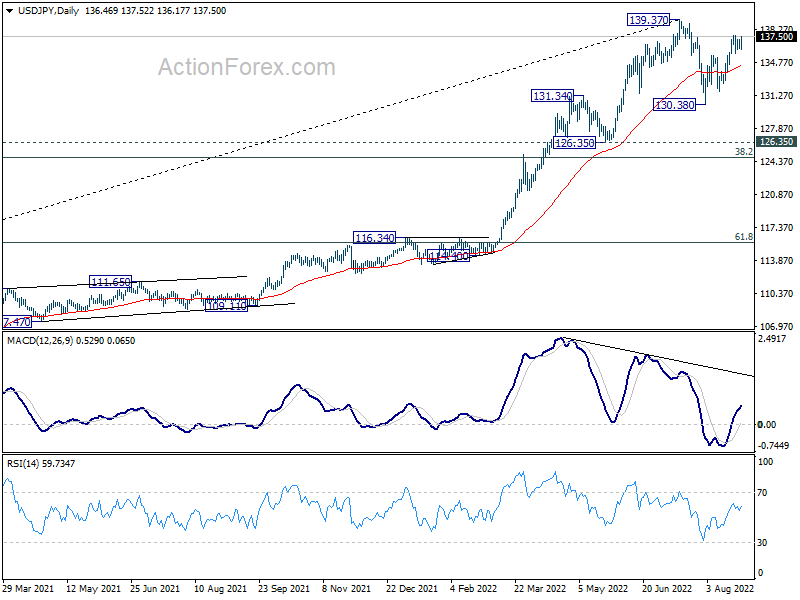
In the bigger picture, price actions from 139.37 medium term top are seen as a corrective pattern to up trend from 101.18 (2020 low). While deeper decline cannot be ruled out, outlook will stays bullish as long as 55 week EMA (now at 123.72) holds. Long term up trend is expected to resume through 139.37 at a later stage, after the correction finishes.
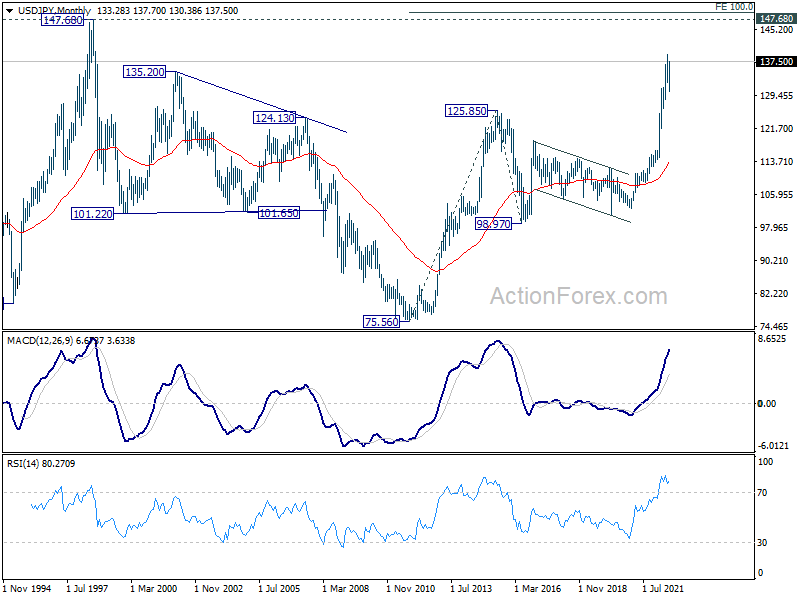
In the long term picture, rise from 101.18 is seen as part of the up trend from 75.56 (2011 low). Further rally is expected to 100% projection of 75.56 (2011 low) to 125.85 (2015 high) from 98.97 at 149.26, which is close to 147.68 (1998 high). This will remain the favored case as long as 55 week EMA (now at 123.72) holds.
GBP/USD Weekly Outlook
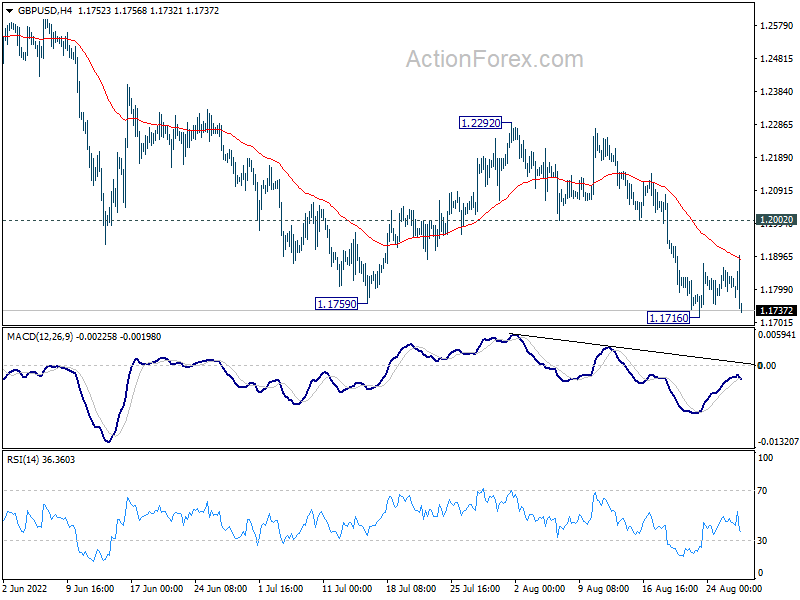
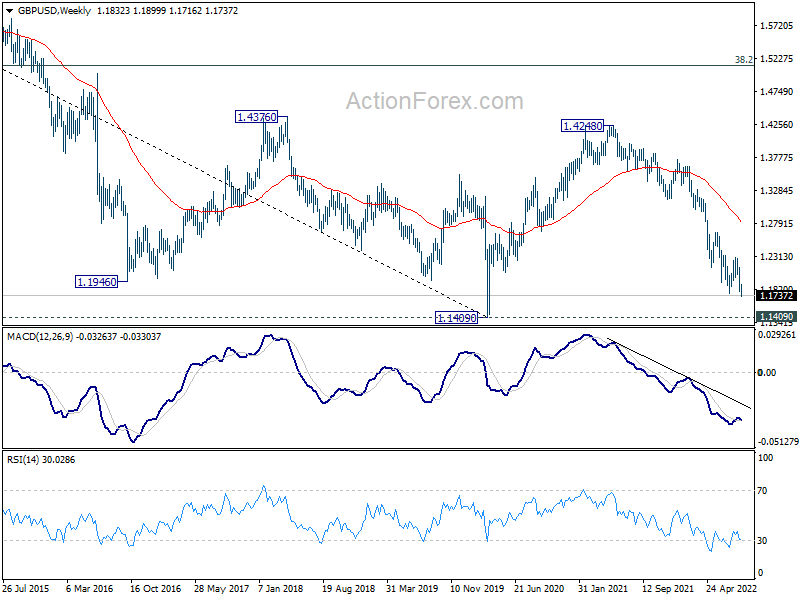
GBP/USD's down trend resumed last week by breaking 1.1759 low. But it recovered after hitting 1.1716. Initial bias is neutral this week first. In case of another recovery, upside should be limited by 1.2002 support turned resistance to bring another fall. Break of 1.1716 will resume larger down trend to 1.1409 long term support. However, firm break of 1.2002 will dampen this bearish view and bring stronger rise back to 1.2292 resistance.
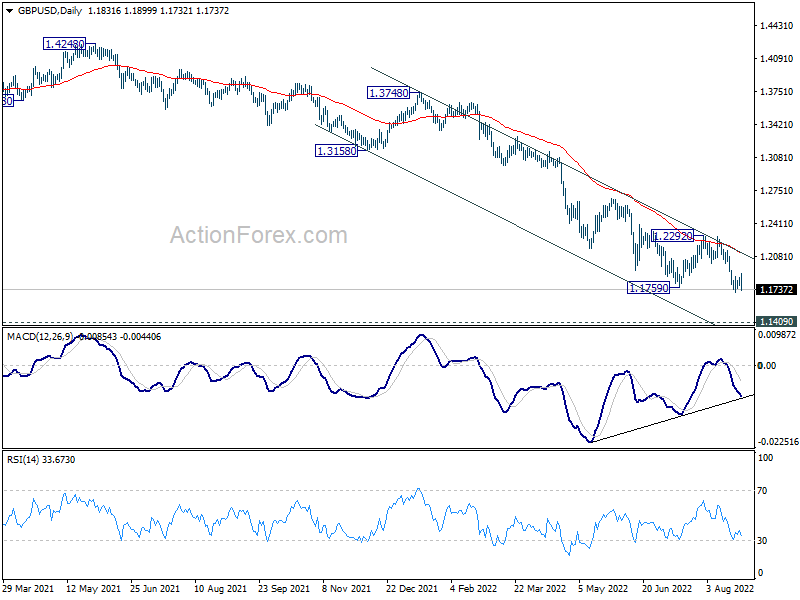
In the bigger picture, fall from 1.4248 (2018 high) could be a leg inside the pattern from 1.1409 (2020 low), or resuming the longer term down trend. Deeper decline is expected as long as 1.2292 resistance holds. Next target is 1.1409 low. However, firm break of 1.2292 will bring stronger rise back to 55 week EMA (now at 1.2859).
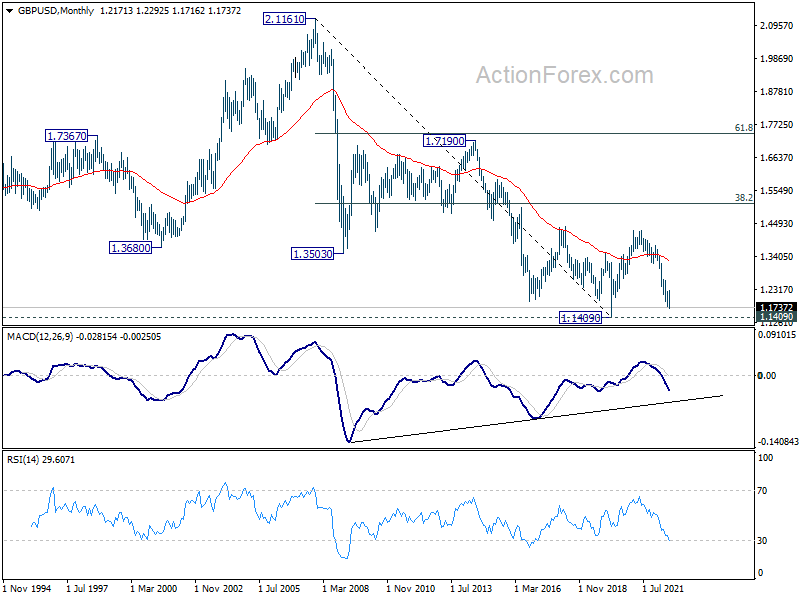
In the longer term picture, rebound from 1.1409 long term bottom should have completed at 1.4248 already, well ahead of 38.2% retracement of 2.1161 to 1.1409 at 1.5134. The development argues that price actions from 1.1409 was a corrective pattern only. That is, long term bearishness is retained for resuming the down trend from 2.1161 (2007 high) at a later stage.
USD/CHF Weekly Outlook
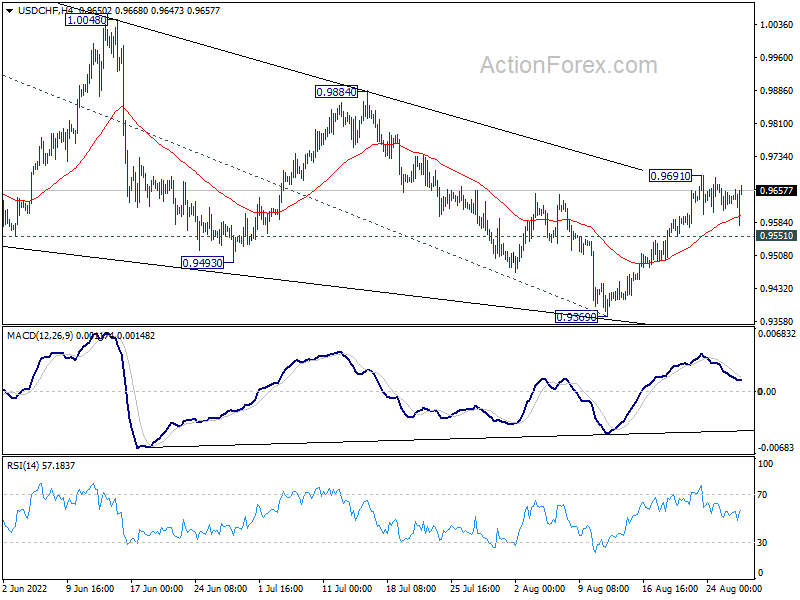
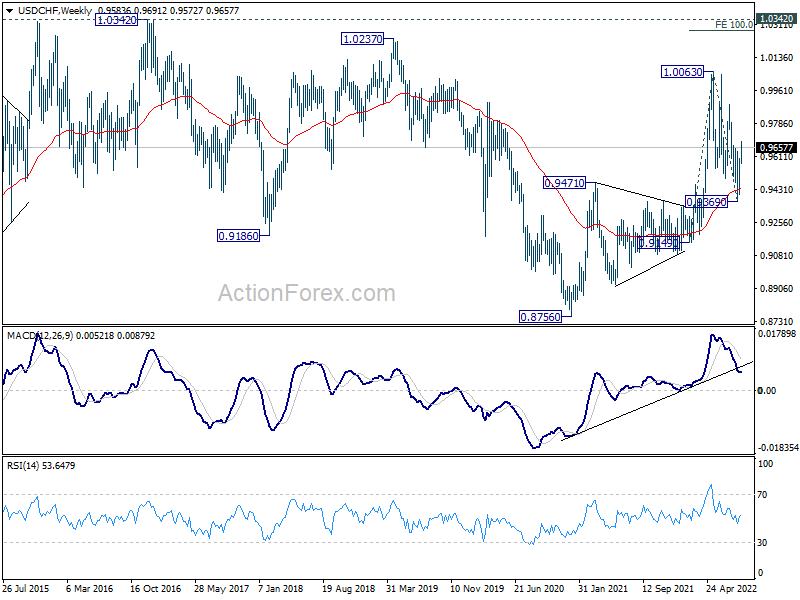
USD/CHF rose further to 0.9691 last week but retreated since then. Initial bias is neutral this week first. Triangle correction from 1.0063 could have completed at 0.9369 already. Above 0.9691 will resume the rise from 0.9369 and target 0.9884 resistance next. Break there will argue that larger up trend is ready for resumption through 1.0063. On the downside, below 0.9551 minor support will dampen this view and turn bias back to the downside for 0.9369 support instead.
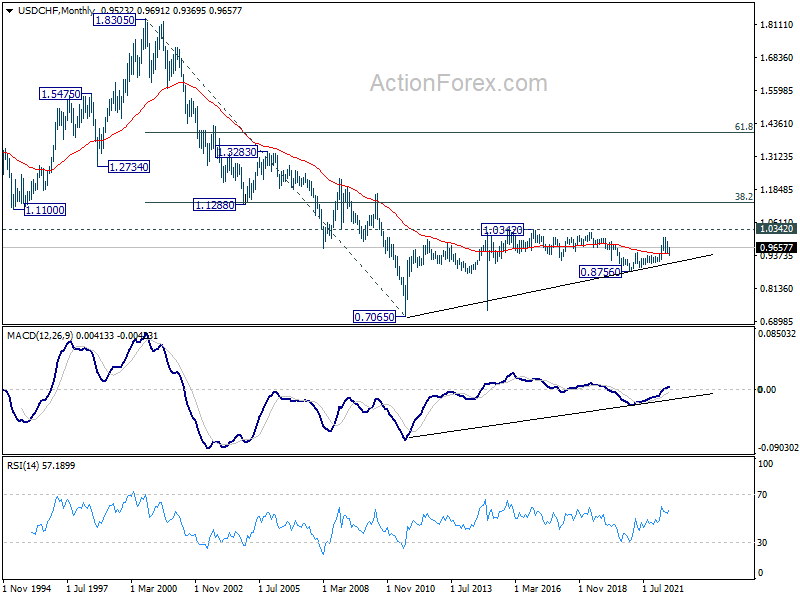
In the bigger picture, current development suggests that up trend from 0.8756 (2021 low) is still in progress. Sustained break of 1.0063 will target 100% projection of 0.9149 to 1.0063 from 0.9369 at 1.0283, and then 1.0342 (2016 high). For now, this will remain the favored case as long as 0.9369 support holds, even in case of deep pull back.
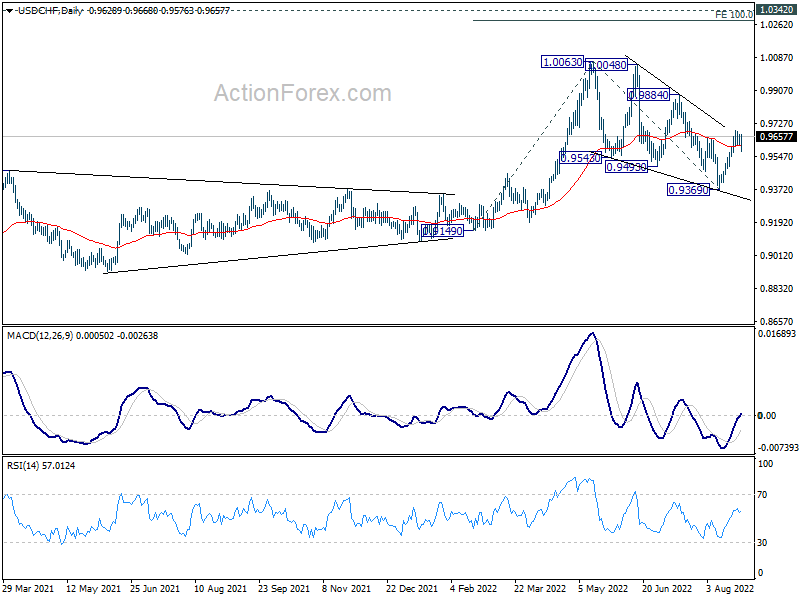
In the long term picture, outlook is mixed with deeper than expected fall from 1.0063, but some support is seen from 55 week EMA (now at 0.9433). Overall, though, USD/CHF is seen as in sideway pattern from 1.0342 (2016 high). Range trading should continue until further development.
AUD/USD Weekly Outlook
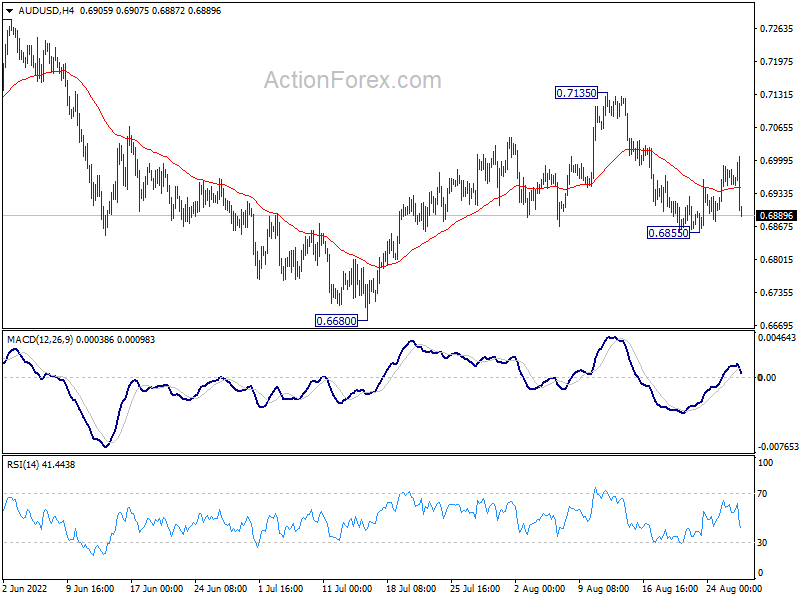
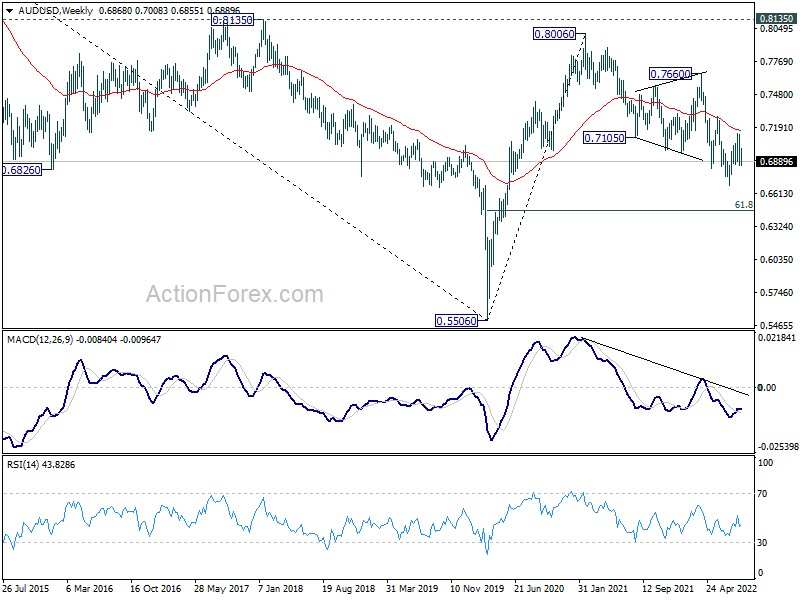
AUD/USD recovered after edging lower to 0.6855 last week. But outlook is unchanged. Initial bias remains neutral this week first. Corrective rebound from 0.6680 could have completed with three waves up to 0.7135. Below 0.6855 will target a retest on 0.6680 low. However, break of 0.7135 will invalidate this view and resume the rebound from 0.6680 instead.
In the bigger picture, price actions from 0.8006 (2021 high) is seen more as a corrective pattern to rise from 0.5506 (2020 low). Or it could also be a bearish impulsive move. In either case, outlook will remain bearish as long as 0.7282 resistance holds. Next target is 61.8% retracement of 0.5506 to 0.8006 at 0.6461.
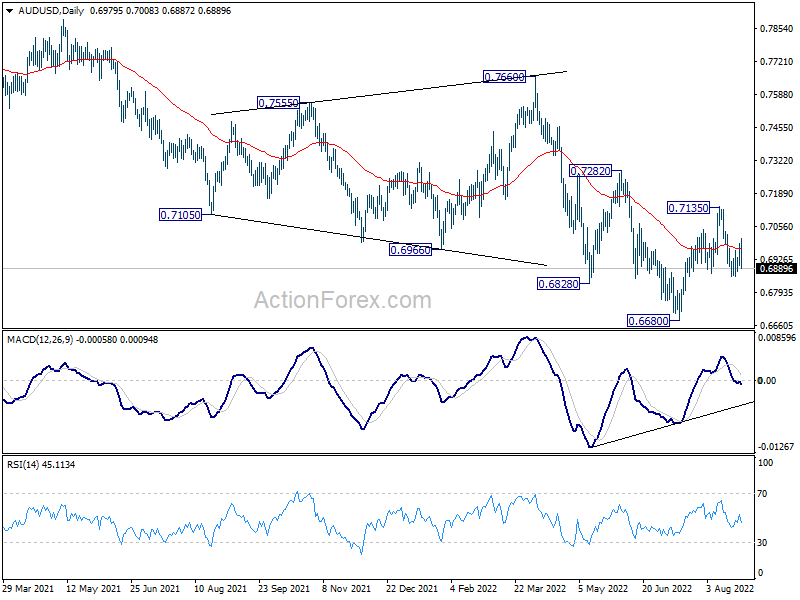
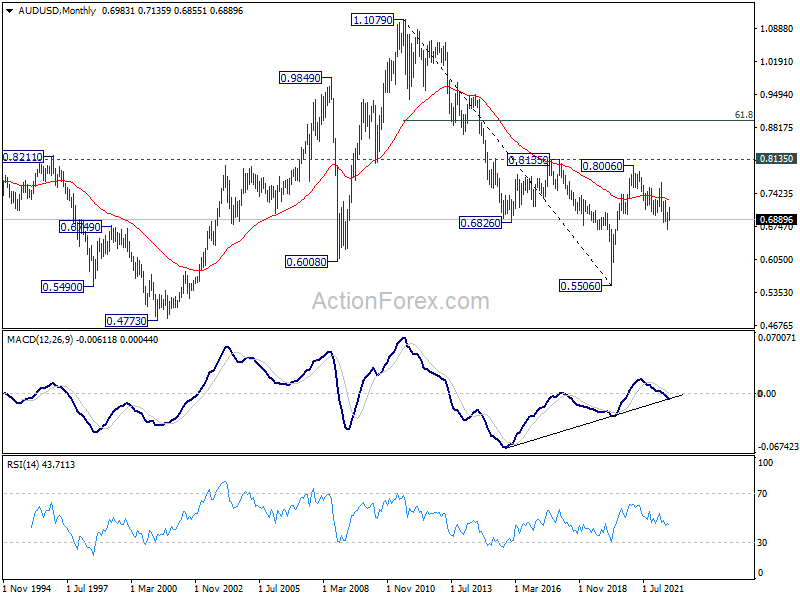
In the long term picture, rejection by 0.8135 resistance suggests that the long term down trend from 1.1079 (2011 high) is not ready to reverse. Yet, the structure of the fall from 0.8006 still argues that it's a corrective move. Hence, break of 0.5506 low is not envisaged for now. The long term outlook stays neutral first, and will be reassessed later after the fall from 0.8006 completes.
USD/CAD Weekly Outlook
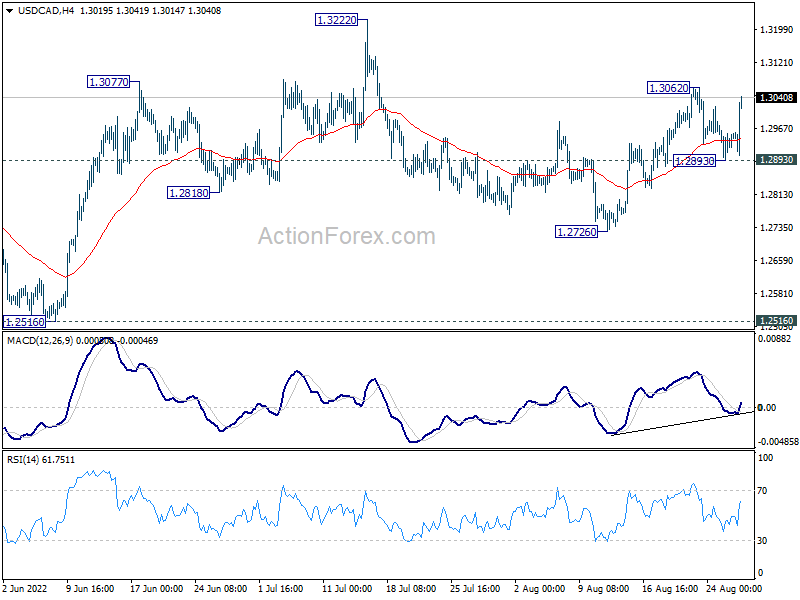
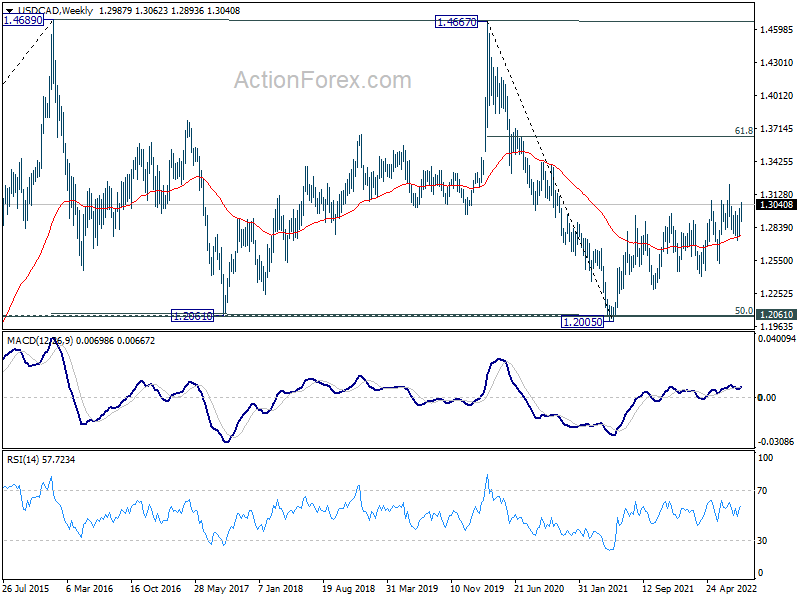
Some volatility was seen in USD/CAD last week but outlook is unchanged. Corrective decline from 1.3222 could have completed with three waves down to 1.2726. Initial bias remains neutral this week first and further rise is in favor. On the upside, break of 1.3062 will resume the rally from 1.2726 to retest 1.3222 high next. However, break of 1.2893 minor support will dampen this view and turn bias back to the downside for 1.2726 and possibly below.
In the bigger picture, down trend from 1.4667 (2020 high) should have completed at 1.2005, after defending 1.2061 long term cluster support. Rise from there should target 61.8% retracement of 1.4667 to 1.2005 (2021 low) at 1.3650. This will remain the favored case now as long as 1.2516 support holds.
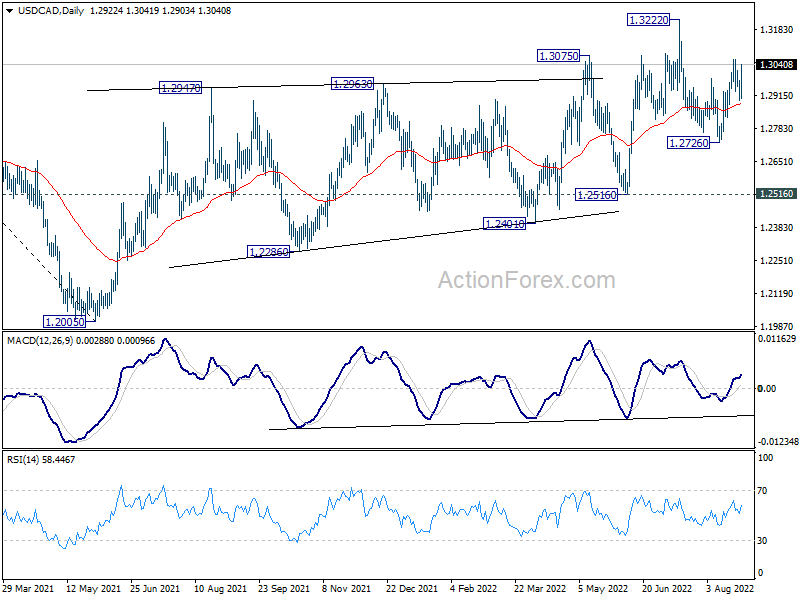
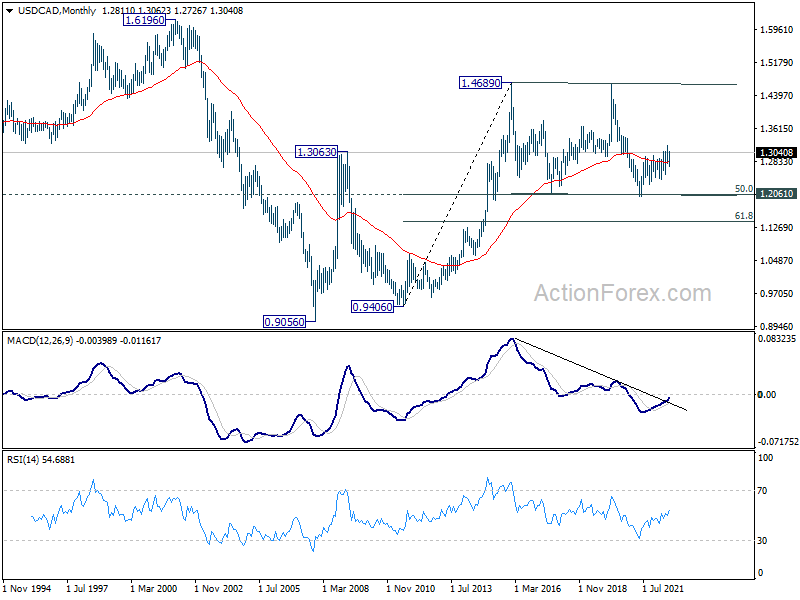
In the longer term picture, price actions from 1.4689 (2016 high) are seen as a consolidation pattern only. That is, up trend from 0.9506 (2007 low) is still expected to resume at a later stage. This will remain the favored case as long as 1.2061 support holds, which is close to 50% retracement of 0.9406 to 1.4689 at 1.2048.
GBP/JPY Weekly Outlook
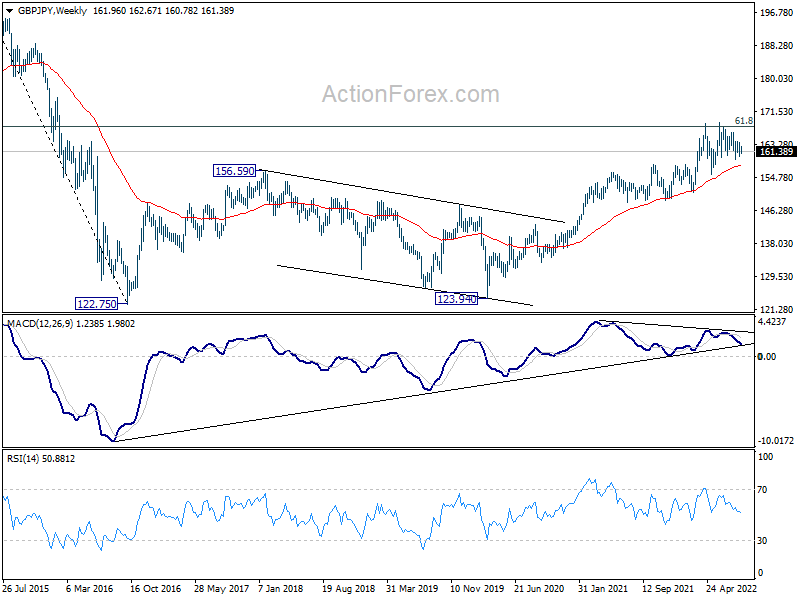
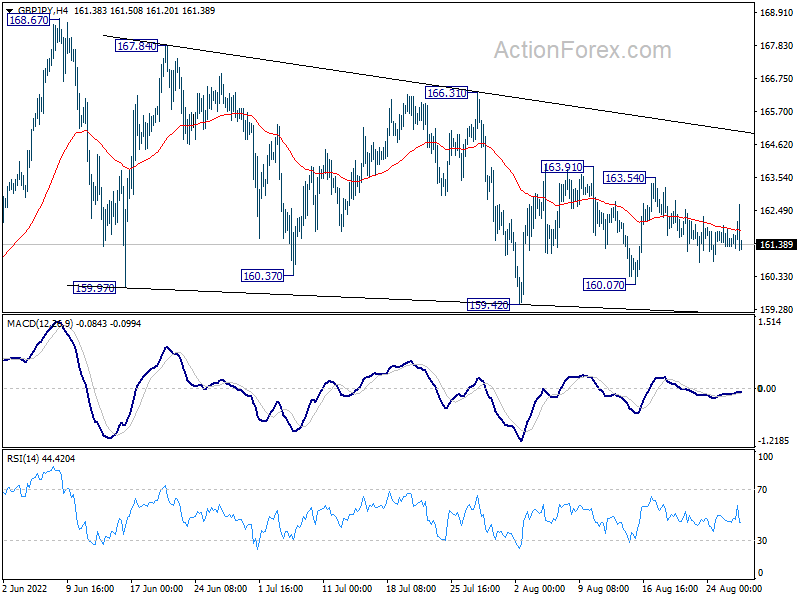
GBP/JPY stays in sideway trading last week and outlook is unchanged. Initial bias remains neutral this week first. Corrective pattern from 168.67 would extend for a while. On the upside, break of 163.91 will bring stronger rise to 166.31 resistance. On the downside, below 160.07 will turn bias to the downside for 159.42 and below.
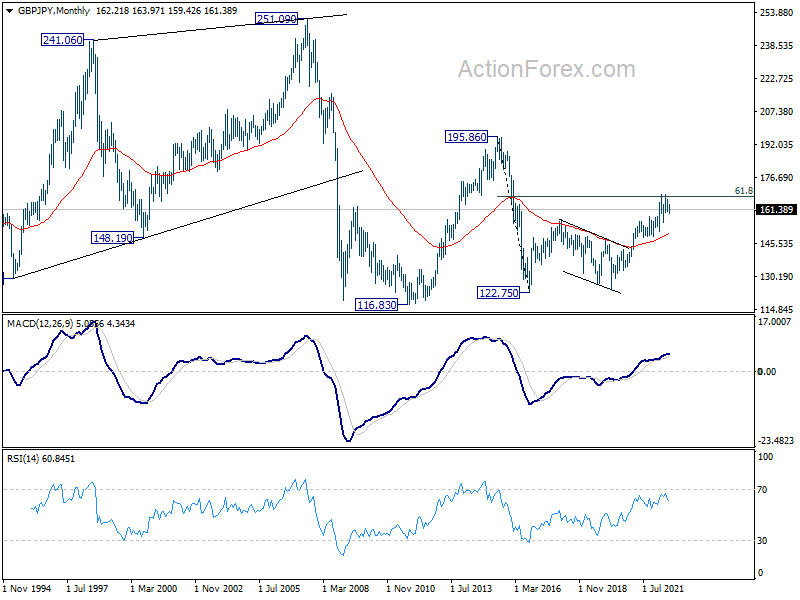
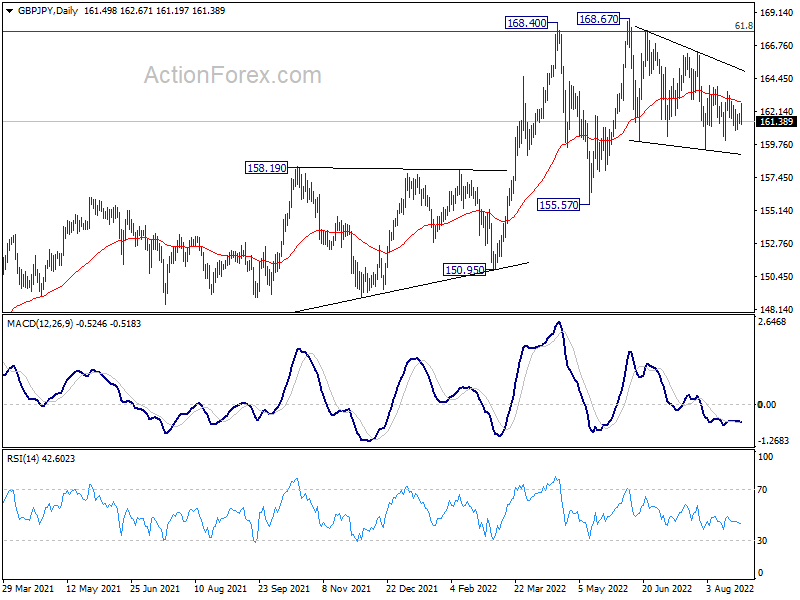
In the bigger picture, up trend from 123.94 (2020 low) is still in progress. Sustained break of 61.8% retracement of 195.86 (2015 high) to 122.75 (2016 low) at 167.93 will be a long term bullish signal, and could pave the way back to 195.86 high. This will remain the favored case as long as 155.57 support holds, even in case of deep pull back.
In the longer term picture, rise from 122.75 could be the third leg the the pattern from 116.83 (2011 low). Further rise will remain in favor as long as 55 month EMA (now at 149.84) holds. Sustained break of 61.8% retracement of 195.86 to 122.75 at 167.93. will pave the way to 195.86 (2015 high).