Sample Category Title
Aussie Tumbles after Hawkish Powell
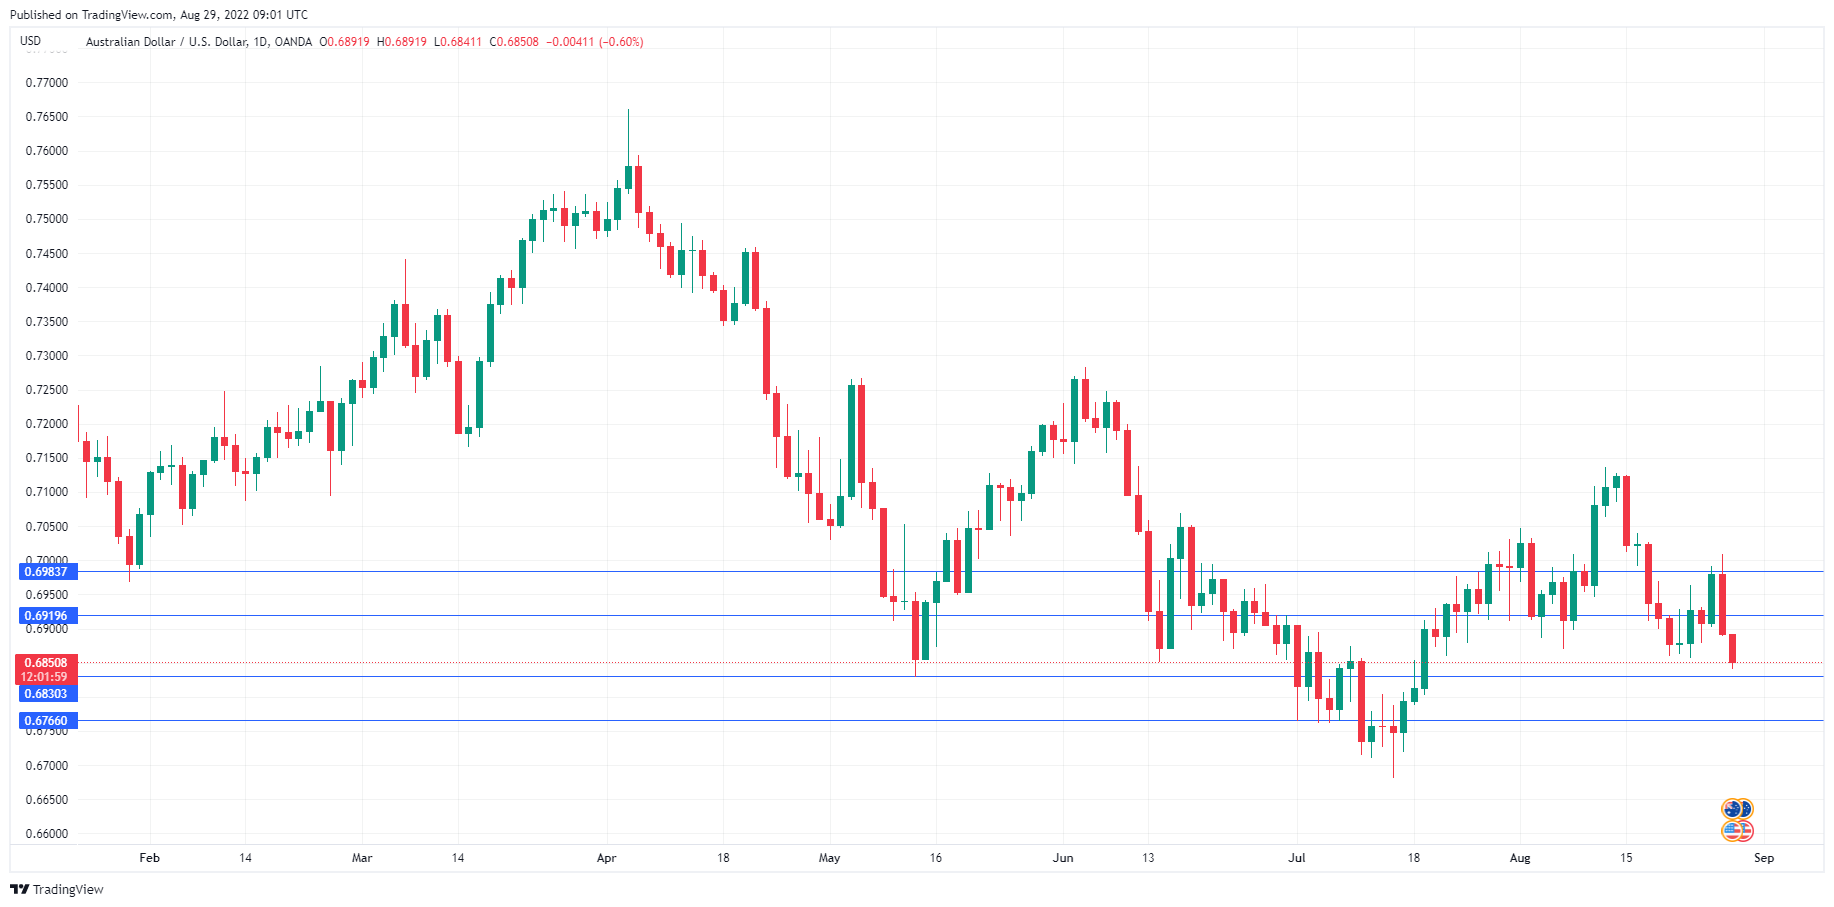
The Australian dollar has started the week in negative territory, extending the sharp losses seen on Friday. In the European session, AUD/USD is trading at 0.6849, down 0.63%.
US dollar flies after Powell’s rate remarks
The US dollar ended the week on a high note, courtesy of Fed Chair’s hawkish speech at the Jackson Hole Symposium on Friday. Powell’s message didn’t veer from what the Fed has been telegraphing the markets for weeks, but this time around investors internalized the message, which sent the equity markets reeling before the weekend. Powell stated that the Fed would continue to use all its tools to fight inflation, acknowledging that high interest rates would remain for some time, and the Fed would be careful not to ease policy prematurely. Significantly, Powell said that the Fed would not change policy based on one or two reports of lower inflation. This statement could well have been a response to the market euphoria about a Fed U-turn in policy after July’s inflation dropped unexpectedly.
Powell’s speech was unusually brief, which may have been an attempt to prevent investors from looking for some dovish remarks in the speech and ignoring Powell’s message. The concise speech left no room for ambiguity – the Fed will continue to raise rates until it’s convinced that inflation has peaked and is on the decline.
In Australia, retail sales bounced back in July with a strong 1.3% gain, blowing past the estimate of 0.3% and above the 0.2% reading in June. The reading hasn’t helped the Aussie any, as investors continue to digest Powell’s speech at Jackson Hole. The RBA meets next week, and the rebound in retail sales will make it easier for the central bank to remain aggressive and deliver a 50 basis point hike for a fourth straight time.
AUD/USD Technical
- There is resistance at 0.6919, followed by a monthly resistance line at 0.6983
- 0.6830 is a weak support line. Below, there is support at 0.6766
GBP/JPY Daily Outlook
Daily Pivots: (S1) 160.87; (P) 161.77; (R1) 162.33; More...
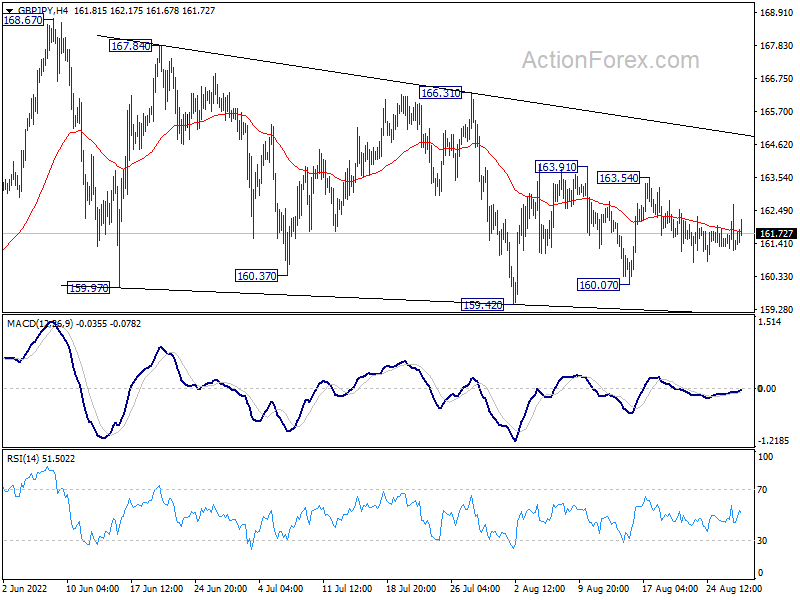
Range trading continues in GBP/JPY and intraday bias remains neutral. Corrective pattern from 168.67 would extend for a while. On the upside, break of 163.91 will bring stronger rise to 166.31 resistance. On the downside, below 160.07 will turn bias to the downside for 159.42 and below.
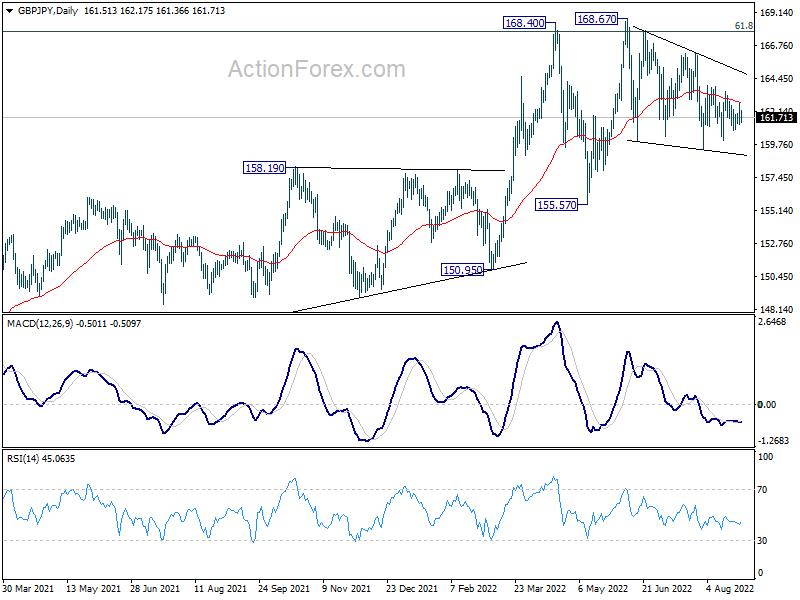
In the bigger picture, up trend from 123.94 (2020 low) is still in progress. Sustained break of 61.8% retracement of 195.86 (2015 high) to 122.75 (2016 low) at 167.93 will be a long term bullish signal, and could pave the way back to 195.86 high. This will remain the favored case as long as 155.57 support holds, even in case of deep pull back.
EUR/JPY Daily Outlook
Daily Pivots: (S1) 136.10; (P) 137.03; (R1) 137.97; More....
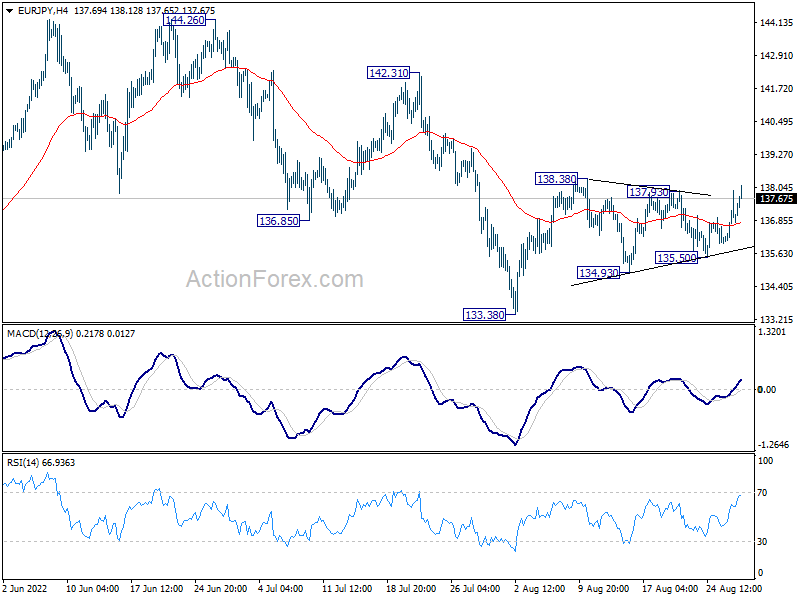
EUR/JPY is trying to resume the rebound from 133.38 by breaking 137.93 minor resistance. Intraday bias is mildly on the upside. Firm break of 138.38 will confirm and target 142.31 resistance next. On the downside, break of 134.93 will turn bias back to the downside for 133.38 support. Overall, corrective pattern from 144.26 could extend further with more choppy trading.
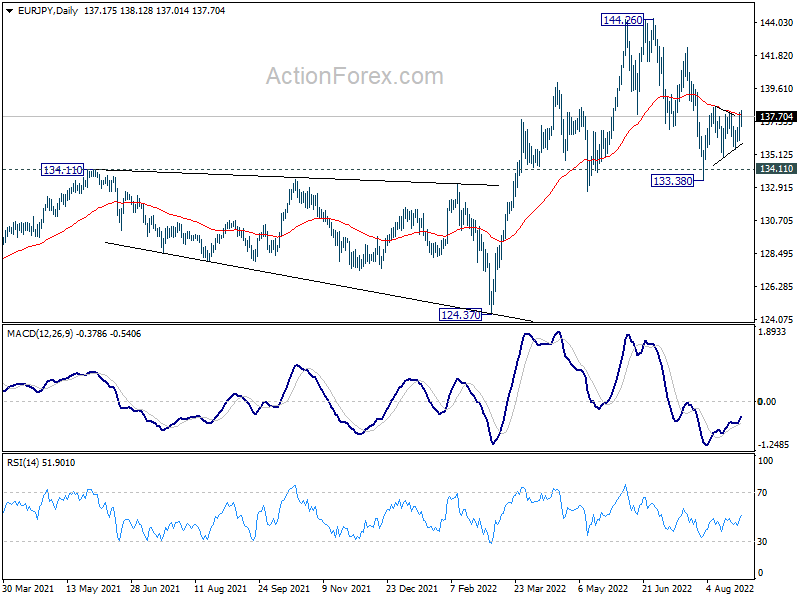
In the bigger picture, up trend from 114.42 (2020 low) is seen as the third leg of the pattern from 109.30 (2016 low). Further rally is in favor as long as 134.11 resistance turned support holds, even in case of deep pull back. Next target is 149.76 (2015 high). However, sustained break of 134.11 will be a sign of medium term bearish reversal and turn focus to 124.37 support for confirmation.
EUR/GBP Daily Outlook
Daily Pivots: (S1) 0.8443; (P) 0.8473; (R1) 0.8520; More...
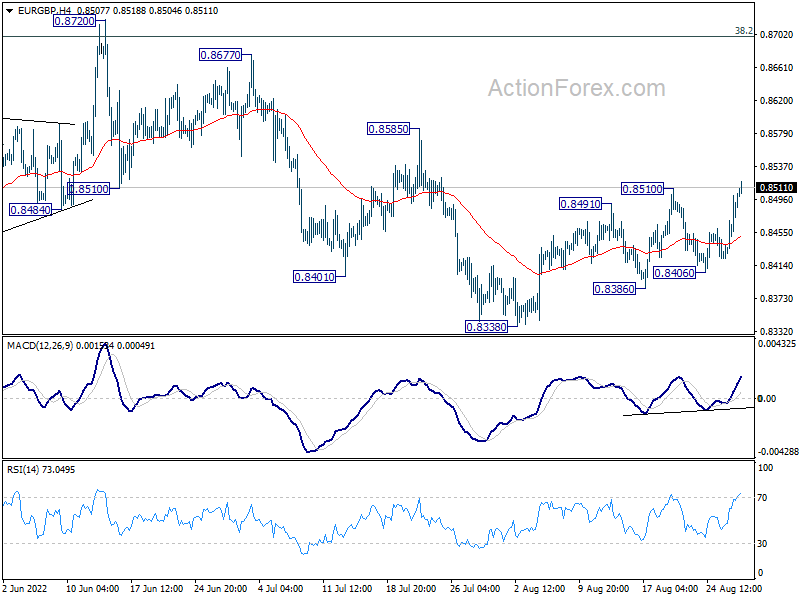
EUR/GBP's choppy rise from 0.8338 resumed by breaking 0.8510 resistance. Intraday bias is back on the upside for 0.8585 resistance firs. On the downside, break of 0.8406 support is needed to confirm completion of the rebound. Otherwise, further rally will remain mildly in favor in case of retreat.
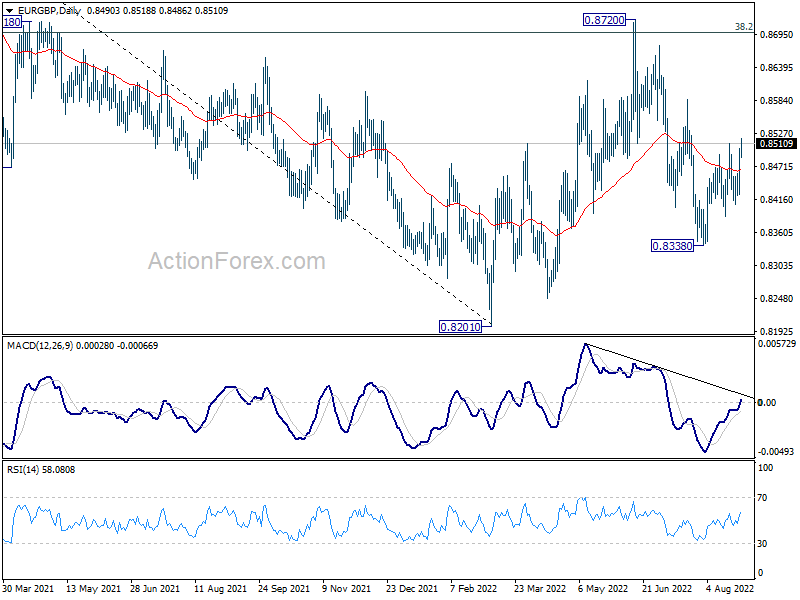
In the bigger picture, medium term bearishness is maintained with prior rejection by 38.2% retracement of 0.9499 to 0.8201 at 0.8697. Break of 0.8201 will resume larger down trend from 0.9499 (2020 high). Nevertheless, sustained break of 0.8697 will affirm the case that rise from 0.8201 is a medium term up trend itself.
EUR/AUD Daily Outlook
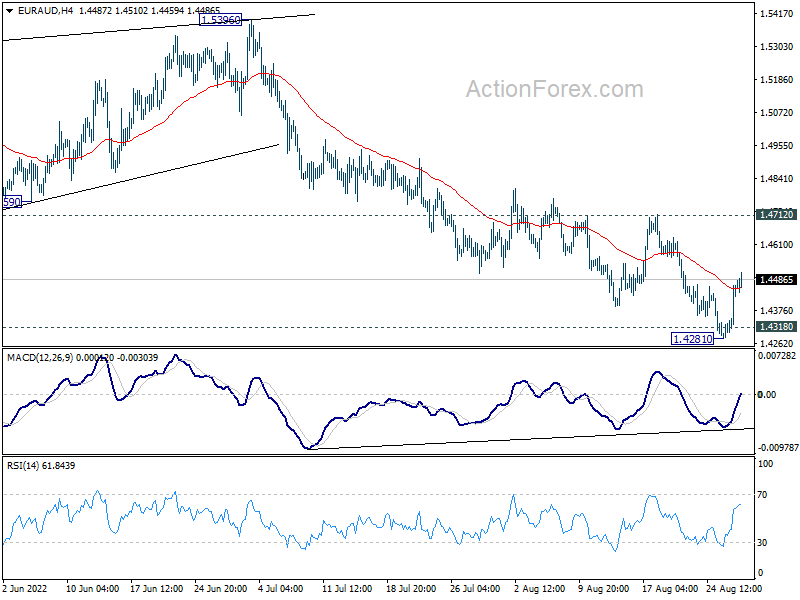
Daily Pivots: (S1) 1.4343; (P) 1.4406; (R1) 1.4524; More...
Intraday bias in EUR/AUD remains neutral at this point. Further decline is still expected with 1.4712 resistance intact. On the downside, firm break of 1.4318 low will resume larger down trend to medium term projection level at 1.3623. On the upside, break of 1.4712 resistance will delay the bearish case and turn bias to the upside for stronger rebound first.
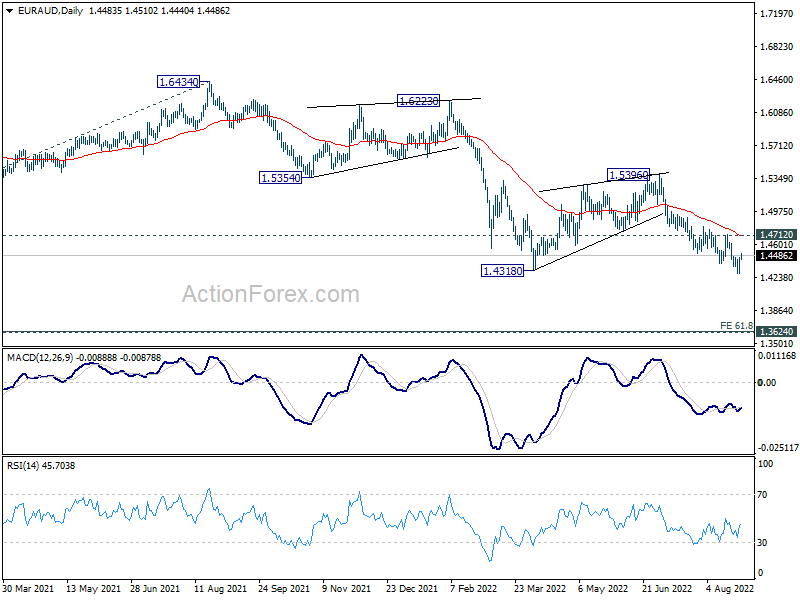
In the bigger picture, down trend from 1.9799 is still in progress. Break of 1.4318 low will target 61.8% projection of 1.9799 to 1.5250 from 1.6434 at 1.3623, which is close to 1.3624 long term support (2017 low). This will remain the favored case now as long as 1.5396 resistance holds.
EUR/CHF Daily Outlook
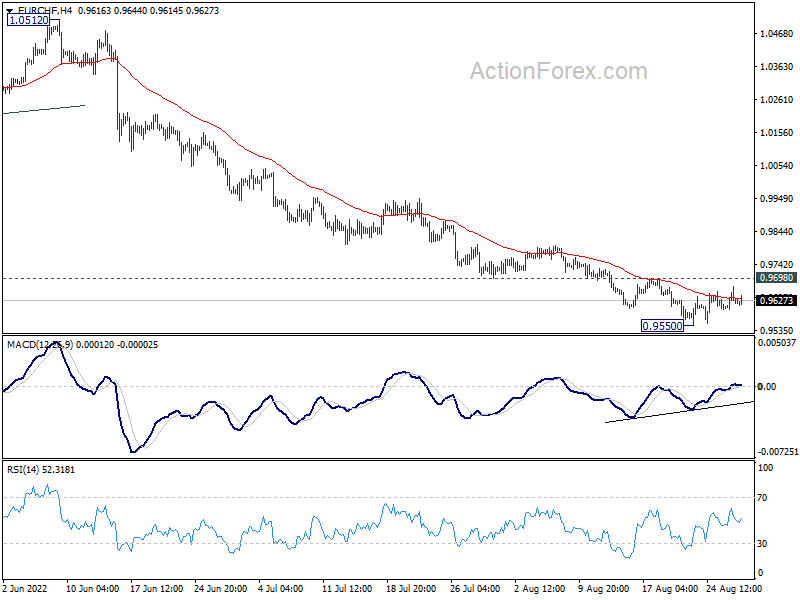
Daily Pivots: (S1) 0.9594; (P) 0.9633; (R1) 0.9666; More....
Intraday bias in EUR/CHF remains neutral for the moment, and further decline is expected with 0.9698 resistance intact. Break of 0.9550 will resume larger down trend to 100% projection of 1.1149 to 0.9970 from 1.0513 at 0.9334. On the upside, however, break of 0.9698 will confirm short term bottoming. Bias will be turned back to the upside for rebound, towards 55 day EMA (now at 0.9842).
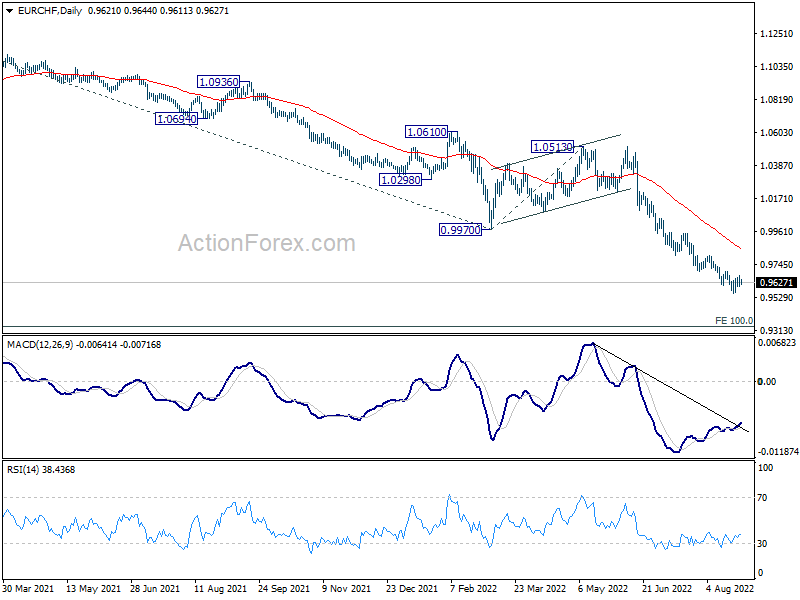
In the bigger picture, long term down trend from 1.2004 (2018 high) is still in progress. Next target is 138.2% projection of 1.2004 to 1.0505 to 1.1149 at 0.9033. On the upside, break of 0.9970 support turned resistance is needed to be the first sign of medium term bottoming. Otherwise, outlook will stay bearish in case of strong rebound.
EURUSD’s Bearish Wave Remains Intact
EURUSD’s bears are attempting to take control again after several failed endeavours to surpass the key 1.0000 level. Previously, the pair was unable to find sufficient buying interest to exit the 2022 downward-sloping channel, and the momentum indicators are currently warning that there might be additional bearish occurrences in the near future. The MACD looks ready to re-activate its negative wave below its red trigger and zero lines, while the RSI is approaching its 30 oversold level.
In the bearish scenario, the decline may gather substantial pace towards the 0.9835 support, taken from the lows in September 2002. In the event the gloomy outlook continues to deteriorate from this point forward, attention will swiftly shift to the inside swing highs in June and April 2000 at 0.9780 and 0.9700 respectively. Note that the channel's bottom line is also in the area and may act as a strong support around 0.9600.
Alternatively, a bounce above parity could initially push for a close above the 1.0090 resistance with scope to reach the area between the short-term simple moving averages (SMAs) around 1.0130. Then, an advance above the descending trend line near 1.0200 may drive the pair towards the 1.0355 barrier.
Overall, the existing bearish move in EURUSD is anticipated to continue in the short term. Traders are likely to wait for a decisive break below the 20-year low of 0.9899 before they further reduce their exposure to the market.

Dollar Index Hits New 20-Year High on Signal that Interest Rates Would Remain High for Some Time
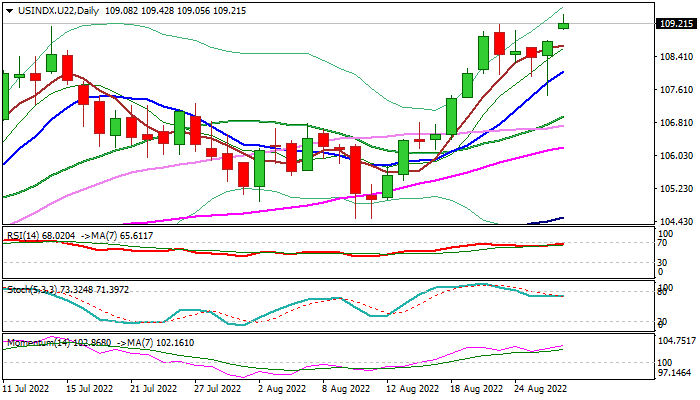
The dollar hit new 20-year high against the basket of major currencies in early Monday, driven by fresh demand on US interest rate outlook.
The dollar index opened with gap higher on Monday and rose to the highest since June 2002, after Fed Chair Jerome Powell, in his speech in Jackson Hole symposium on Friday, further boosted dollar’s positive sentiment by signals that US interest rates would stay higher as long as required to bring soaring inflation down.
Lift above former tops at 109.19/12 (also Fibo 76.4% of 2001/2008 downtrend) opens way for test of psychological 110 barrier, which guards 112.04 (June 2002 high), though the rally could accelerate towards 2001 peak if geopolitical and economic conditions deteriorate in coming months.
Technical studies are bullish on all larger timeframes and contribute to positive outlook, with Friday’s long-tailed hammer candle signaling that the downside remains well protected, as last week’s pullback was very shallow and short-lived.
The index is on track for strong monthly advance (over 3%) which also marks the third consecutive month of rally and the biggest monthly gain since April that adds to positive signals.
Res: 109.42; 110.00; 110.22; 110.89
Sup: 109.05; 108.67; 108.05; 107.46
Daily Technical Analysis
EUR/USD
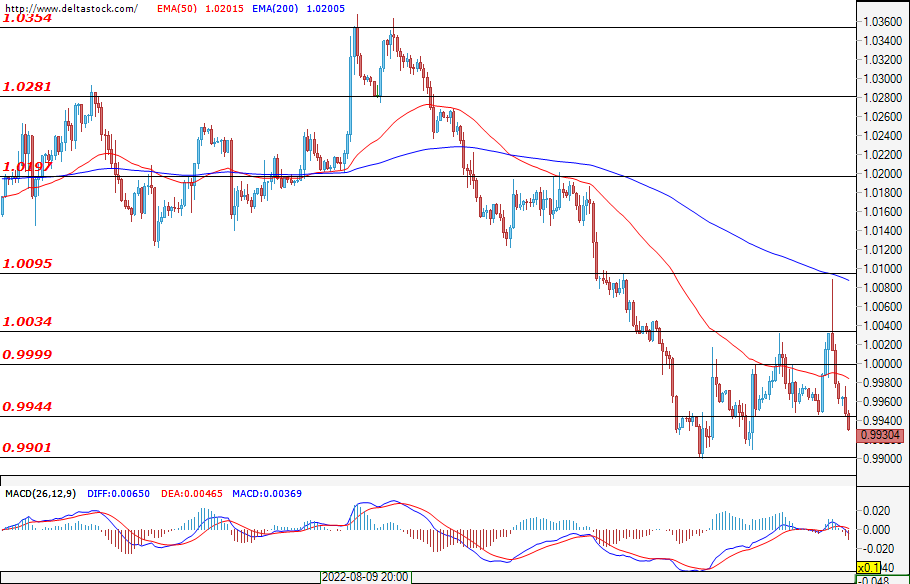
At the end of last week, the dollar managed to gain ground against the euro after Jerome Powell’s speech at the Jackson Hole symposium did not meet the markets’ expectations for a less aggressive interest rate hike strategy. The bears' success carried out in today's trading session as well. Already in the first hours, bearish investors managed to overcome the support at 0.9944 and are currently trying to consolidate their breakout. The next key support for them sits at 0.9900. For the bulls, the psychological border of 1.0000 looks increasingly distant and the next resistance can be found at the level of 1.0034. Today, there is no macroeconomic news that is expected to have a strong effect on the market.
USD/JPY
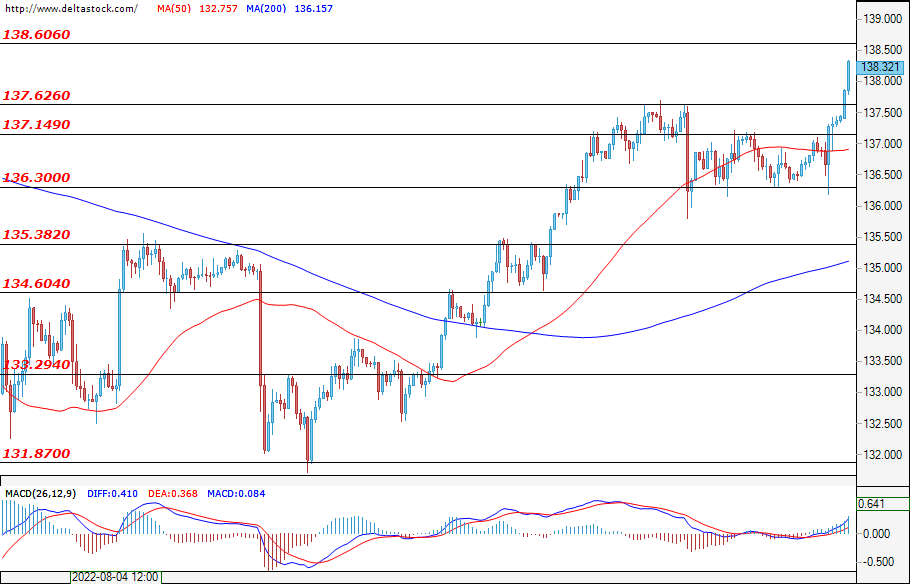
The range between the 136.30 and 137.62 levels, in which the Ninja has been trading for the past ten days, was breached by the bulls. In just a matter of hours after the market opened, the bulls managed to consolidate their breakout and are already targeting the next key resistance at 138.60. If the bears are able to extend the sell-off, then they will need to first get back within the aforementioned trend line and then deal with the support at 137.15.
GBP/USD
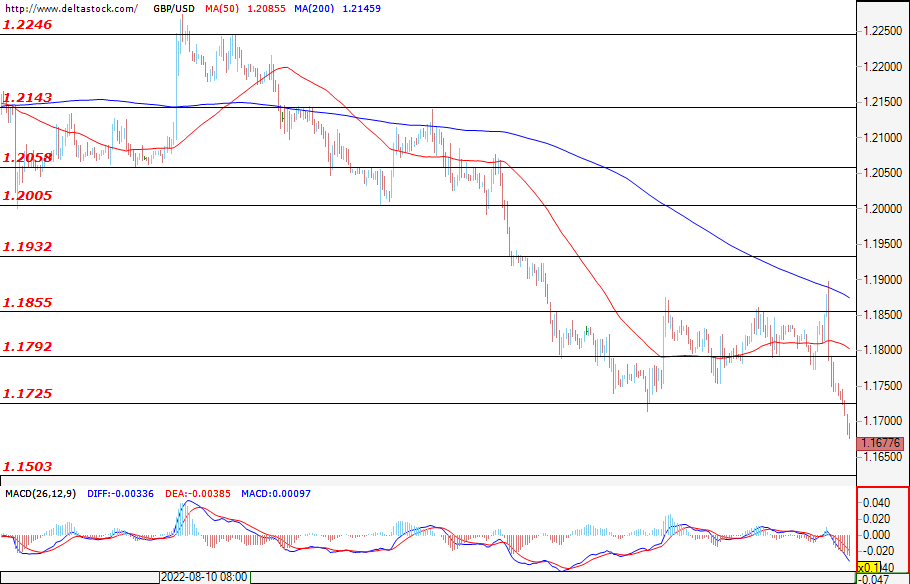
The bearish sentiment continues in full force for the Sterling as the dollar keeps dominating almost every other currency. The bears managed to breach the support at 1.1725 as soon as the trading session opened. In order to find the next support at 1.1503, we will first need to look at a longer timeframe. Due to the non-working day in the UK, volatility is likely to remain low today.
EUGERMANY40
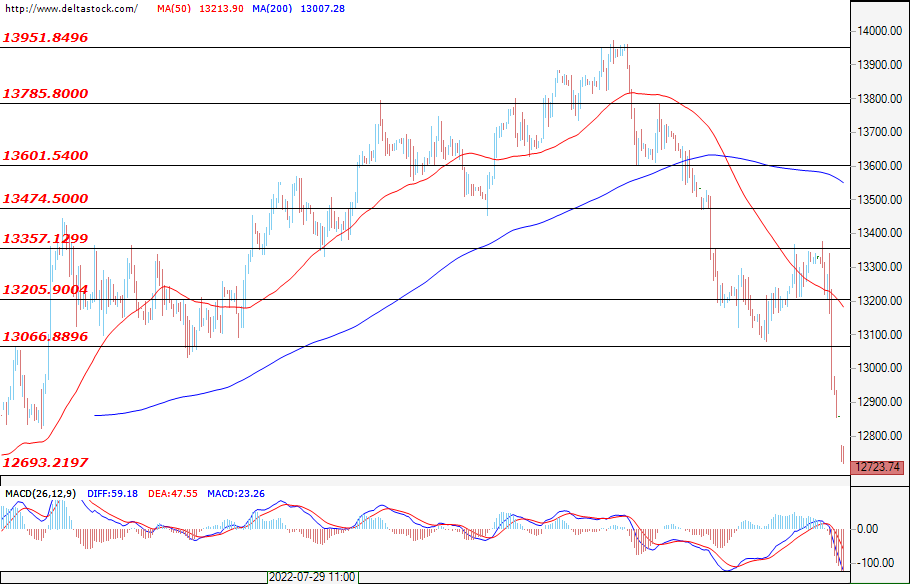
The bears managed to increase the short volumes in the German index as well. At the time of writing, they are targeting the support at 12690. If the bulls manage to reverse the market direction, then they will have to face the resistance at 13070. During today's trading session, no news from Germany or Europe is expected to have a strong impact on the volatility of the EUGERMANY40.
US30
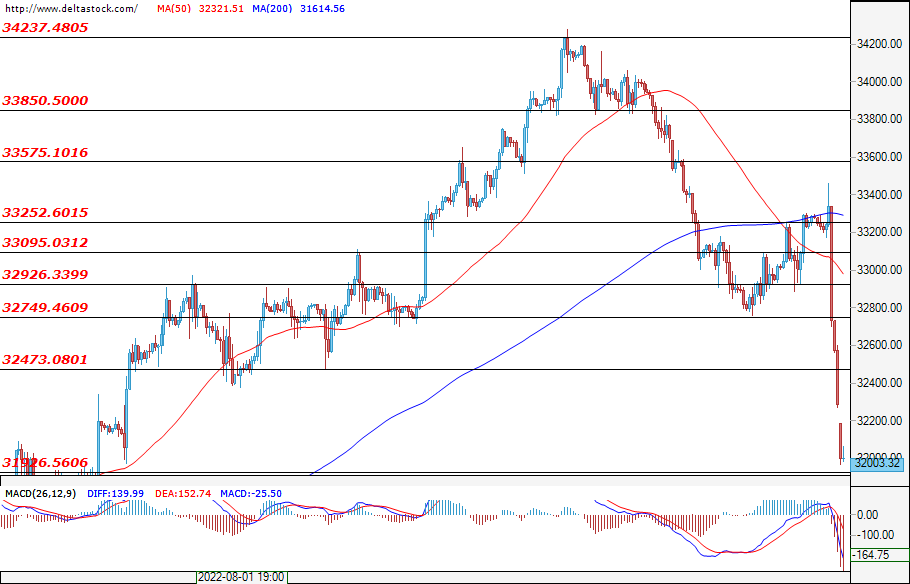
Like the German index, the U.S. blue-chip index bears are reaping the fruits of Jerome Powell’s speech at the Jackson Hole symposium, in which he signalled a more hawkish approach to battling the rampant inflation in the U.S. At the time of writing, they are targeting support at 31925. During today's trading session, macroeconomic news does not appear to have a strong impact on the price of the index. The next news that could have a strong effect on the volatility of the index is the U.S. consumer confidence index on Tuesday at 14:00 GMT.
DXY: Has the Cycle Triple Zigzag Been Completed?
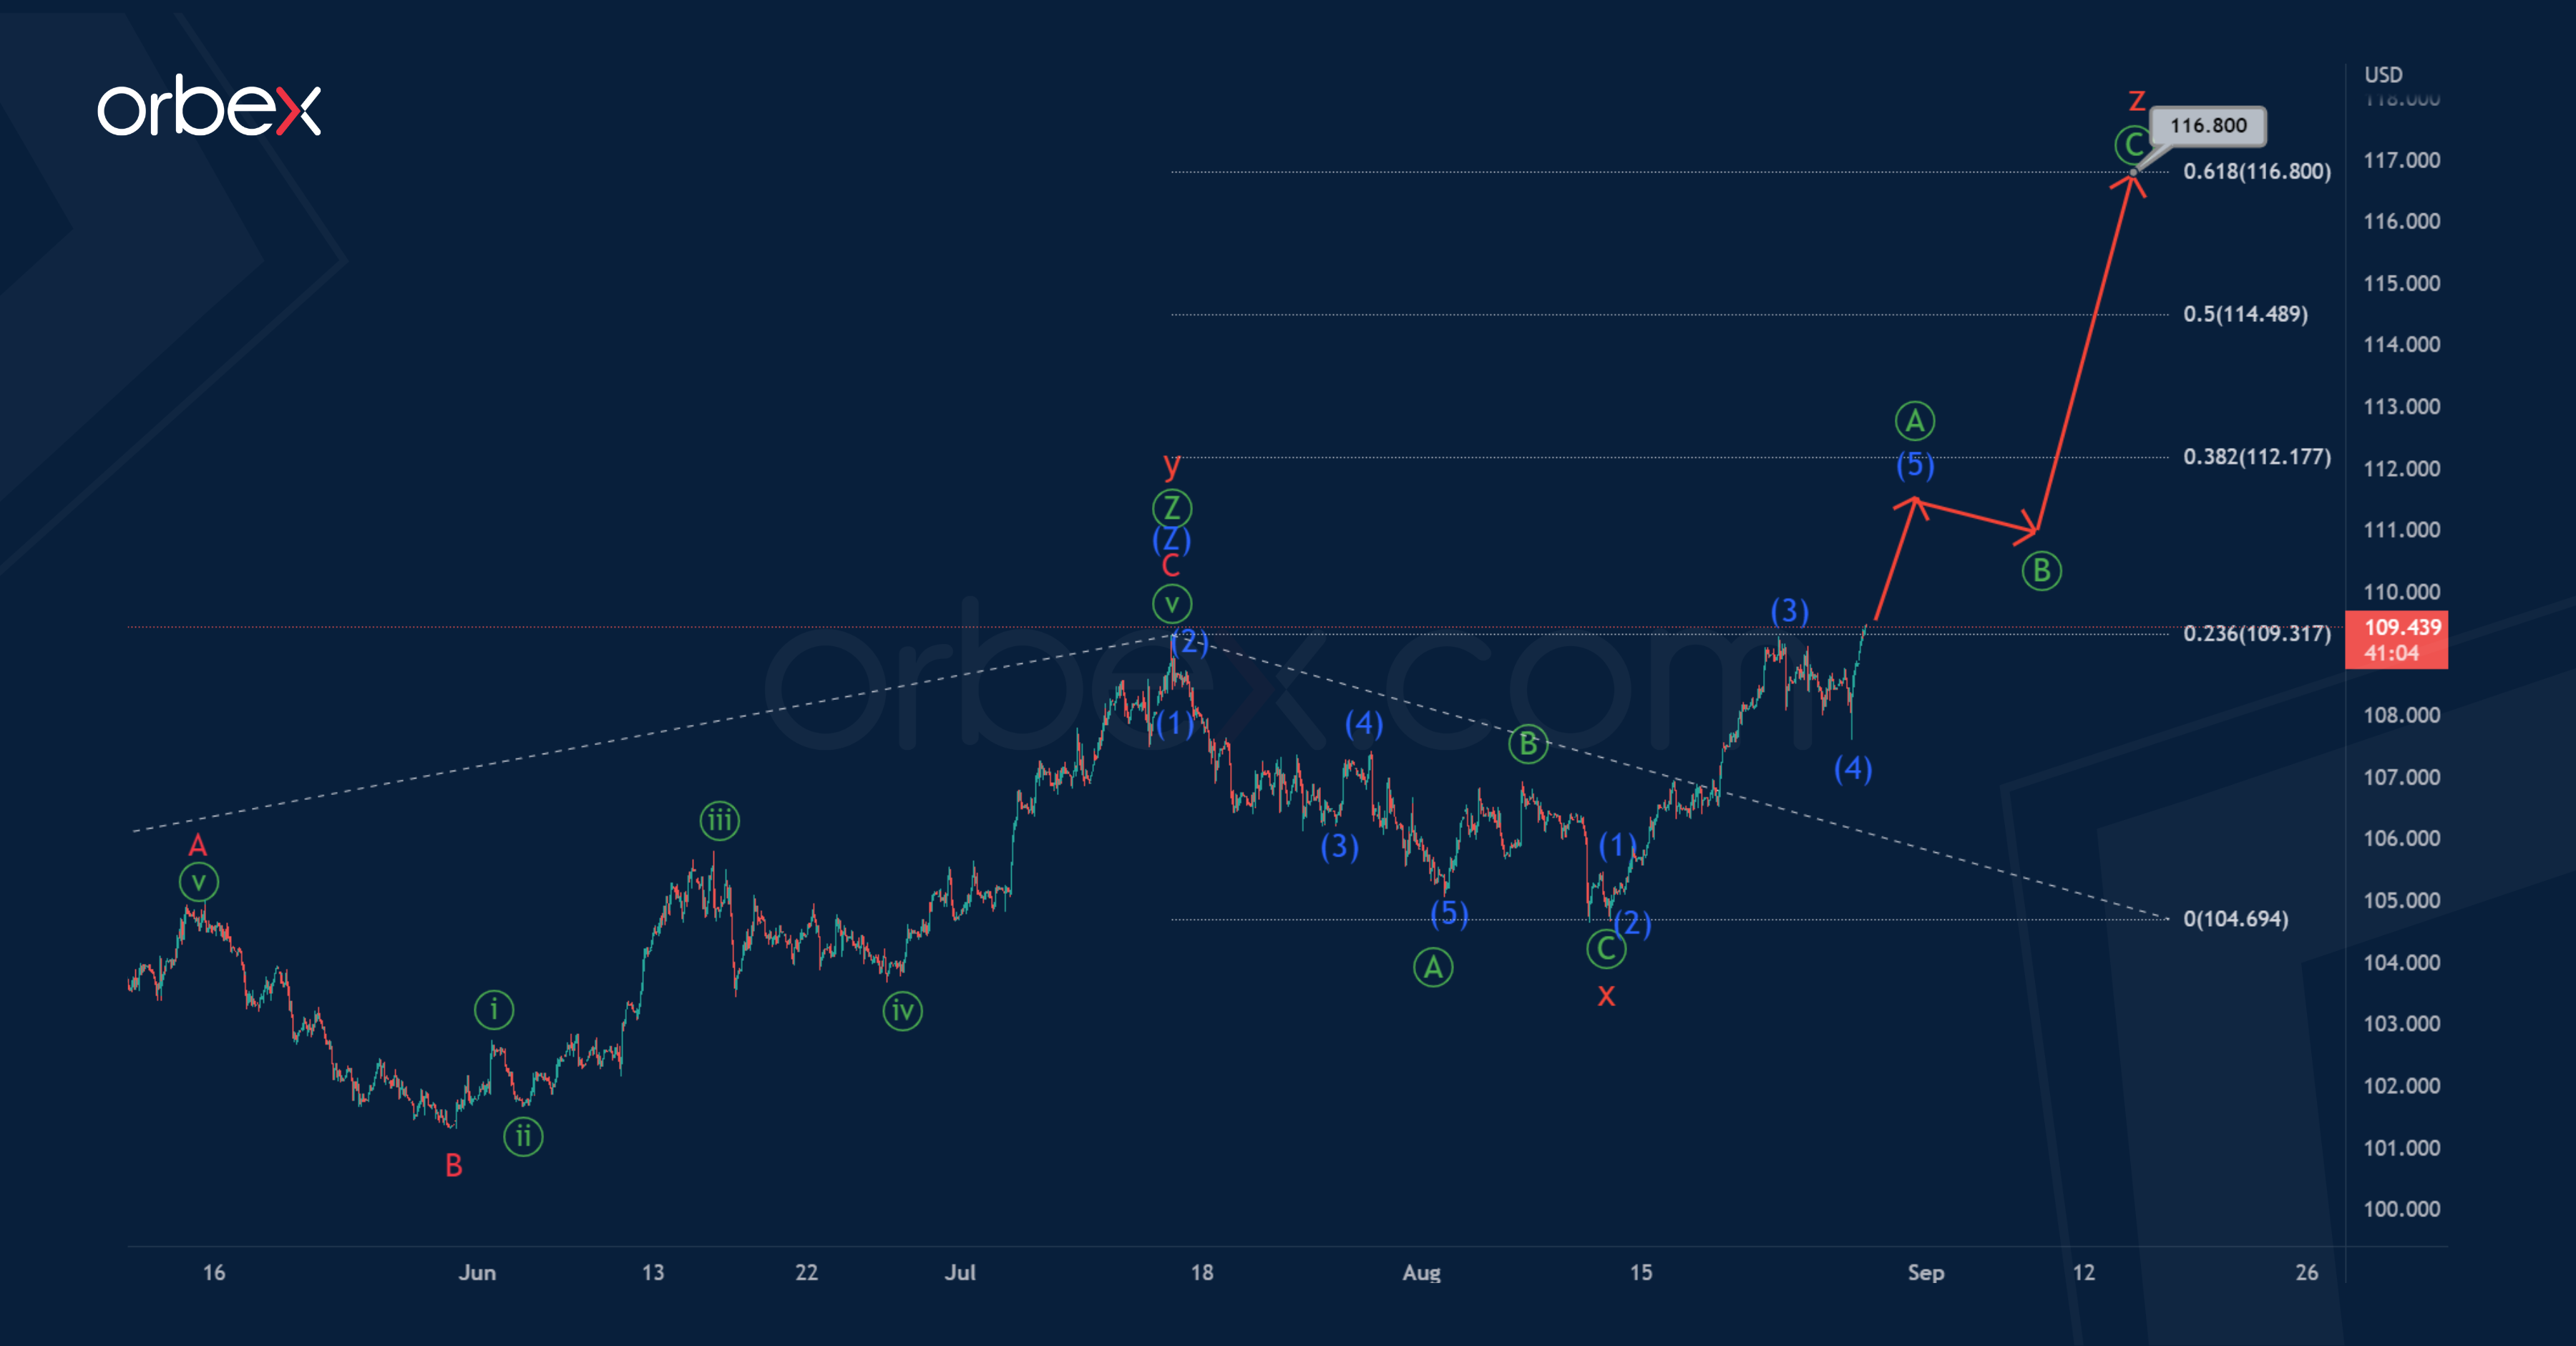
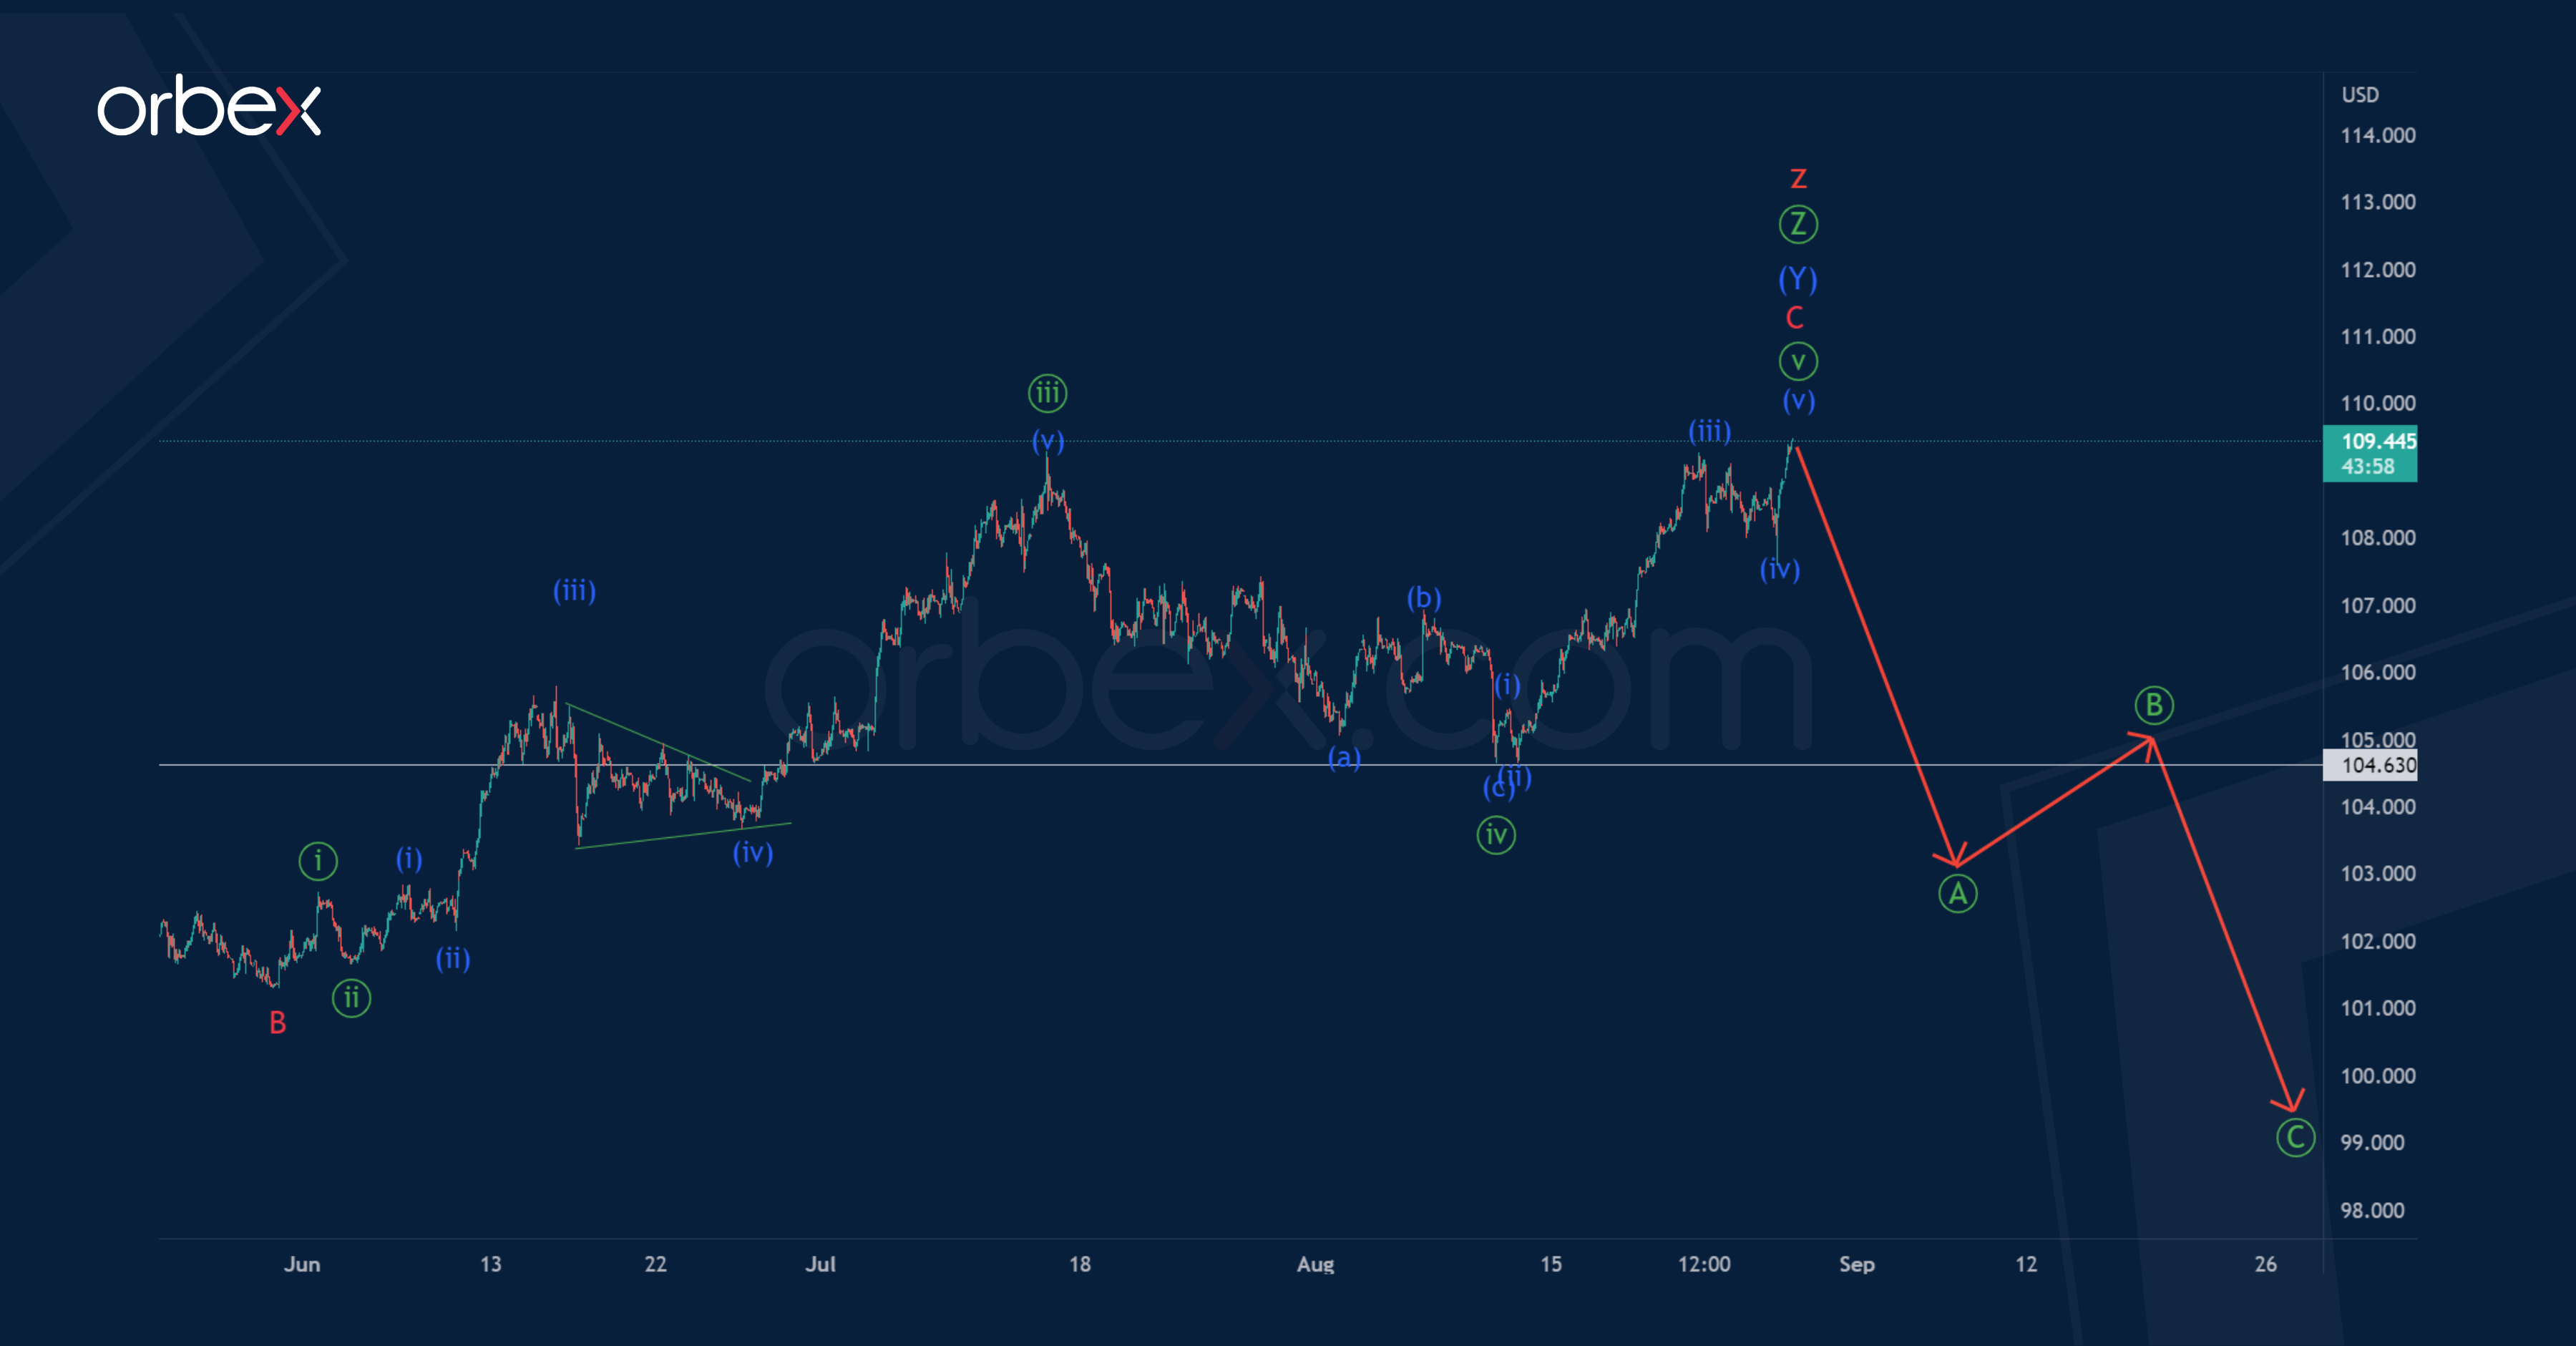
The 1H timeframe of the DXY index suggests the completion of a global corrective trend, which has taken the form of a triple zigzag consisting of five cycle waves w-x-y-x-z.
Thus, the market is currently at the stage of reversal, that is, the formation of the initial part of a new bearish trend may soon begin.
It is assumed that the bears are starting to build the first impulse sub-wave of the potential standard zigzag. The end of the impulse is possible just below the minimum of 104.63, which is marked by a minute fourth correction.
An approximate scheme of possible future movement is shown on the chart.
In an alternative scenario, the formation of a cycle triple zigzag is not yet fully completed.
Most likely, at the level of 104.69, the bearish cycle wave x was completed, which took the form of a standard zigzag of the primary degree. Then the market turned around, and an upward impulse price movement began in the initial part of the wave z.
The wave z can take the form of a zigzag, and now a sub-wave is being formed.
The entire wave z may complete its pattern near 116.80. At that level, it will be at the 61.8% Fibonacci extension of wave y.