Sample Category Title
GBP/JPY Daily Outlook
Daily Pivots: (S1) 160.24; (P) 161.12; (R1) 162.80; More...
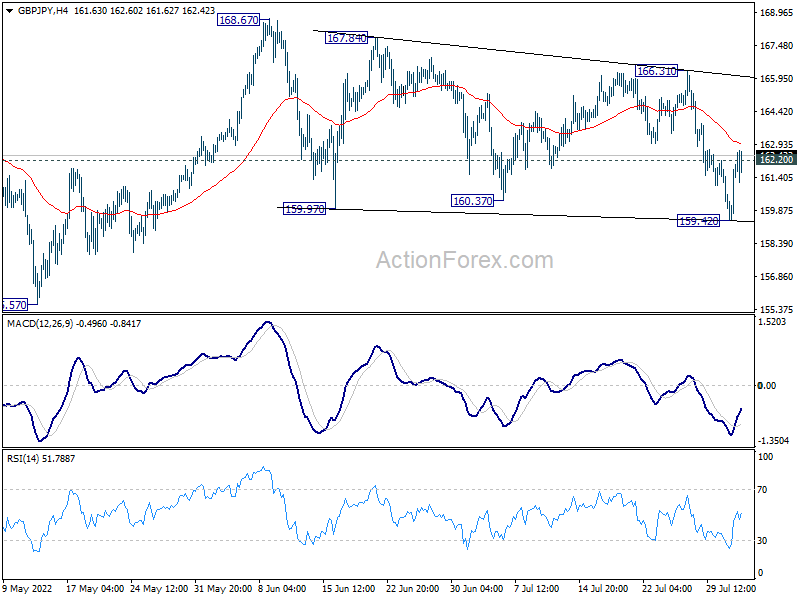
GBP/JPY recovered notably after dipping to 159.42 and intraday bias is turned neutral first. Sideway consolidation from 168.67 could extend further. Break of 166.31 resistance will be the first sign of up trend resumption. meanwhile, break of 159.42 will bring deeper fall towards 155.57 support next.
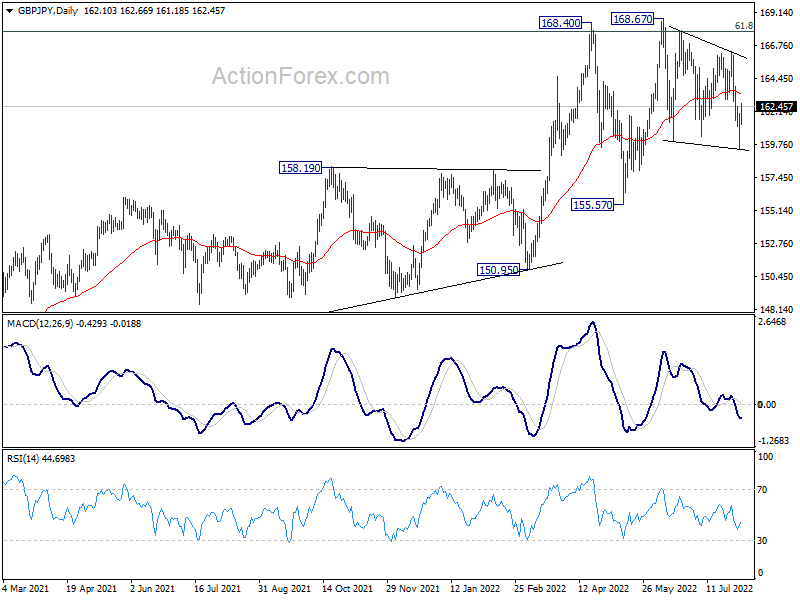
In the bigger picture, up trend from 123.94 (2020 low) is still in progress. Sustained break of 61.8% retracement of 195.86 (2015 high) to 122.75 (2016 low) at 167.93 will be a long term bullish signal, and could pave the way back to 195.86 high. This will now remain the favored case as long as 155.57 support holds, even in case of deep pull back.
EUR/JPY Daily Outlook
Daily Pivots: (S1) 134.03; (P) 134.72; (R1) 136.04; More....
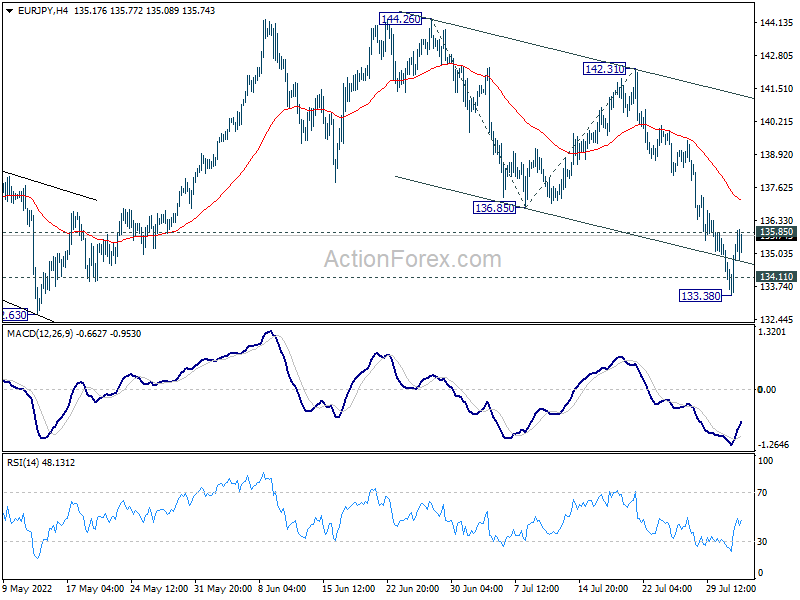
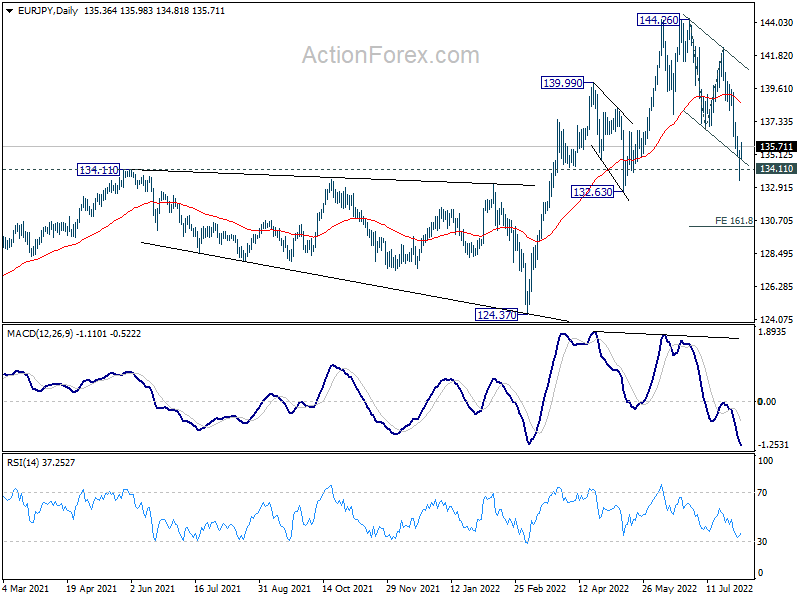
EUR/JPY recovers notably after dipping to 133.38, and drawing support from 134.11. Intraday bias is turned neutral first. Firm break of 135.85 will indicate short term bottoming and turn bias back tot he upside for stronger rebound. However, sustained break of 134.11 will carry larger bearish implications and target 161.8% projection of 144.26 to 136.85 from 142.31 at 130.32.
In the bigger picture, up trend from 114.42 (2020 low) is seen as the third leg of the pattern from 109.30 (2016 low). Further rally is in favor as long as 134.11 resistance turned support holds, even in case of deep pull back. Next target is 149.76 (2015 high). However, sustained break of 134.11 will be a sign of medium term bearish reversal and turn focus to 124.37 support for confirmation.
EUR/GBP Daily Outlook
Daily Pivots: (S1) 0.8333; (P) 0.8366; (R1) 0.8393; More...
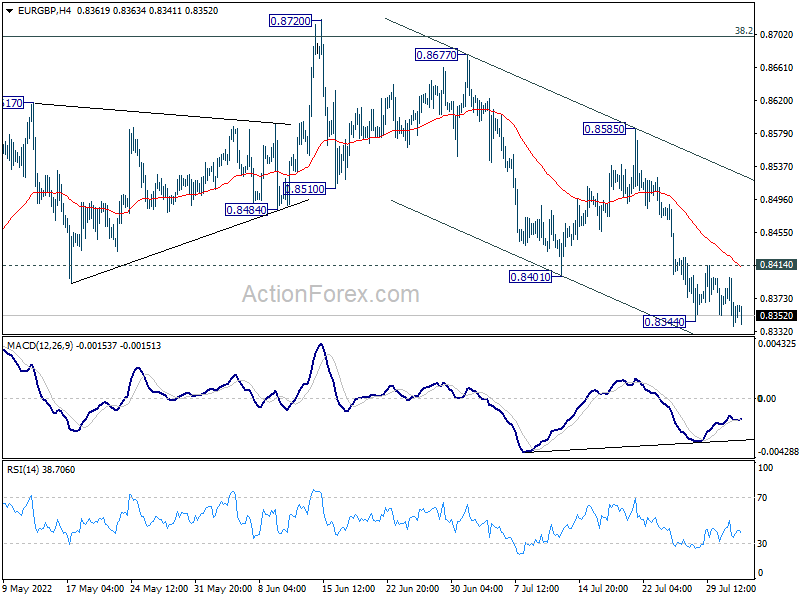
EUR/GBP's decline resumes after brief consolidation and intraday bias back on the downside. Current fall from 0.8720 should target a retest on 0.8201 low. On the upside, above 0.8414 minor resistance will turn intraday bias neutral again. But outlook will stays cautiously bearish as long as 0.8585 resistance holds.
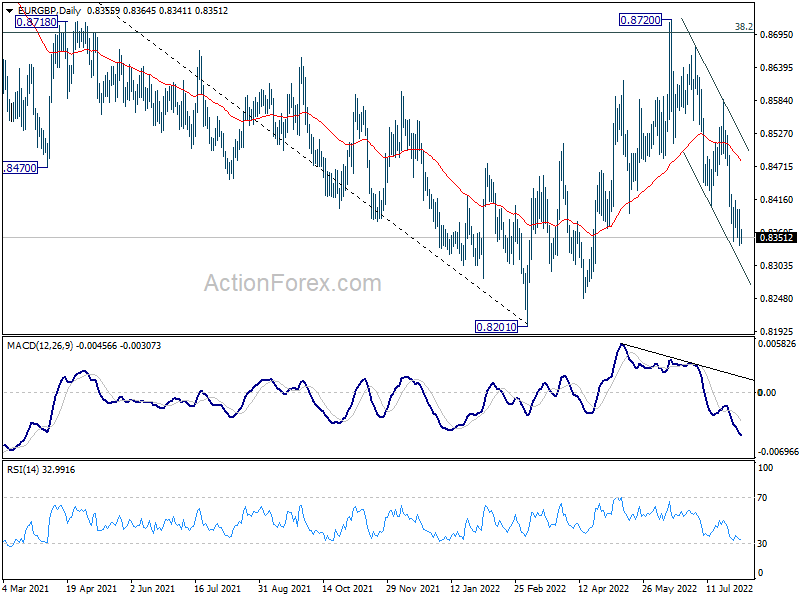
In the bigger picture, current development suggests rejection by 38.2% retracement of 0.9499 to 0.8201 at 0.8697. Medium term term bearishness is maintained. Break of 0.8201 will resume larger down trend from 0.9499 (2020 high). Nevertheless, sustained break of 0.8697 will affirm the case that rise from 0.8201 is a medium term up trend itself.
EUR/AUD Daily Outlook
Daily Pivots: (S1) 1.4591; (P) 1.4699; (R1) 1.4801; More...
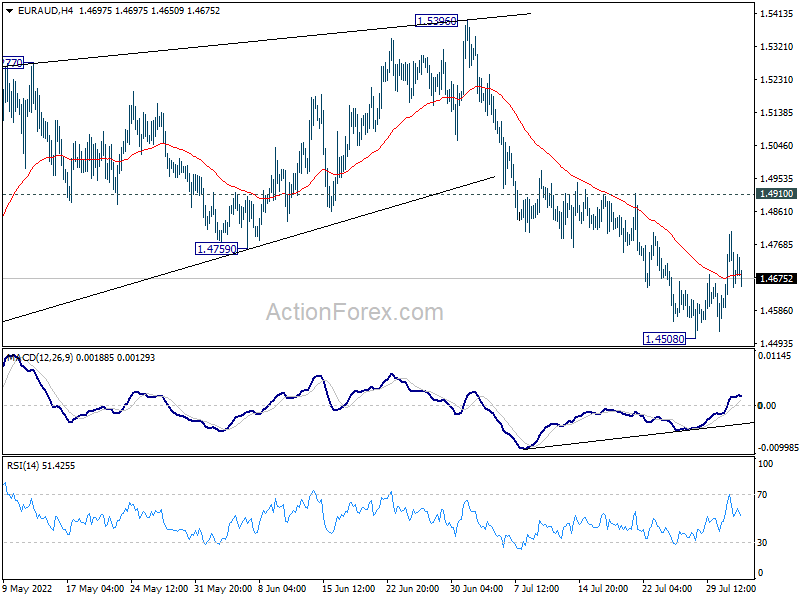
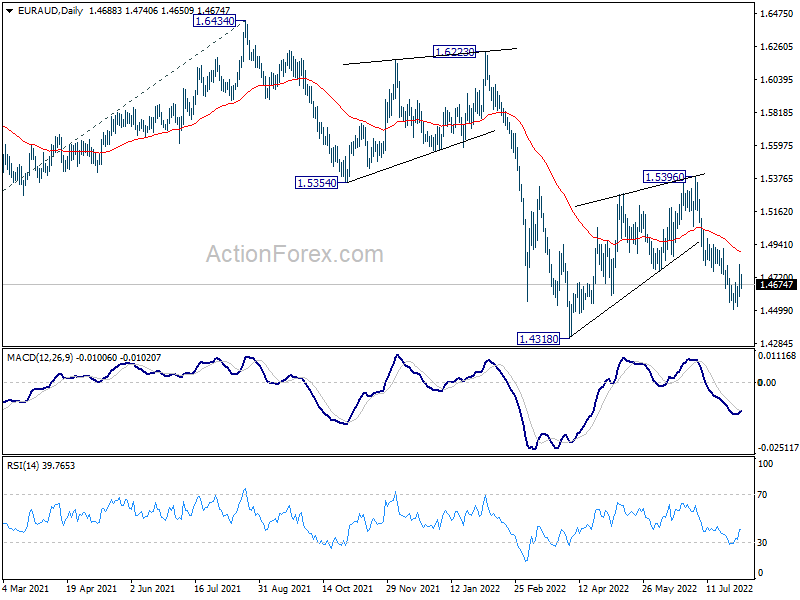
Intraday bias EUR/AUD is turned neutral again at this lost momentum after failing to sustain above 4 hour 55 EMA. While stronger recovery cannot be ruled out, upside should be limited below 1.4910 resistance to bring fall resumption. On the downside, break the 1.4508 will resume the decline from 1.5396 to retest 1.4318 low. However, firm break of 1.4910 will dampen this bearish view and bring stronger rally.
In the bigger picture, rejection by 1.5354 support turned resistance, as well as 55 week EMA (now at 1.5378), maintain medium term bearishness. That is, larger down trend from 1.9799 is not completed yet. Break of 1.4318 low will target 61.8% projection of 1.9799 to 1.5250 from 1.6434 at 1.3623, which is close to 1.3624 long term support (2017 low). This will remain the favored case now as long as 1.5396 resistance holds.
EUR/CHF Daily Outlook
Daily Pivots: (S1) 0.9715; (P) 0.9739; (R1) 0.9758; More....
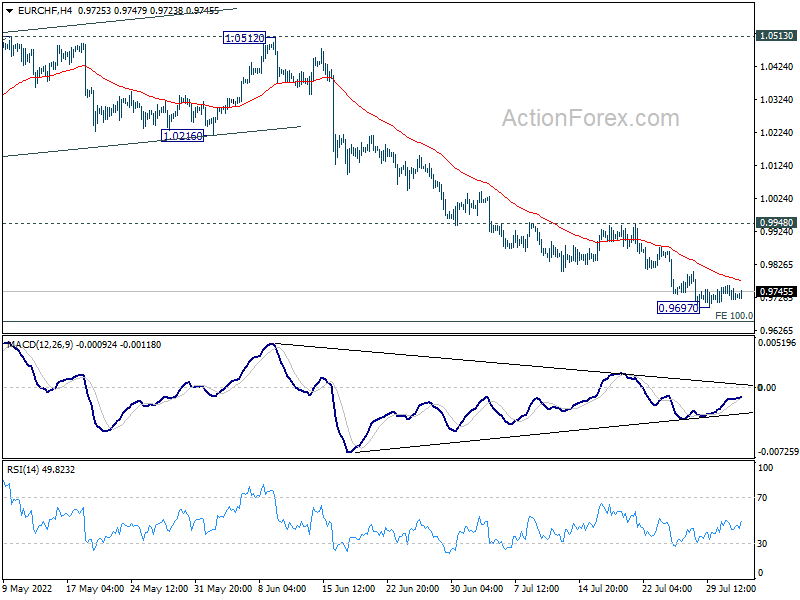
EUR/CHF is staying in consolidation above 0.9697 temporary low and intraday bias remains neutral. While further fall cannot be ruled out, some support might be seen from 0.9650 long term projection level to bring rebound. Break of 0.9948 resistance will indicate short term bottoming. nevertheless, firm break of 0.9650 will target 100% projection of 1.1149 to 0.9970 from 1.0513 at 0.9334.
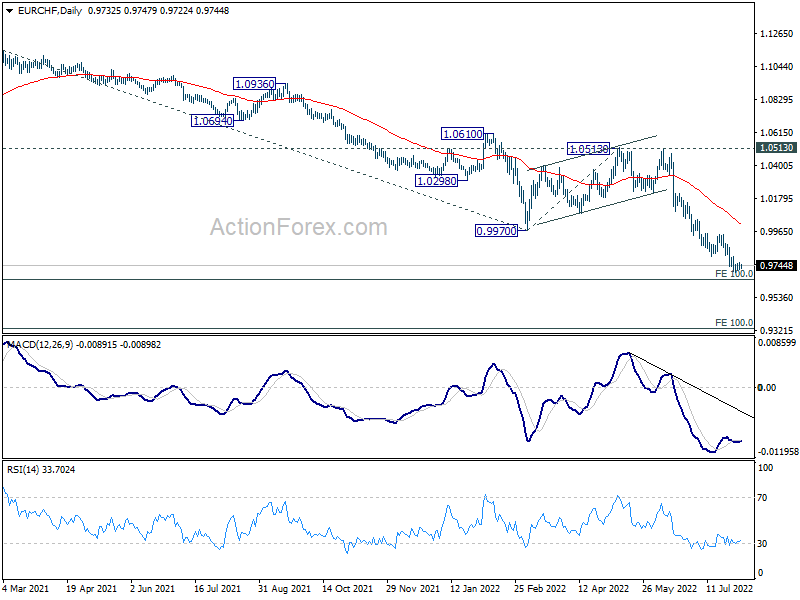
In the bigger picture, long term down trend from 1.2004 (2018 high) is expected to target 100% projection of 1.2004 to 1.0505 to 1.1149 at 0.9650. Firm break there will target 138.2% projection at 0.9033. On the upside, break of 1.0513 resistance is needed to indicate medium term bottoming. Otherwise, outlook will stay bearish in case of strong rebound.
USD/CAD Daily Outlook
Daily Pivots: (S1) 1.2847; (P) 1.2867; (R1) 1.2900; More...
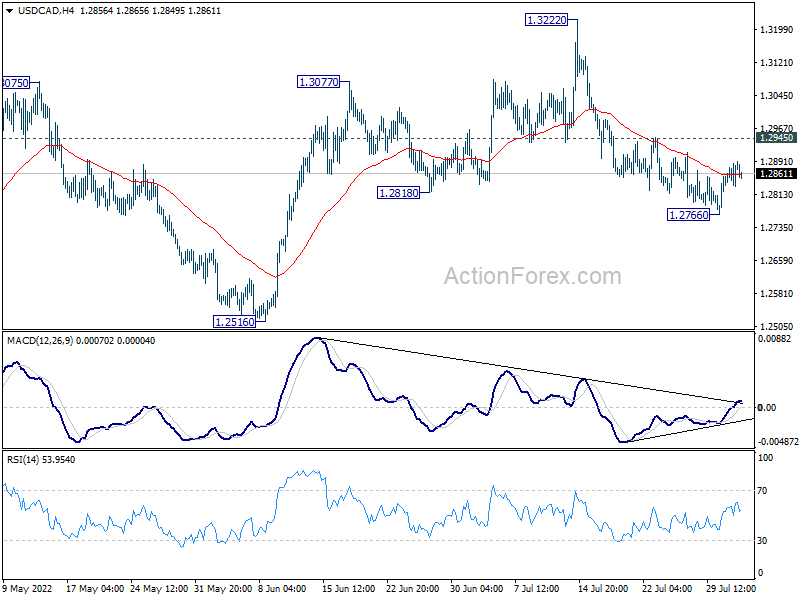
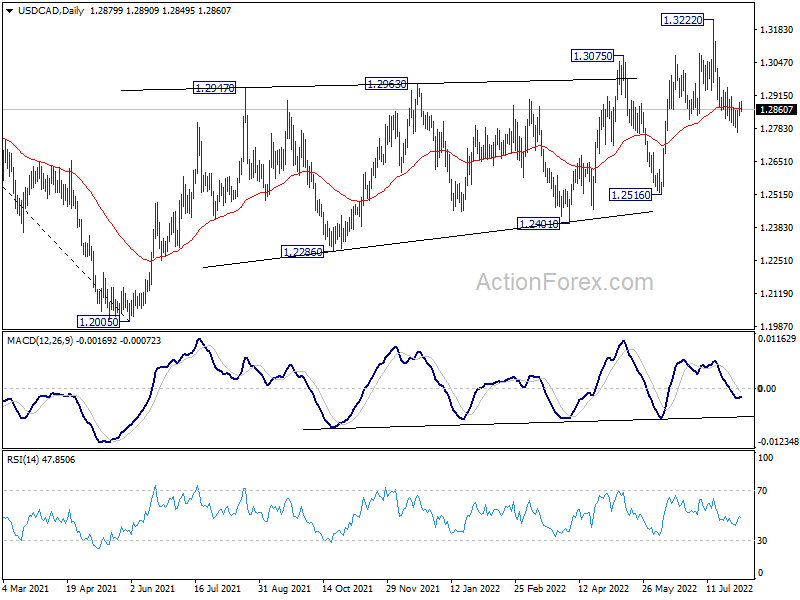
Intraday bias in USD/CAD remains neutral at this point. Further decline is mildly in favor with 1.2945 minor resistance intact. Below 1.2766 will resume the fall from 1.3222 to 1.2818 support next. On the upside, above 1.2945 minor resistance will revive near term bullishness, and turn bias back to the upside for retesting 1.3222 instead.
In the bigger picture, down trend from 1.4667 (2020 high) should have completed at 1.2005, after defending 1.2061 long term cluster support. Rise from there should target 61.8% retracement of 1.4667 to 1.2005 (2021 low) at 1.3650. This will remain the favored case now as long as 1.2516 support holds.
AUD/USD Daily Report
Daily Pivots: (S1) 0.6877; (P) 0.6955; (R1) 0.6996; More...
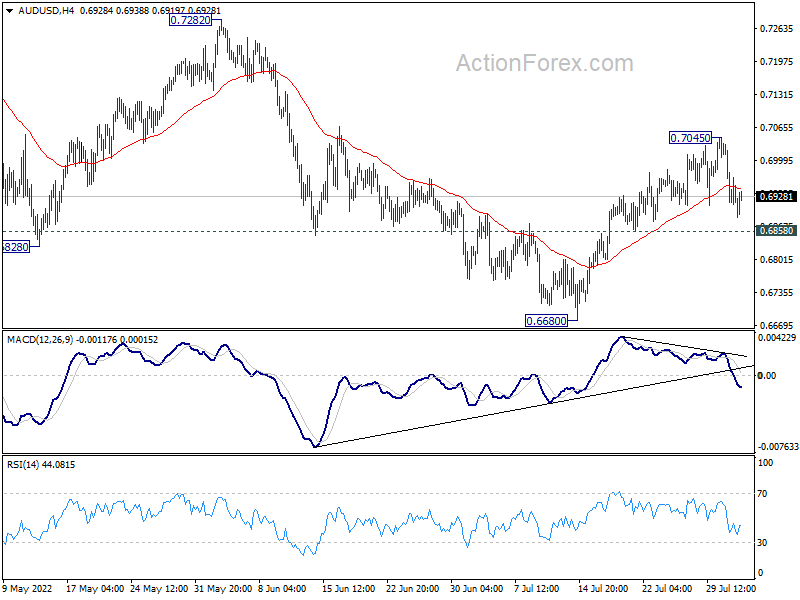
Intraday bias in AUD/USD stays neutral for the moment. On the upside, break of 0.7045 will resume the rebound from 0.6680 to 0.7282 key resistance next. On the downside, however, break of 0.6858 minor support will argue that the rebound is over. Intraday bias will then be back on the downside for retesting 0.6680 low.
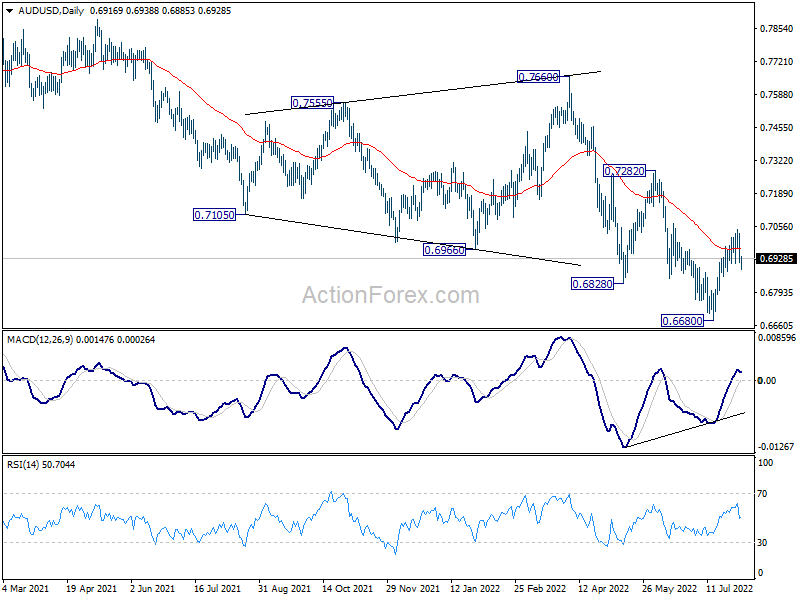
In the bigger picture, price actions from 0.8006 (2021 high) could still be a corrective pattern to rise from 0.5506 (2020 low). But current downside acceleration, as seen in weekly MACD), is raising the chance that it's a bearish impulsive move. In either case, outlook will remain bearish as long as 0.7282 resistance holds. Next target is 61.8% retracement of 0.5506 to 0.8006 at 0.6461.
Dollar Flourished; First on Risk-off, Then as (US) Yields Surged
Markets
Pelosi’s visit to Taiwan provoking the ire of China dominated most of the European trading session. Risky assets including equities were sold while safe havens enjoyed a good bid in your typical risk-off market reaction. However, even before Pelosi’s plane had yet to land on the self-governing island, planned in early US dealings, the market was already going in reverse again. We know (geo)politics have a short shelf-life as market themes, but this is really something else. Anyway, both European and US yields started bottoming out, and fast. Important technical support zones (eg. in the 10y tenors) served as the launching platform. US Treasuries hugely underperformed Bunds following a string of hawkish Fed speeches. Some of the most eye-catching quotes are: “50 bps at the September meeting is reasonable, but 75 bps could also be okay” (Evans), “That’s [price stability] what we’re about, what we’ve been about this year and will continue to be about until we get inflation under control” (Mester), The Fed is “nowhere near” being almost done in fighting worst inflation in four decades (Daly). The hawkish chorus is going directly against the sharp market repricing in recent weeks and triggered a massive bear flattening. US yield rose between 17.9 and 21.8 bps in the 2y/5y sector while adding 9.3 to 17.3 bps in the 10y/30y segment. German/EMU swap yields had to settle for 5bps+, although after having erased intraday losses that were much larger than in the US. Selling pressures were the biggest at the front end of the curve. Equities looked for a bottom as tensions on markets eased but the move was countered by the sudden rise in core bond yields. European shares dropped 0.6%, losses on WS went as high as 1.23% (DJI). The dollar flourished; first on risk-off, then as (US) yields surged. DXY rebounded of the 105 support to 106.24. EUR/USD slipped below 1.02 again. The yen traded both market episodes textbook-wise. Its initial strengthening move thus reversed abruptly, with USD/JPY leaving intraday lows around 130 for a close at 133.18. EUR/JPY completely erased a sharp drop below 135.
The Taiwan trip is still at the center stage during today’s Asian session. Pelosi in a press conference said the US stands by Taiwan and hinted at an imminent trade agreement. Meanwhile, China responded with military drill exercises nearby, has banned imports from and exports to Taiwan of several products and banned dealings with some entities. Unlike yesterday though, stock markets shrug. They print mostly higher, even. USD/CNY eases further to 6.75. It suggests that, barring China announces very aggressive countermeasures, markets look ready to ditch it as a trading theme already. This brings us to the eco calendar for today with the US services ISM as the highlight. The PMI equivalent two weeks ago shocked by dropping below 50 and brings downside risks for the ISM (expected at 53.5 from 55.3). That said, yesterday’s core bond moves suggest that a lot of bad (recession) news has been discounted and we could see more reality checks in coming days (eg. payrolls on Friday). Furthermore, we note that the likes of Mester yesterday indicated willingness to sacrifice growth and that it isn’t a good enough reason to back down on the commitment of bringing down inflation. US (in those in Europe in sympathy) yields’ downside looks a bit better protected now, especially at the front end of the curve. This in turn could also help find a bottom for the dollar after having corrected lower these last weeks. There’s another flurry of Fed speeches scheduled for today as well which are worth following up. We wouldn’t be surprised to see some more verbal interventions.
News Headlines
China’s services PMI unexpectedly jumped in July to the highest level since April 2021. Coming in at 55.5 it beat expectations for a decline from 54.5 to 53.9. The sector enjoyed tailwinds from easing Covid restrictions and a return to more normal business conditions. New orders rose at a faster pace, highlighting mainly increased domestic demand. Chinese service companies maintain a relatively cautious approach to staffing level though and backlogs fell. Nevertheless, the 12-month outlook was assessed as being the brightest since November 2021. Combined with the bigger-than-expected drop in the manufacturing gauge published earlier this week, the composite reading stood at 54, down from 55.3 in June.
Elliott Wave View: Dollar Index (DXY) Resumes Higher
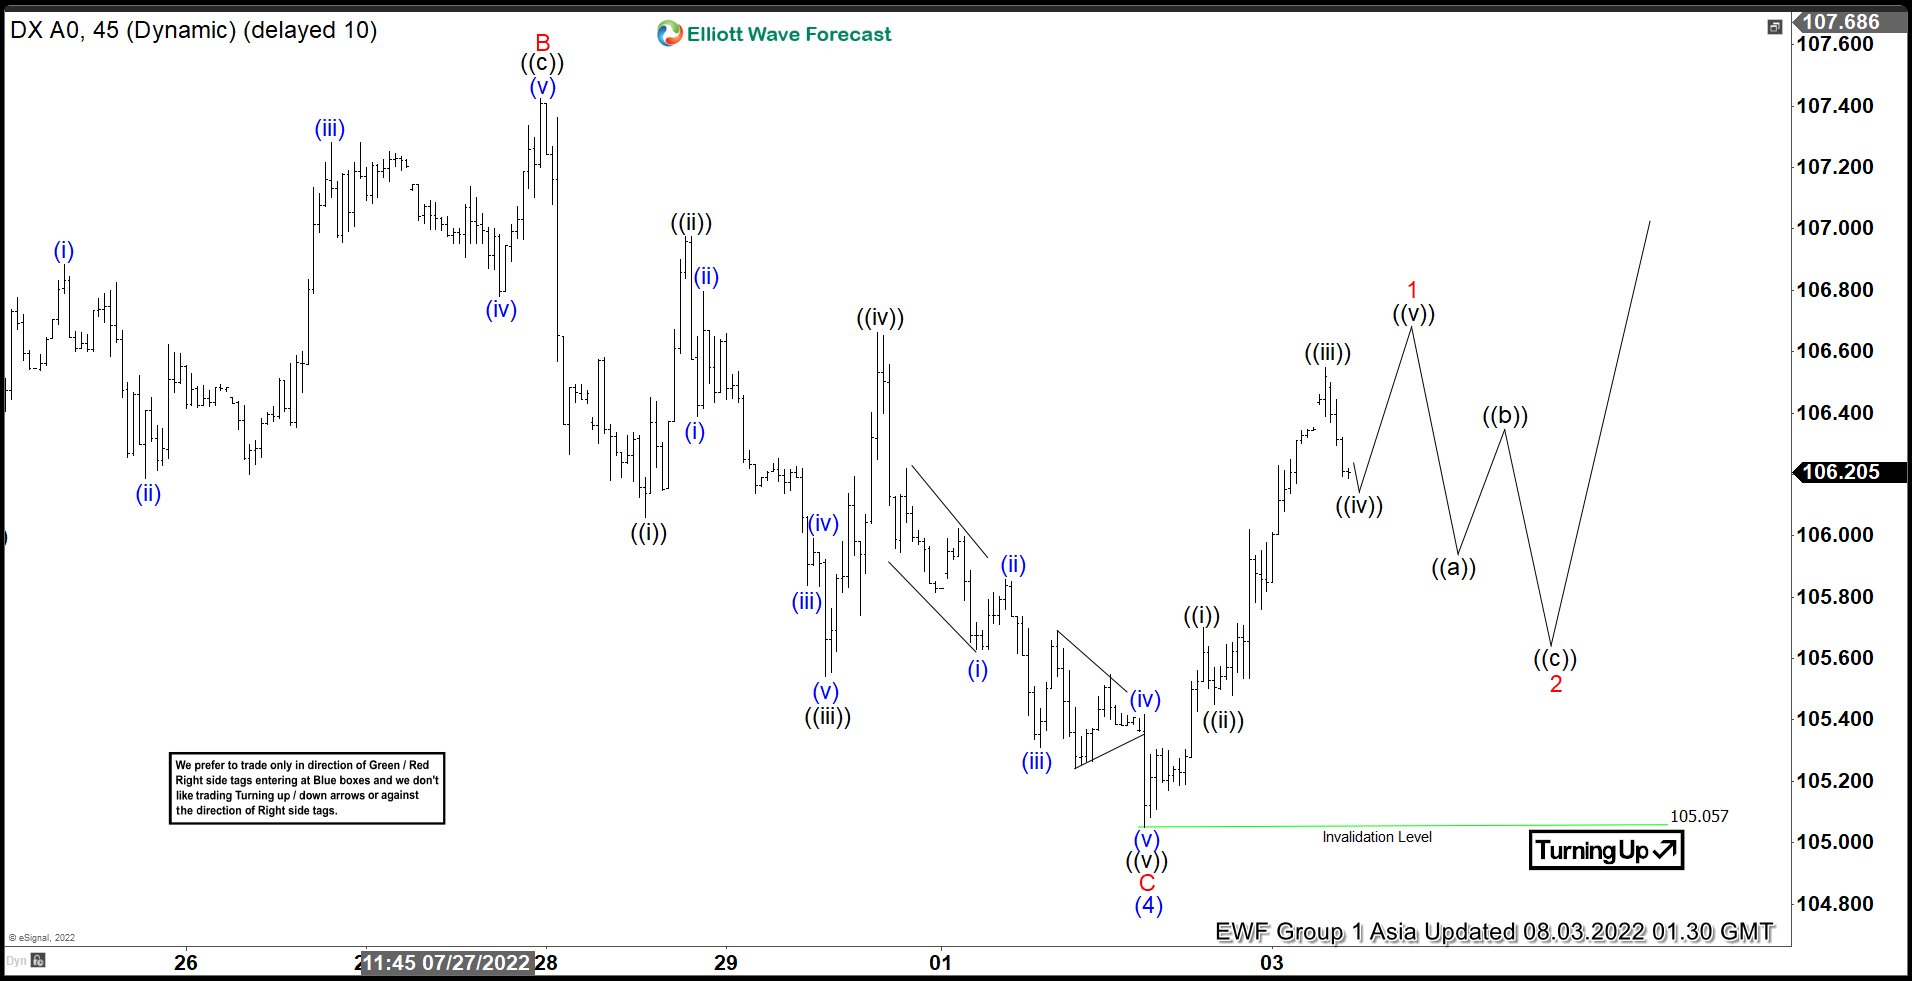
Short Term Elliott Wave view in Dollar Index (DXY) suggests rally to 109.29 on 7.14.2022 peak ended wave (3). Pullback in wave (4) ended at 105.05 with internal subdivision as a zigzag Elliott Wave structure. Down from wave (3), wave A ended at 106.38. Wave B rally ended at 107.42. The Index then resumes lower in wave C which ended at 105.05. The 45 minutes chart below shows the internal subdivision of wave C in 5 waves. Down from wave B, wave ((i)) ended at 106.06, and rally in wave ((ii)) ended at 106.975.
Index resumes lower in wave ((iii)) towards 105.54, and rally in wave ((iv)) ended at 106.66. Final leg lower wave ((v)) ended at 105.05 which completed wave C of (4). The Index has turned higher in wave (5), but it still needs to break above the previous wave (3) peak at 109.29 to rule out a double correction. Up from wave (4), wave ((i)) ended at 105.7 and dips in wave ((ii)) ended at 105.45. Index then resumes higher in wave ((iii)) towards 106.55. Expect the Index to extend higher 1 more time to complete wave ((v)) of 1, then it should pullback in wave 2 to correct cycle from 8/2/2022 low before the next leg higher. As far as pivot at 105.05 low stays intact, expect dips to find support in 3, 7, or 11 swing for further upside.
$DXY 45 Minutes Elliott Wave Chart
UK 100 Consolidates
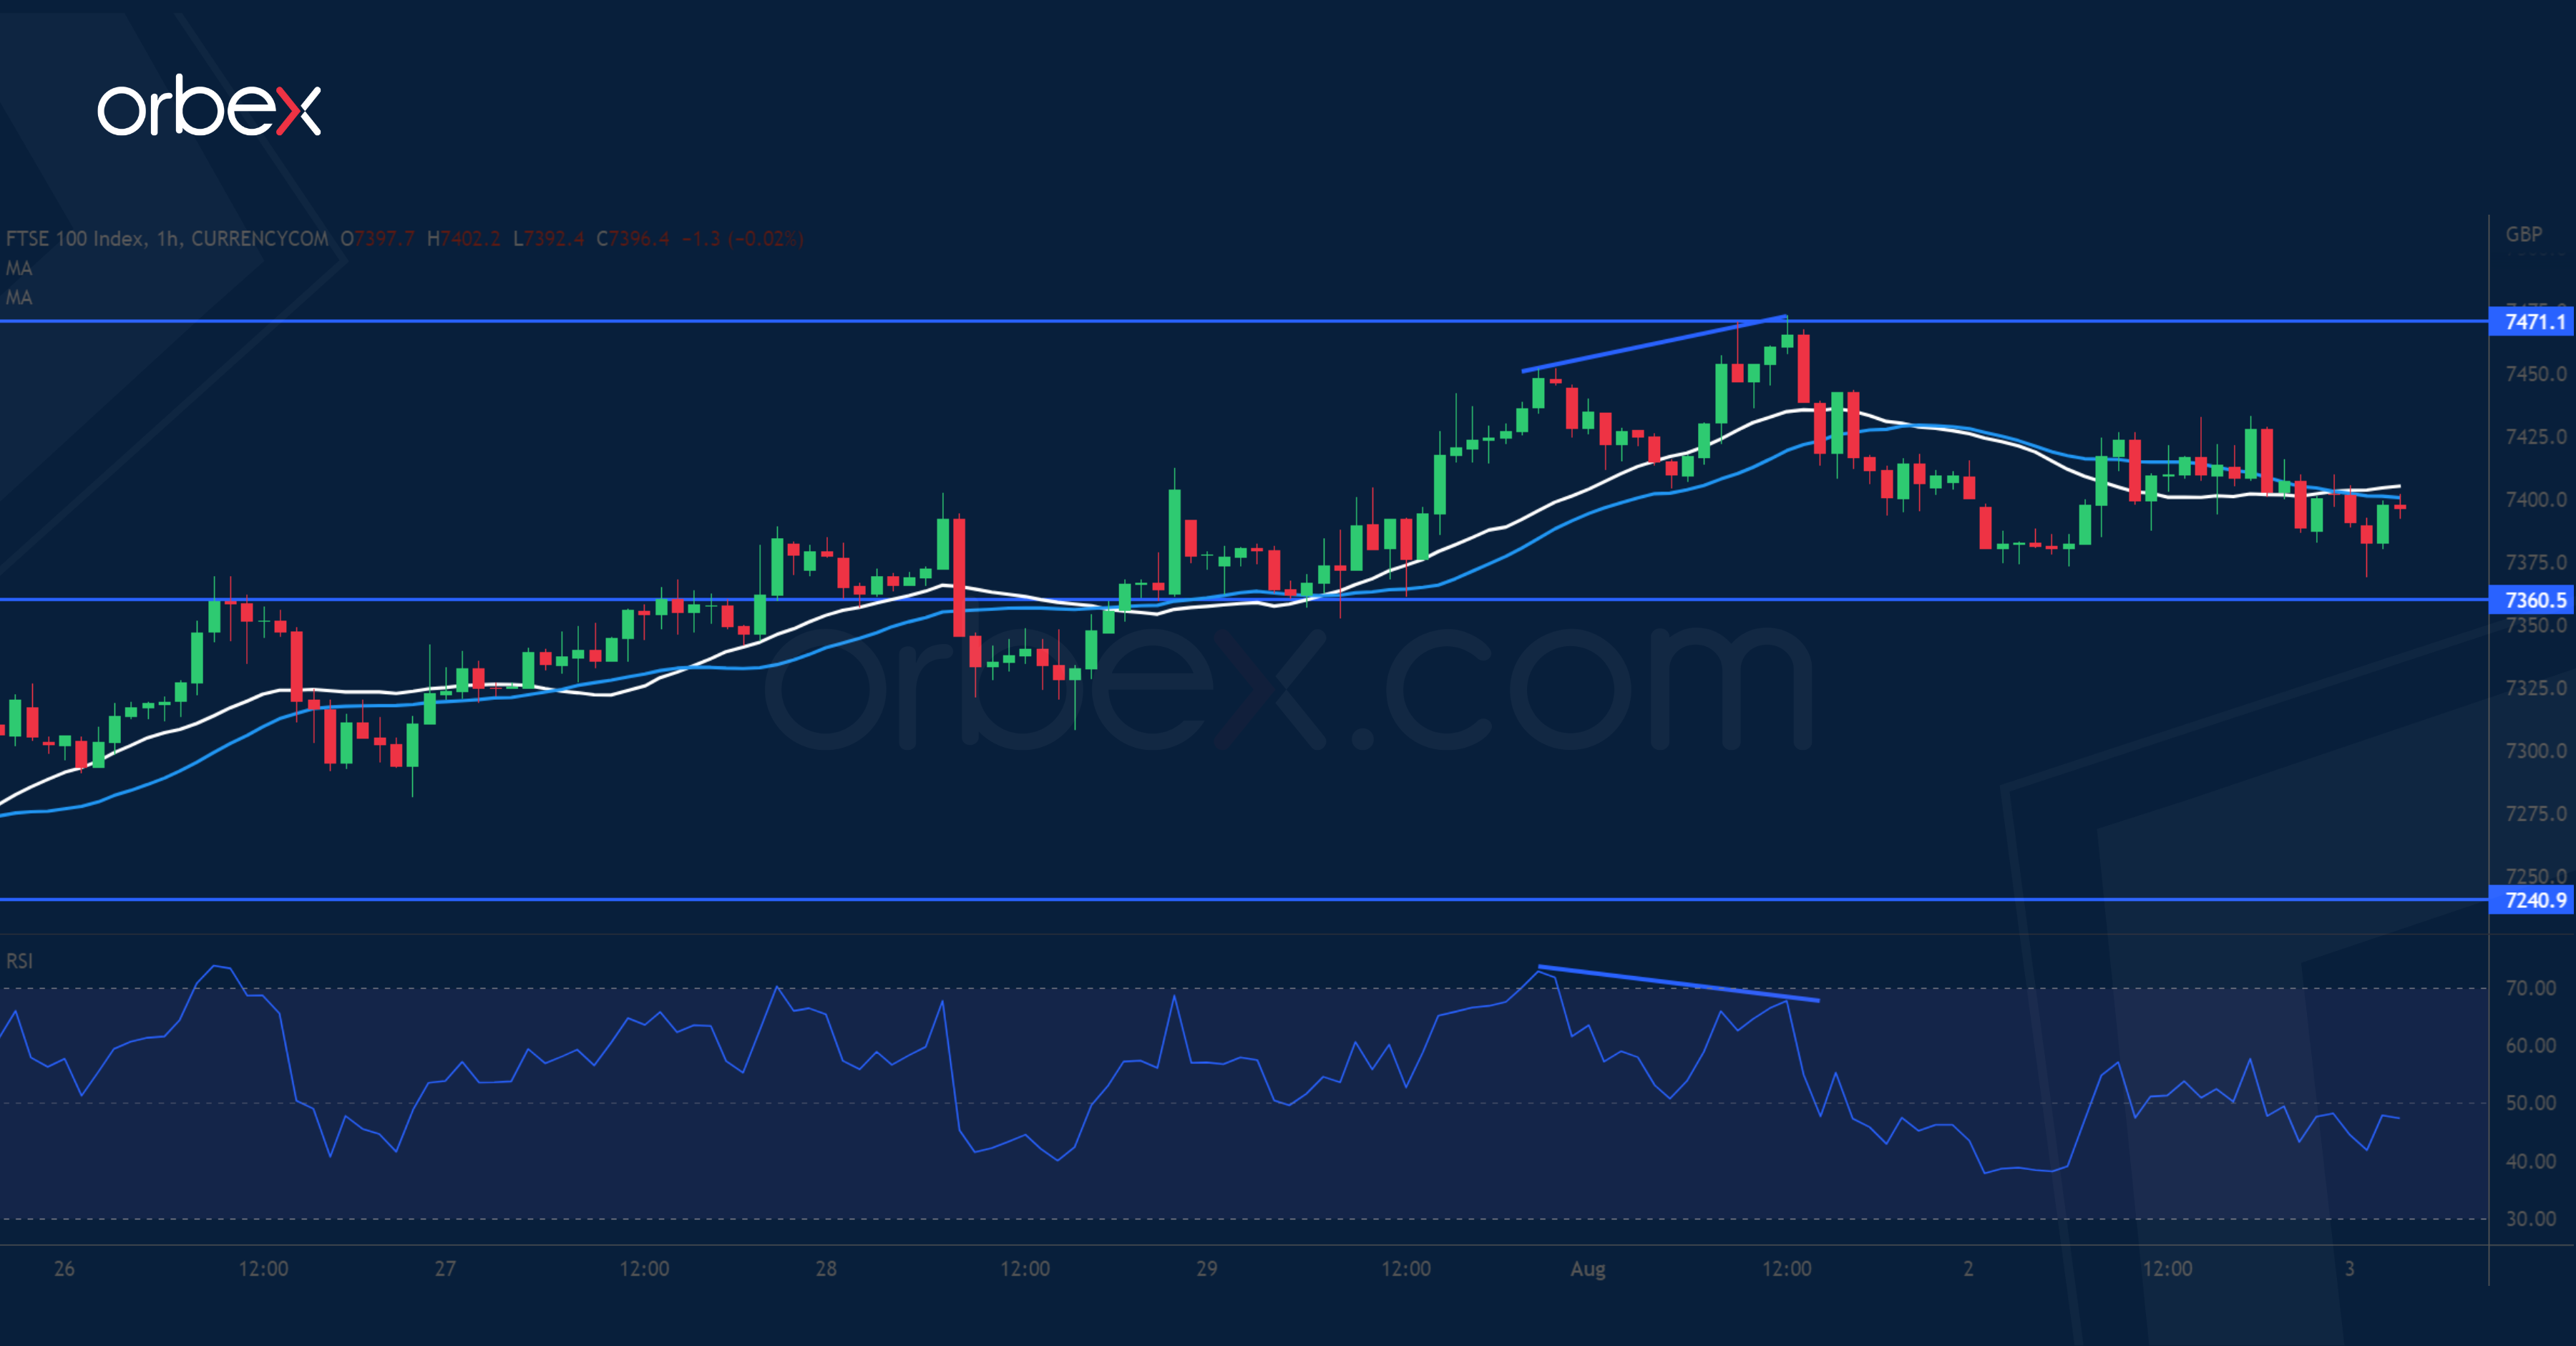
Equity markets tread water amid US-China tensions over Taiwan. The FTSE is testing the supply zone (7470) at the start of a previous liquidation in early June. A bearish RSI divergence is a sign of over-extension and the rally could use some breathing room. 7360 is the first support and its break would force more buyers to bail out, triggering a sell-off to 7240, which is a critical level to keep the current rebound intact. On the upside, a close above 7470 would resume the recovery towards the triple top on the daily chart (7640).