Sample Category Title
Germany Ifo dropped to 88.6, on the cusp of recession
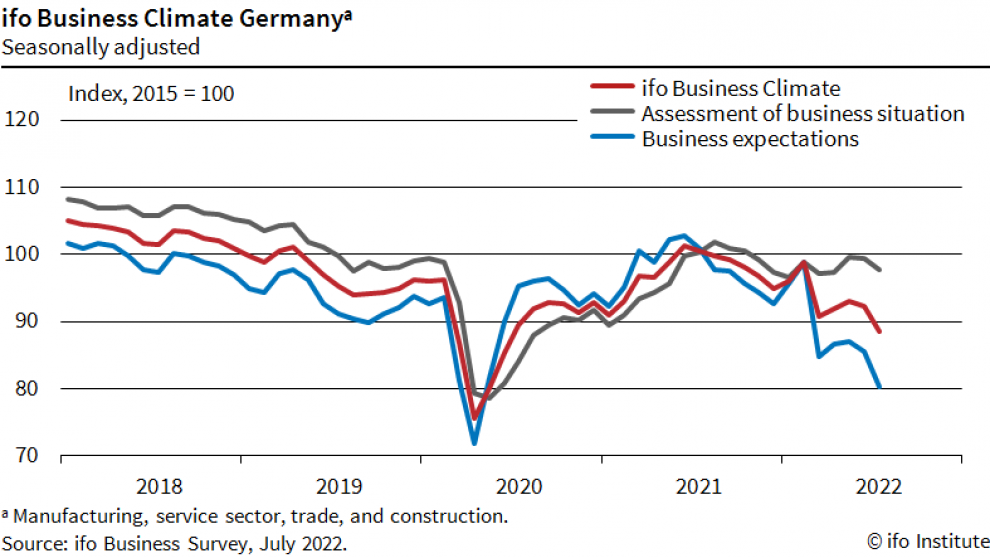
Germany Ifo Business Climate Dropped from 92.2 to 88.6 in July, below expectation of 90.5. That's the lowest level since June 2020. Current Assessment index dropped from 99.4 to 97.7, below expectation of 98.2. Expectations index dropped from 85.5 to 80.3, below expectation of 83.0.
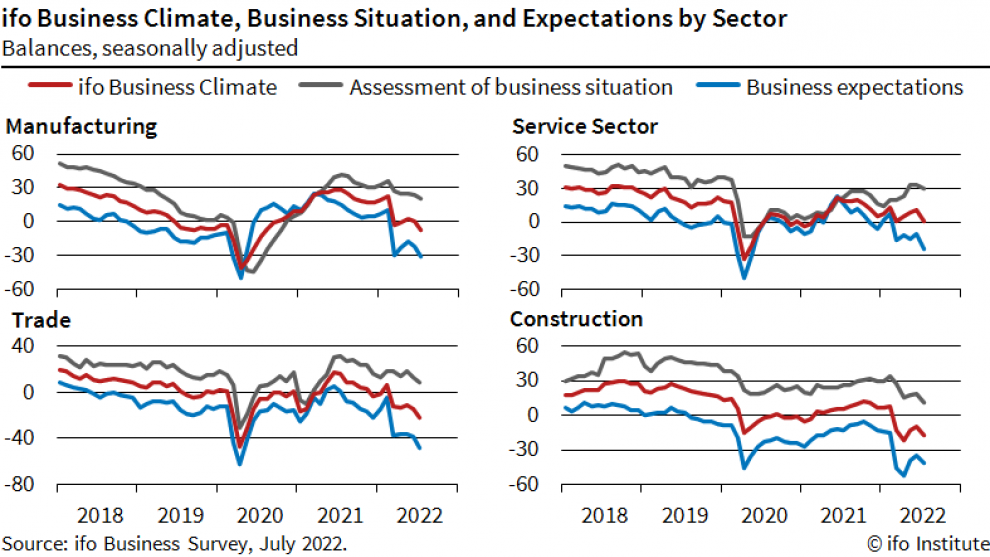
By sector, manufacturing dropped from 0 to -7.1. Services dropped from 10.9 to 0.9. Trade dropped from -14.7 to -21.6. Construction dropped from -9.7 to -17.0.
Ifo said: "Companies are expecting business to become much more difficult in the coming months. They were also less satisfied with their current situation. Higher energy prices and the threat of a gas shortage are weighing on the economy. Germany is on the cusp of a recession."
GBP/JPY Daily Outlook
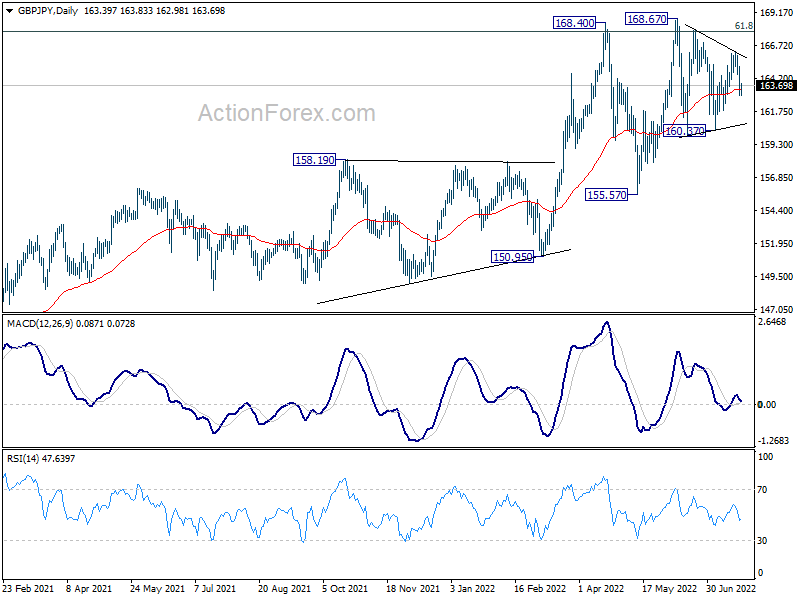
Daily Pivots: (S1) 162.55; (P) 163.85; (R1) 164.69; More...
Intraday bias in GBP/JPY remains mildly on the downside at this point. Corrective pattern from 168.67 is extending with another falling leg. Initial bias is mildly on the downside this week for 160.37 support. On the upside, above 165.13 minor resistance will turn bias back to the upside for 166.23 resistance again.
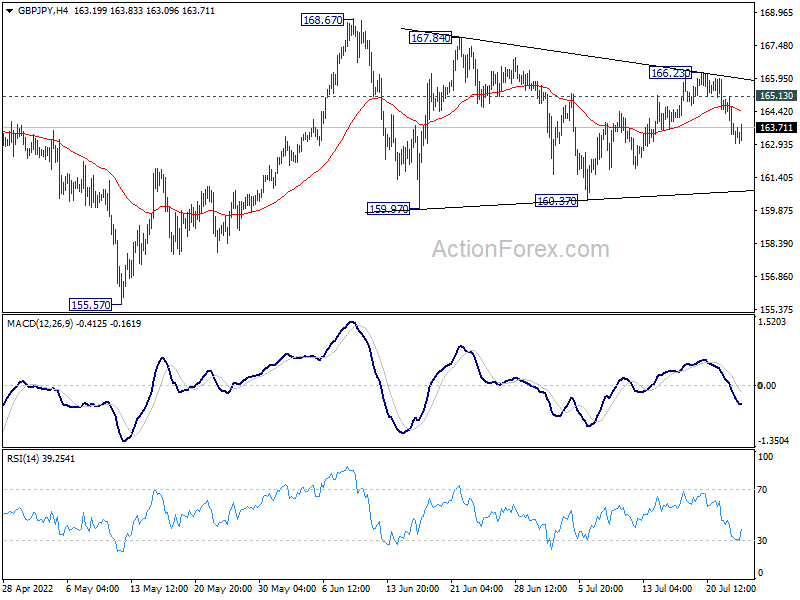
In the bigger picture, up trend from 123.94 (2020 low) is still in progress. Sustained break of 61.8% retracement of 195.86 (2015 high) to 122.75 (2016 low) at 167.93 will be a long term bullish signal, and could pave the way back to 195.86 high. This will now remain the favored case as long as 155.57 support holds, even in case of deep pull back.
EUR/JPY Daily Outlook
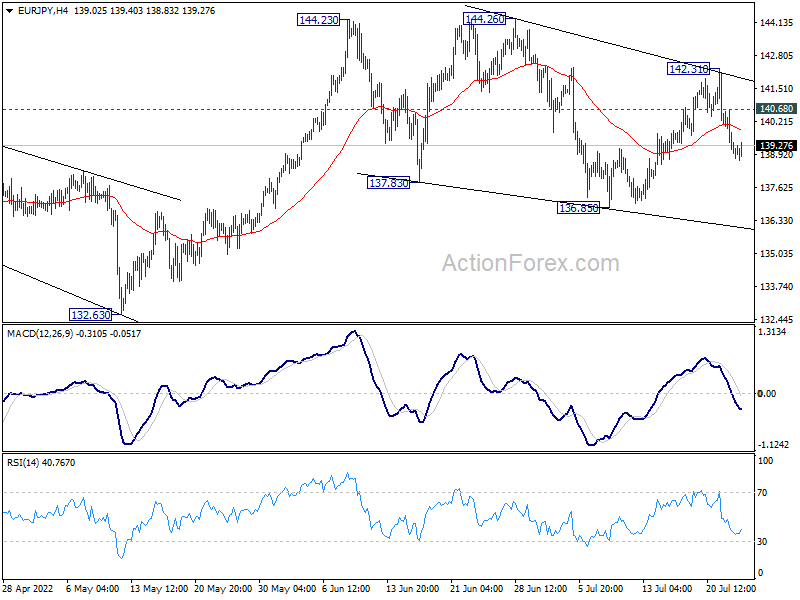
Daily Pivots: (S1) 138.26; (P) 139.48; (R1) 140.17; More....
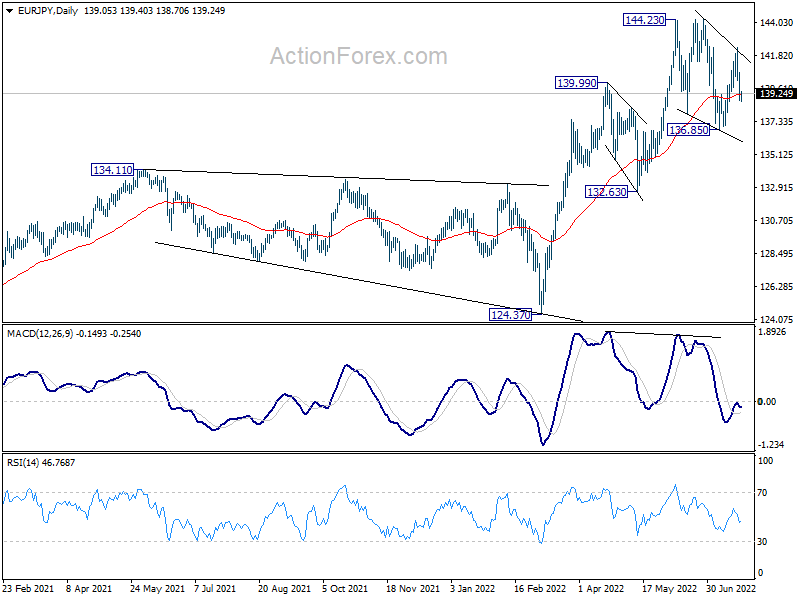
Intraday bias in EUR/JPY stays mildly on the downside at this point. Corrective pattern from 144.23 is extending with another falling leg. Deeper decline would be seen to 136.85 support. On the upside, above 140.68 minor resistance will turn bias back to the upside for 142.31 resistance instead.
In the bigger picture, up trend from 114.42 (2020 low) is seen as the third leg of the pattern from 109.30 (2016 low). Further rally is in favor as long as 134.11 resistance turned support holds, even in case of deep pull back. Next target is 149.76 (2015 high). However, sustained break of 134.11 will be a sign of medium term bearish reversal and turn focus to 124.37 support for confirmation.
EUR/GBP Daily Outlook
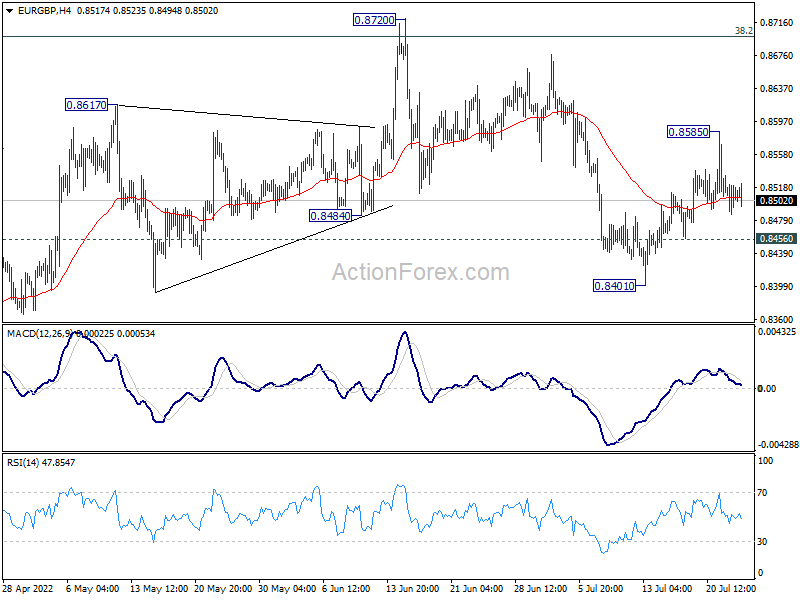
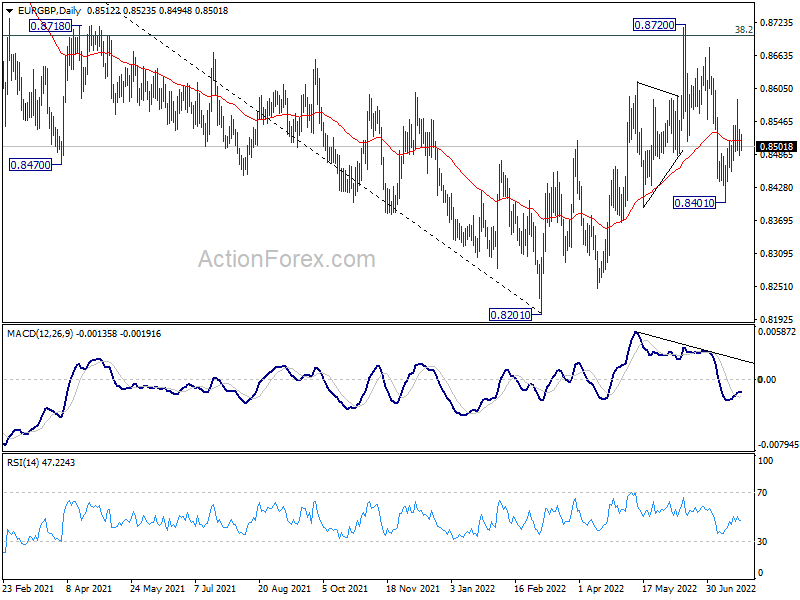
Daily Pivots: (S1) 0.8485; (P) 0.8507; (R1) 0.8528; More...
Intraday bias in EUR/GBP stays neutral for the moment. Further rise will remain mildly in favor as long as 0.8456 minor support holds. Above 0.8585 will target a retest on 0.8720 resistance. However, break of 0.8456 should resume the fall from 0.8720 through 0.8401.
In the bigger picture, attention remains on 38.2% retracement of 0.9499 to 0.8201 at 0.8697. Sustained break there will affirm the case that rise from 0.8201 is a medium term up trend itself. Further rally would then be seen to 61.8% retracement at 0.9003. However, rejection by 0.8697 will confirm medium term bearishness for another fall through 0.8201.
EUR/AUD Daily Outlook
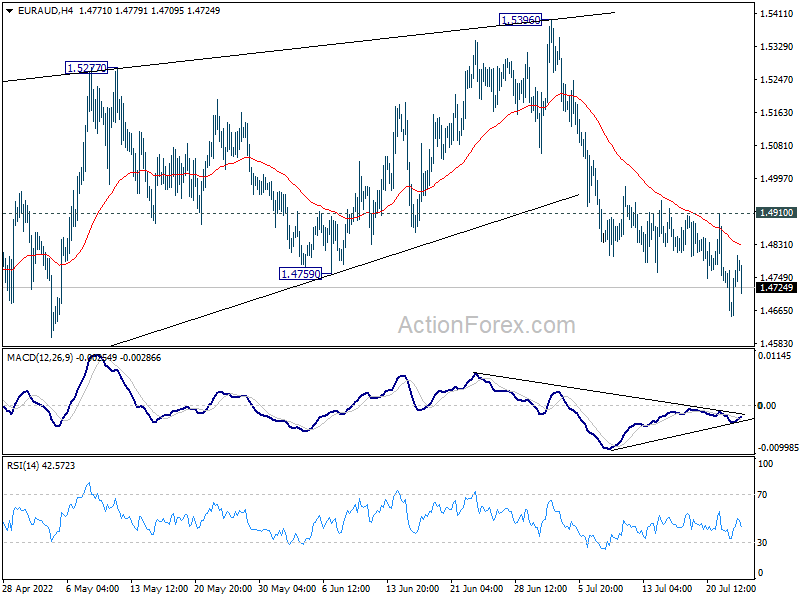
Daily Pivots: (S1) 1.4676; (P) 1.4722; (R1) 1.4792; More...
Further decline is expected in EUR/AUD as long as 1.4910 minor resistance holds. As noted before, corrective rise from 1.4318 should have completed at 1.5396, after rejection by 1.5354 support turned resistance. Deeper fall should be seen to retest 1.4318 low first. On the upside, above 1.4910 minor resistance will dampen this bearish view, and turn bias back to the upside for stronger rebound.
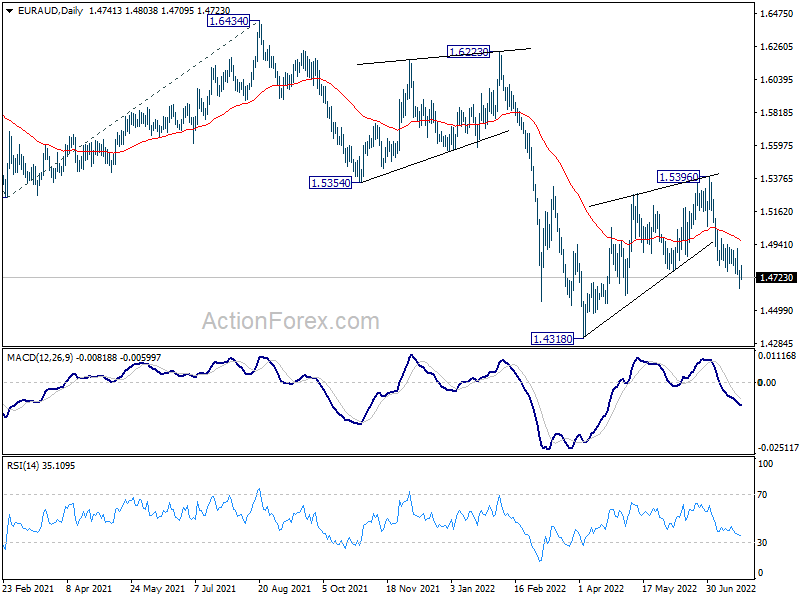
In the bigger picture, rejection by 1.5354 support turned resistance, as well as 55 week EMA (now at 1.5378), maintain medium term bearishness. That is, larger down trend from 1.9799 is not completed yet. Break of 1.4318 low will target 61.8% projection of 1.9799 to 1.5250 from 1.6434 at 1.3623, which is close to 1.3624 long term support (2017 low). This will remain the favored case now as long as 1.5396 resistance holds.
EUR/CHF Daily Outlook
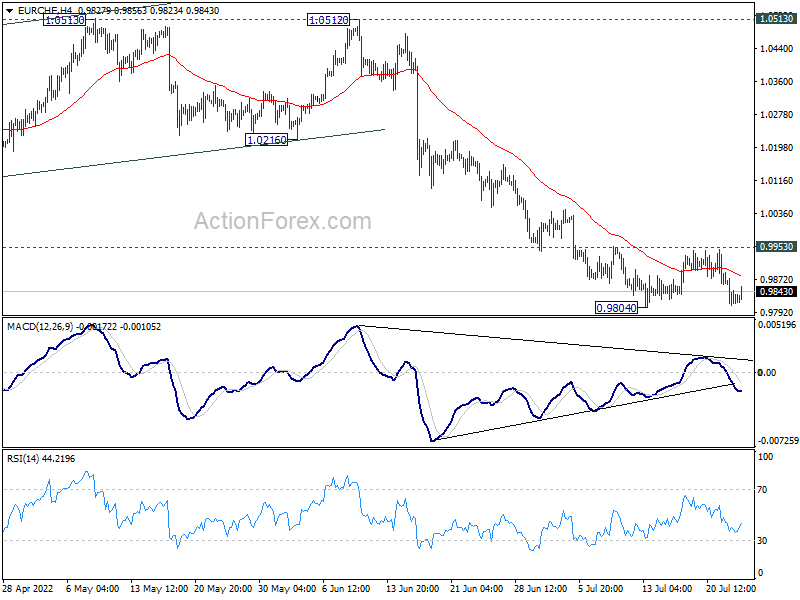
Daily Pivots: (S1) 0.9787; (P) 0.9839; (R1) 0.9868; More....
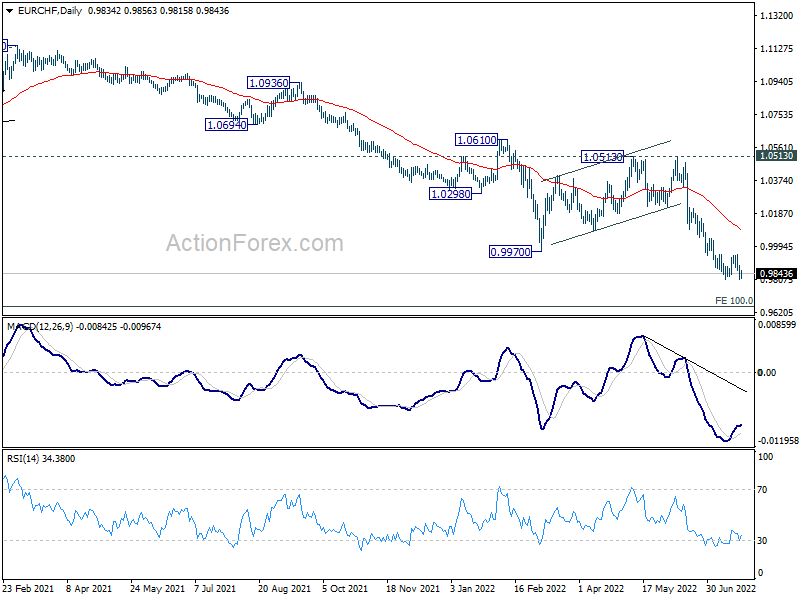
EUR/CHF recovers ahead of 0.9804 support and intraday b9ias remains neutral. Outlook remains bearish with 0.9953 resistance intact. On the downside, break of 0.9804 will resume larger down trend. Next target is 0.9650 long term projection level. On the upside, however, break of 0.9953 minor resistance will suggest short term bottoming, and bring stronger rebound to 55 day EMA (now at 1.0088).
In the bigger picture,long term down trend from 1.2004 (2018 high) is expected to target 100% projection of 1.2004 to 1.0505 to 1.1149 at 0.9650. On the upside, break of 1.0513 resistance is needed to indicate medium term bottoming. Otherwise, outlook will stay bearish in case of strong rebound.
Gold Price Moved into a Positive Zone above $1.700
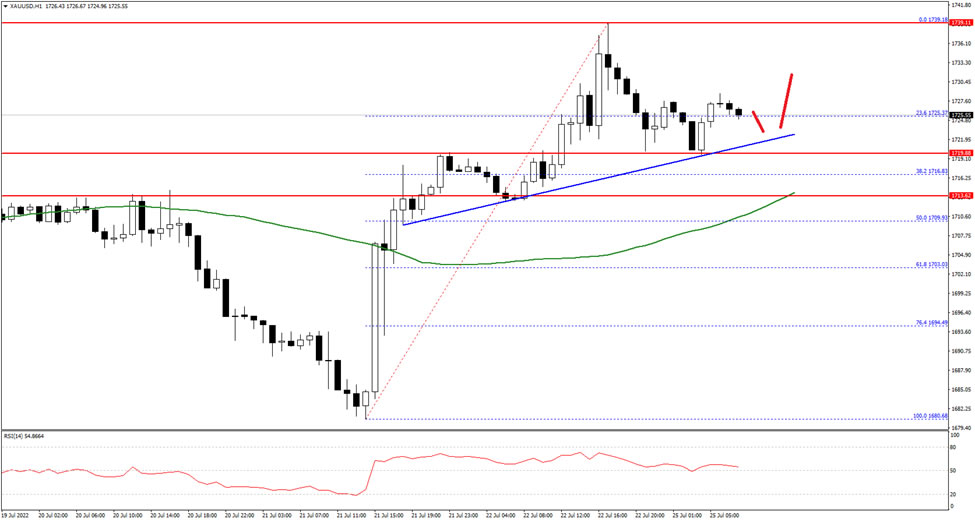
Gold price started a decent increase from the $1,680 zone against the US Dollar. The price traded above the $1,700 resistance to move into a positive zone.
It settled above the $1,710 level and the 50 hourly simple moving average. An immediate resistance on the upside is near the $1,730 level. The first major resistance is near the $1,735 level.
The next main resistance could be near the $1,740 level, above which the price could start another steady increase. In the stated case, it could rise towards $1,765 on FXOpen.
On the downside, there is a key support near the $1,720 level and a connecting bearish trend line on the hourly chart. The next major support is near the $1,715 level, below which the price might decline towards the $1,700 support level in the near term.
Gold Bounces Off 1-Year Low But Retains Bearish Outlook
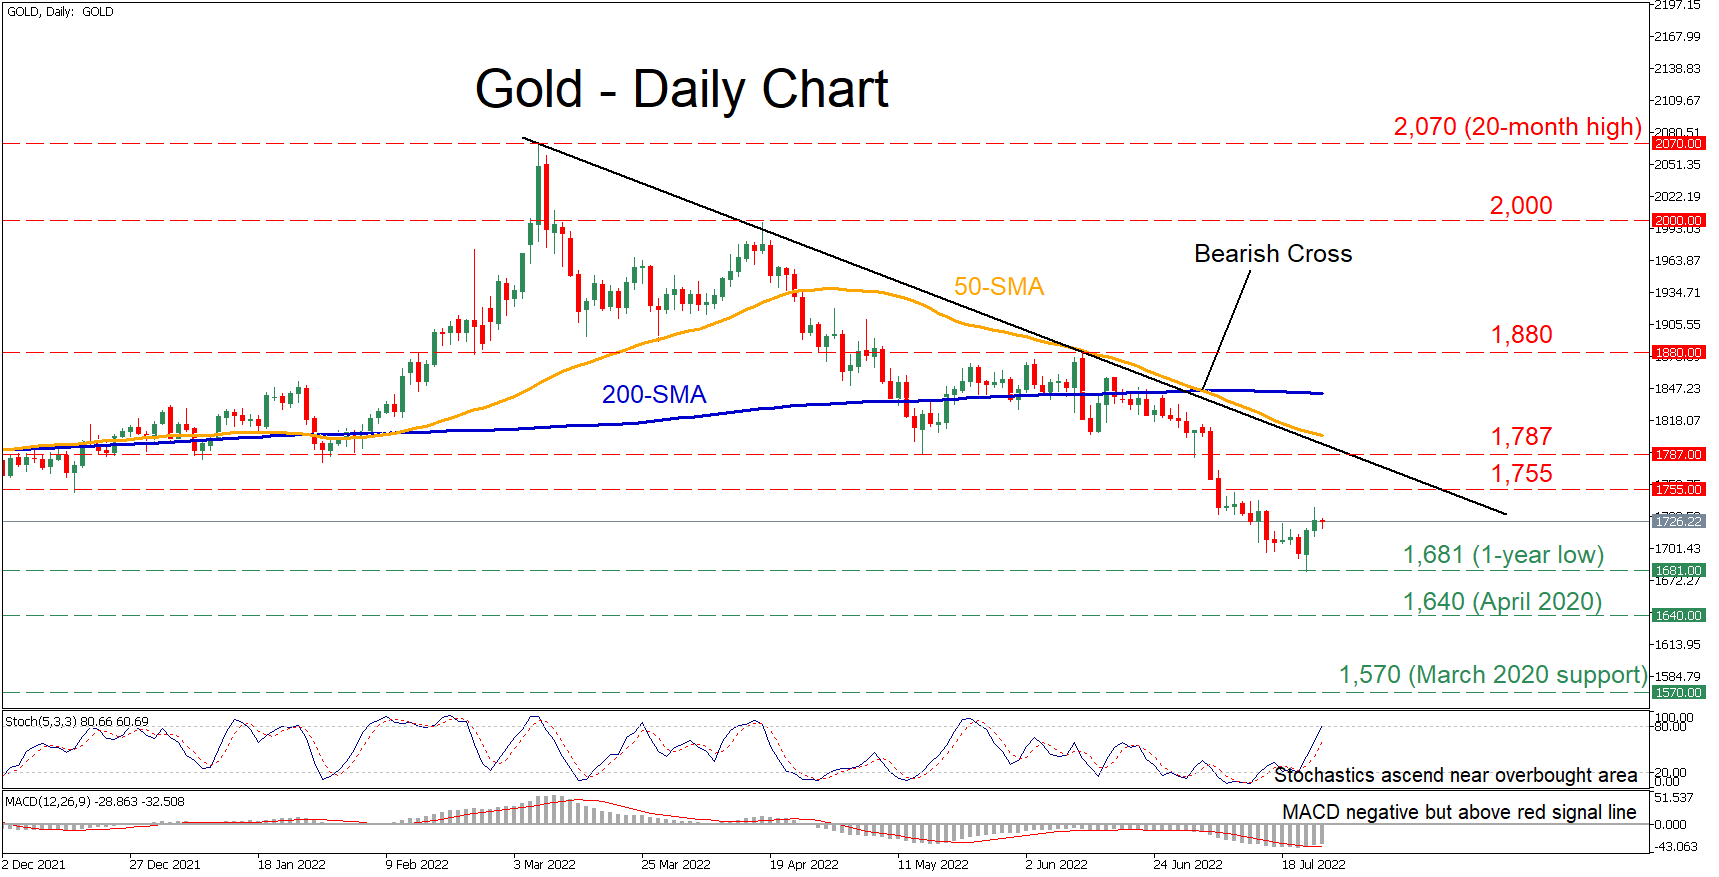
Gold has been experiencing a sustained downtrend since early March, generating a profound structure of lower highs and lower lows. Although the precious metal managed to cease its decline at the one-year low of 1,681 and recoup some losses, its bearish technical picture remains intact.
The momentum indicators reflect a cautiously positive near-term bias. Specifically, the stochastic oscillator is sloping upwards towards its 80-overbought zone, while the MACD has crossed above its red signal line but remains in the negative territory.
Should buying interest intensify further, the price may encounter initial resistance at the 1,755 barrier. Any further advances could then stall at the May support of 1,787 before the 1,880 peak appears on the radar. An upside violation of the latter could open the door for the 2,000 psychological mark.
On the flipside, should the decline resume, the one-year low of 1,681 might act as the first line of defense. Breaching this zone, the spotlight could turn to 1,640, which acted both as support and resistance in April 2020. Failing to halt there, the bears might then aim for the March 2020 support of 1,570.
Overall, even though the market is trying to push for some recovery in the past few daily sessions, gold maintains both its bearish short- and long-term outlooks. For the former to alter, the price needs to decisively cross above the 1,880 ceiling.
US Oil: A Final Bullish Impulse Could Have Just Begun
USOIL suggests the development of the final part of the global impulse wave a of the cycle degree. The 1H timeframe shows the markup of the final primary wave ⑤, which takes the form of an intermediate impulse.
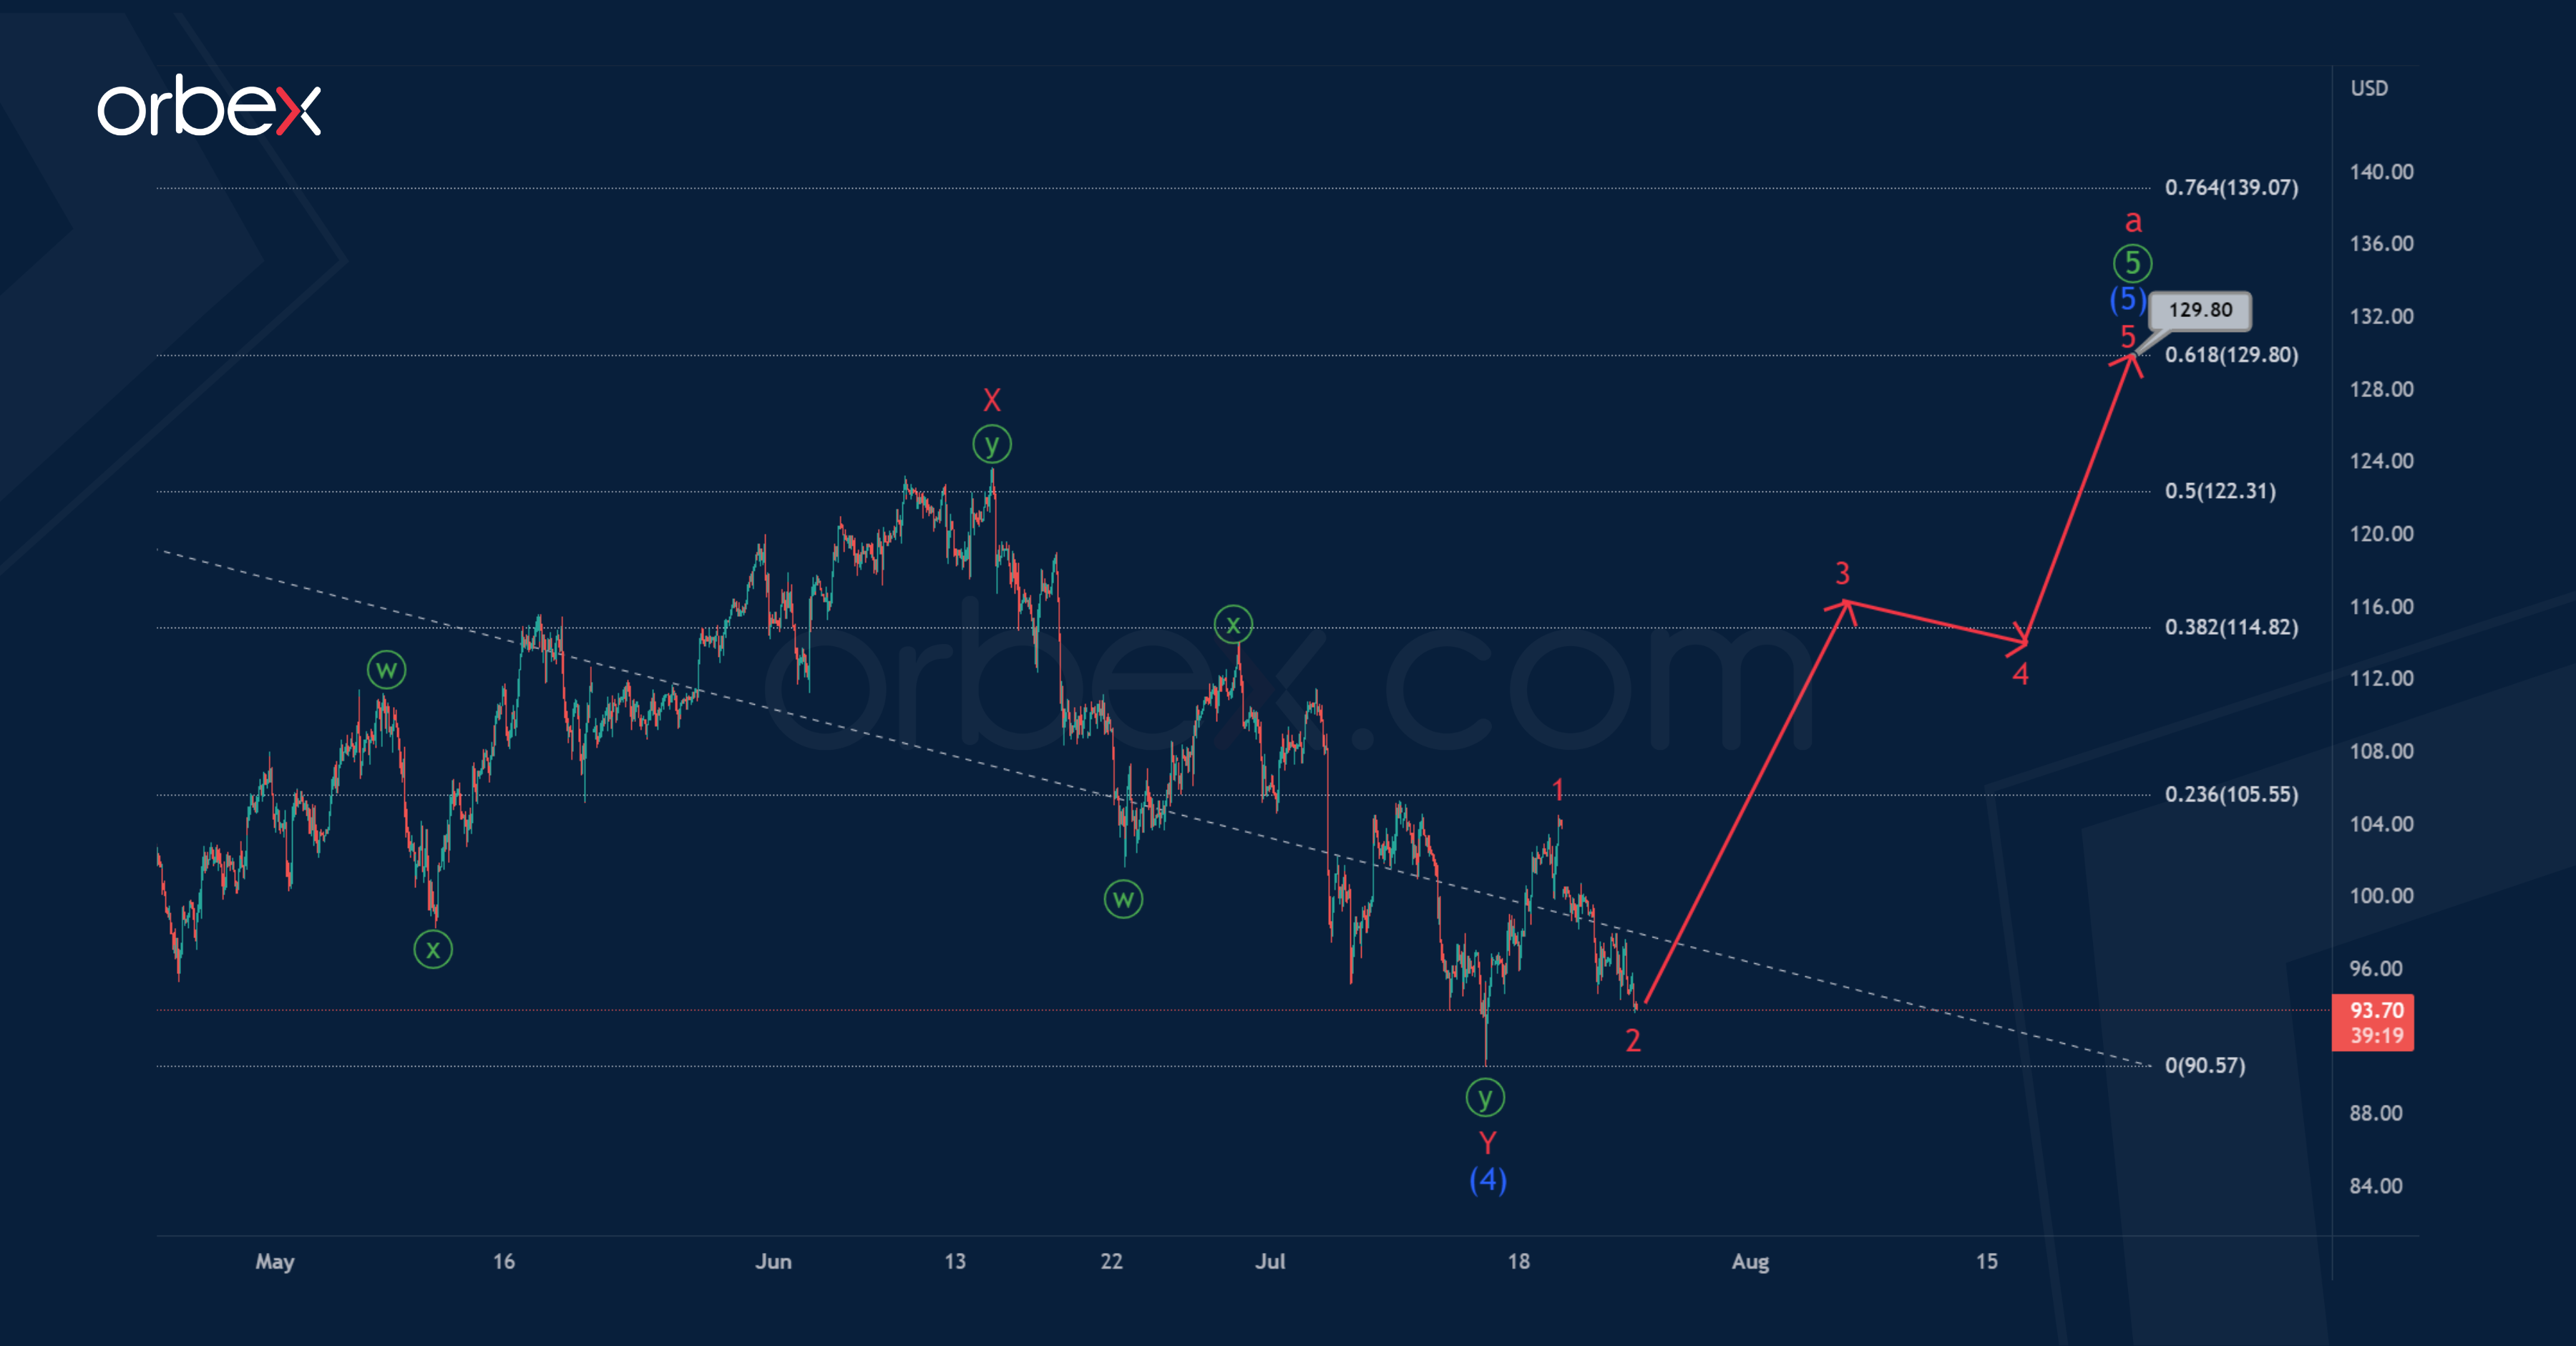
Perhaps in the middle of the current month, an intermediate correction (4) was completed in the form of a minor zigzag, then the price began to rise in the intermediate wave (5).
It is assumed that the intermediate wave (5) may take the form of a standard minor impulse 1-2-3-4-5, as shown on the chart.
The end of the specified pattern is possible near 129.80. At that level, wave (5) will be at the 61.8% Fibonacci extension of impulse (3).
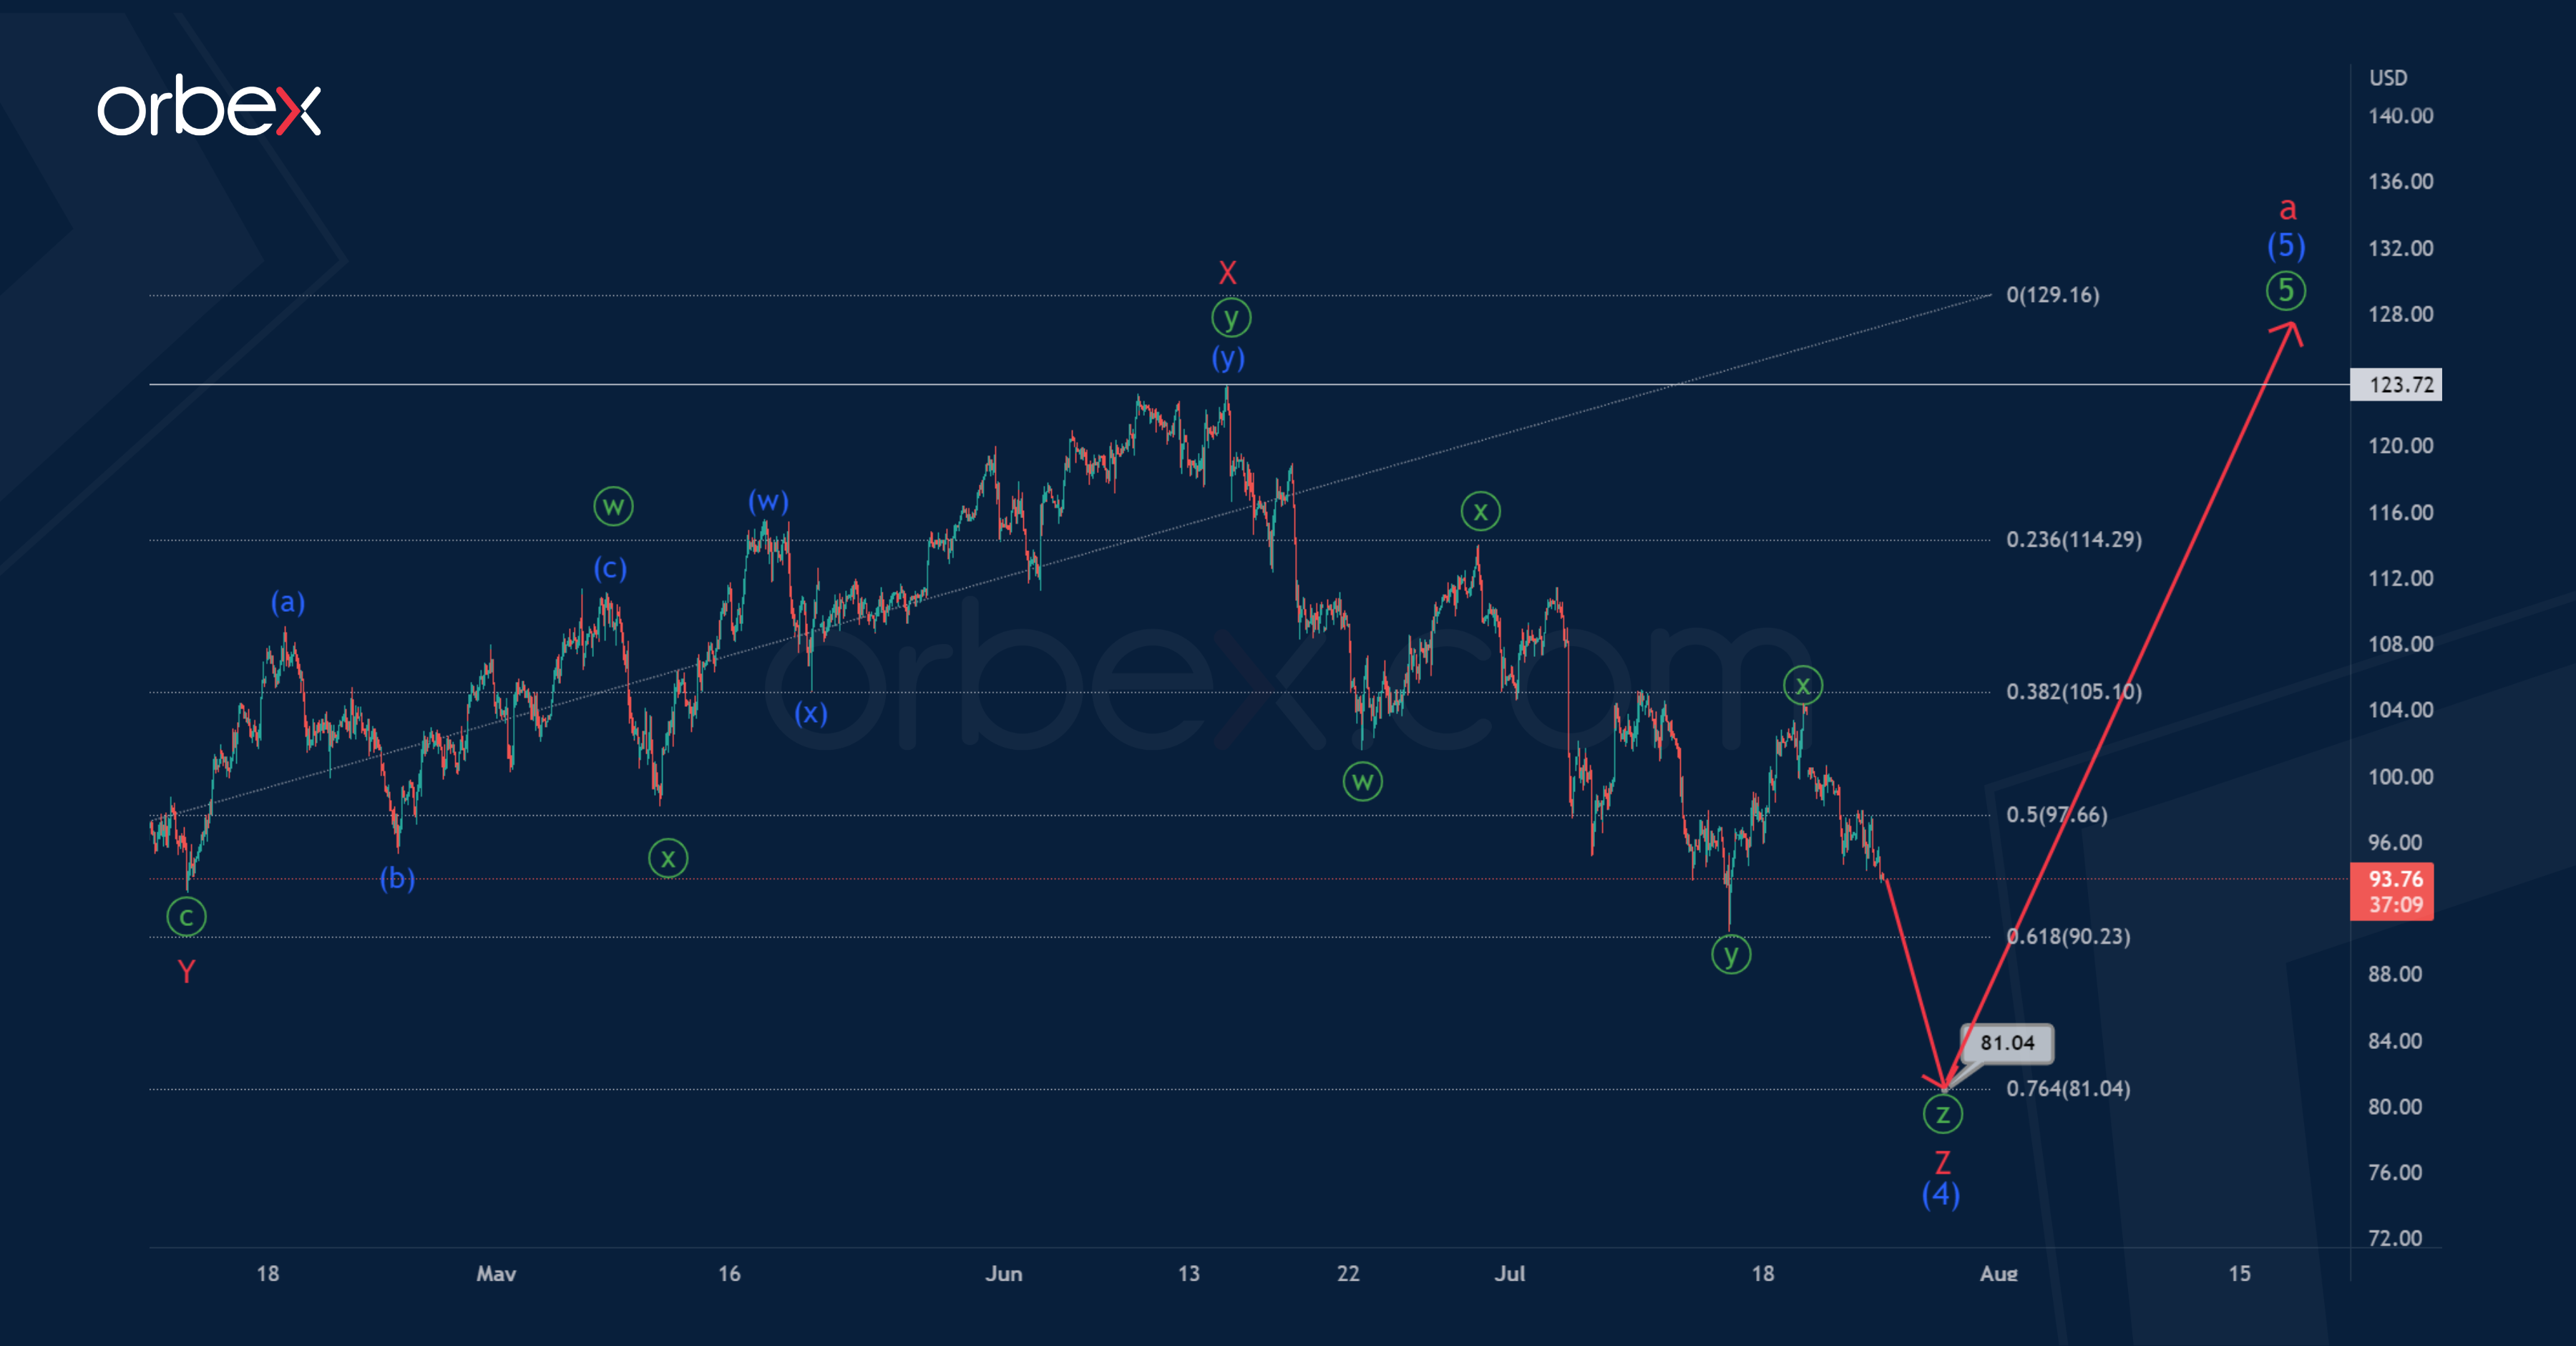
According to the alternative, we see that the construction of the intermediate correction (4) can be continued. Perhaps it will have the form of a triple three W-X-Y-X-Z.
The minor sub-waves W-X-Y-X look complete. Thus, in the near future, a downward movement is expected in the actionary sub-wave Z, which can be completed in the form of a minute triple zigzag ⓦ-ⓧ-ⓨ-ⓧ-ⓩ.
The oil price may fall to 81.04. At that level, intermediate correction (4) will be at 76.4% of impulse (3).
After the end of the flat, the market is expected to grow above the maximum – 123.72.
Dow Jones Futures Pulls Back ahead of Key S&P 500 Earnings
American futures retreated slightly as investors waited for more earnings as the season continues. Data compiled by Factset showed that 21% of all companies in the S&P 500 have already published their quarterly results. Of these companies, 68% of them have published a positive EPS surprise while 65% of them have published a revenue surprise. Their blended earnings growth rate has been about 4.8%, which was the lowest level since 2020. The companies have a forward 12-month PE of 16.7, which is lower than the 5-year average of 18.6.
More American companies will publish their results this week. Some of the most notable ones are PulteGroup, Coca-Cola, Raytheon, UPS, Archer-Daniels-Midland, 3M, Google, and Chubb. In Europe, companies like Lloyds Bank, Barclays, and UBS will publish their results this week. Most of these companies are expected to publish weak results and warn about their forward guidance due to the soaring inflation. Still, most investors believe that the worst is now over for companies considering that commodity prices and ocean shipping costs have retreated.
The economic calendar will have no major economic data on Monday. The most important numbers to watch will be German business expectations and current assessment. With energy costs soaring, analysts expect the data to show that sentiment worsened in July. Germany is facing the possibility of gas rationing as Russia considers blocking gas flows to the region. Germany receives more than 40% of its gas from Russia. The UK will publish the latest industrial trends order numbers.
GBPUSD
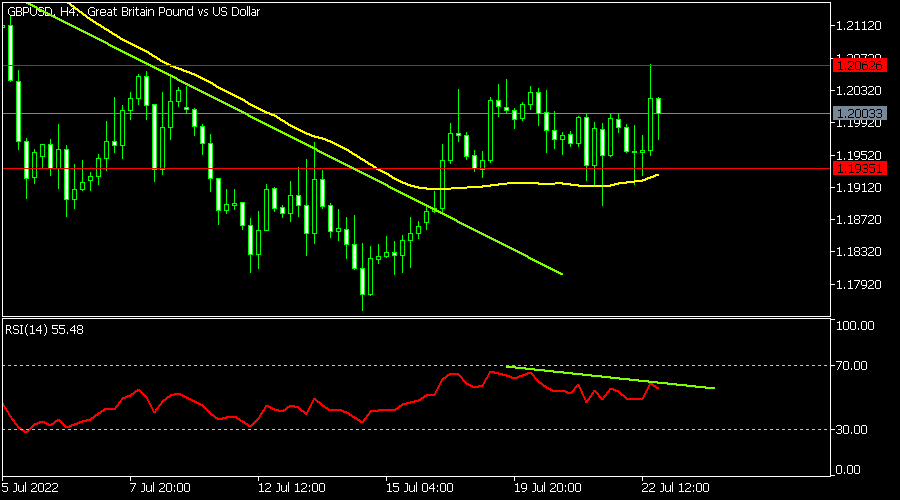
The GBPUSD pair moved sideways after the latest weak UK retail sales data. It is trading at 1.200, which is slightly below last week's high of 1.2063. It has moved slightly above the 25-day moving average and is between the important support level at 1.1935. The Relative Strength Index (RSI) has continued dropping while the price is above the descending trendline shown in green. Therefore, the pair will likely remain in this range ahead of the upcoming US consumer confidence and Fed interest rate decision.
EURUSD
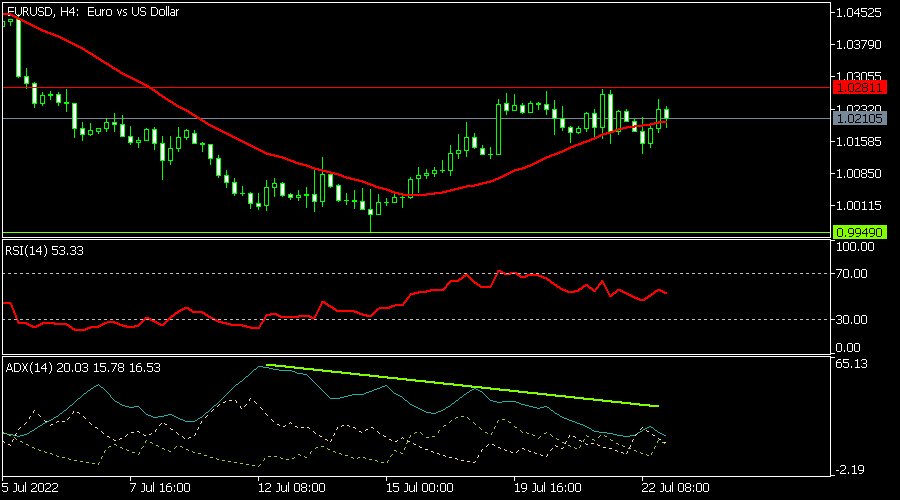
The EURUSD pair was in a tight range on Monday morning as investors waited for upcoming Germany and US confidence data. The pair is also waiting for the upcoming interest rate decision by the Federal Reserve. It is trading at 1.02100, which is slightly below this week’s high of 1.0281 and is also along the 25-day moving average. At the same time, the Average Directional Index (ADX) has been in a downward trend, signaling that there is no trend. Therefore, the pair will likely resume the bearish trend as sellers target the key support at 1.0100.
EURCHF
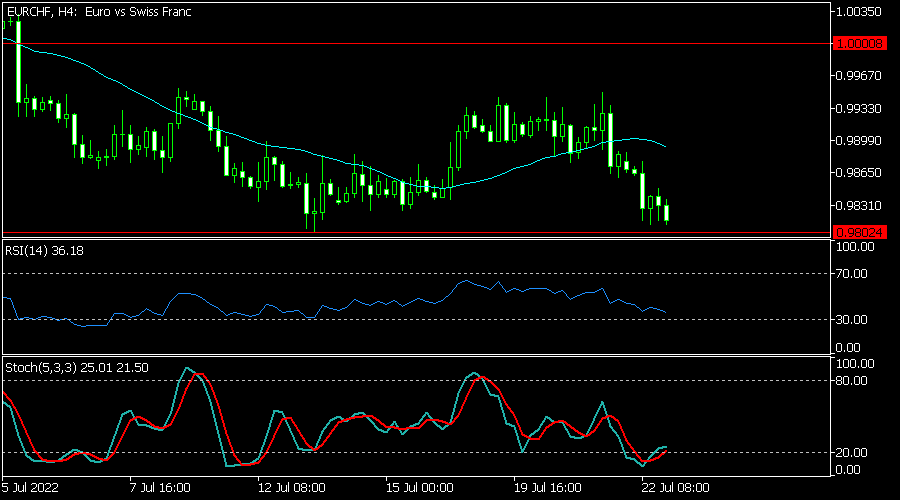
The EURCHF continued dropping even after the hawkish ECB decision. The pair dropped to a low of 0.9800, which was the lowest level since July 12. It has moved below the 25-day and 50-day moving averages while the Relative Strength Index (RSI) is approaching the oversold level at 30. The Stochastic Oscillator has moved below the oversold level. Therefore, the pair will likely continue falling as sellers target the key support at 0.9750.