

Sample Category Title
Japan CPI core unchanged at 2.1% yoy, above target for second month
Japan CPI core (all item ex-fresh food) was unchanged at 2.1% yoy in May, matched expectations. That's the second month that core consumer inflation tops BoJ's 2% target. All item CPI was unchanged at 2.5% yoy, below expectation of 2.9% yoy. CPI core-core (all item ex-food, energy) was unchanged at 0.8% yoy, above expectation of 0.4% yoy.
But Deputy Chief Cabinet Secretary Seiji Kihara warned in the press conference, "we think it is necessary to pay close attention to the downside risks of the economy such as pushing down private consumption and corporate activities."
Technical Outlook and Review
DXY:
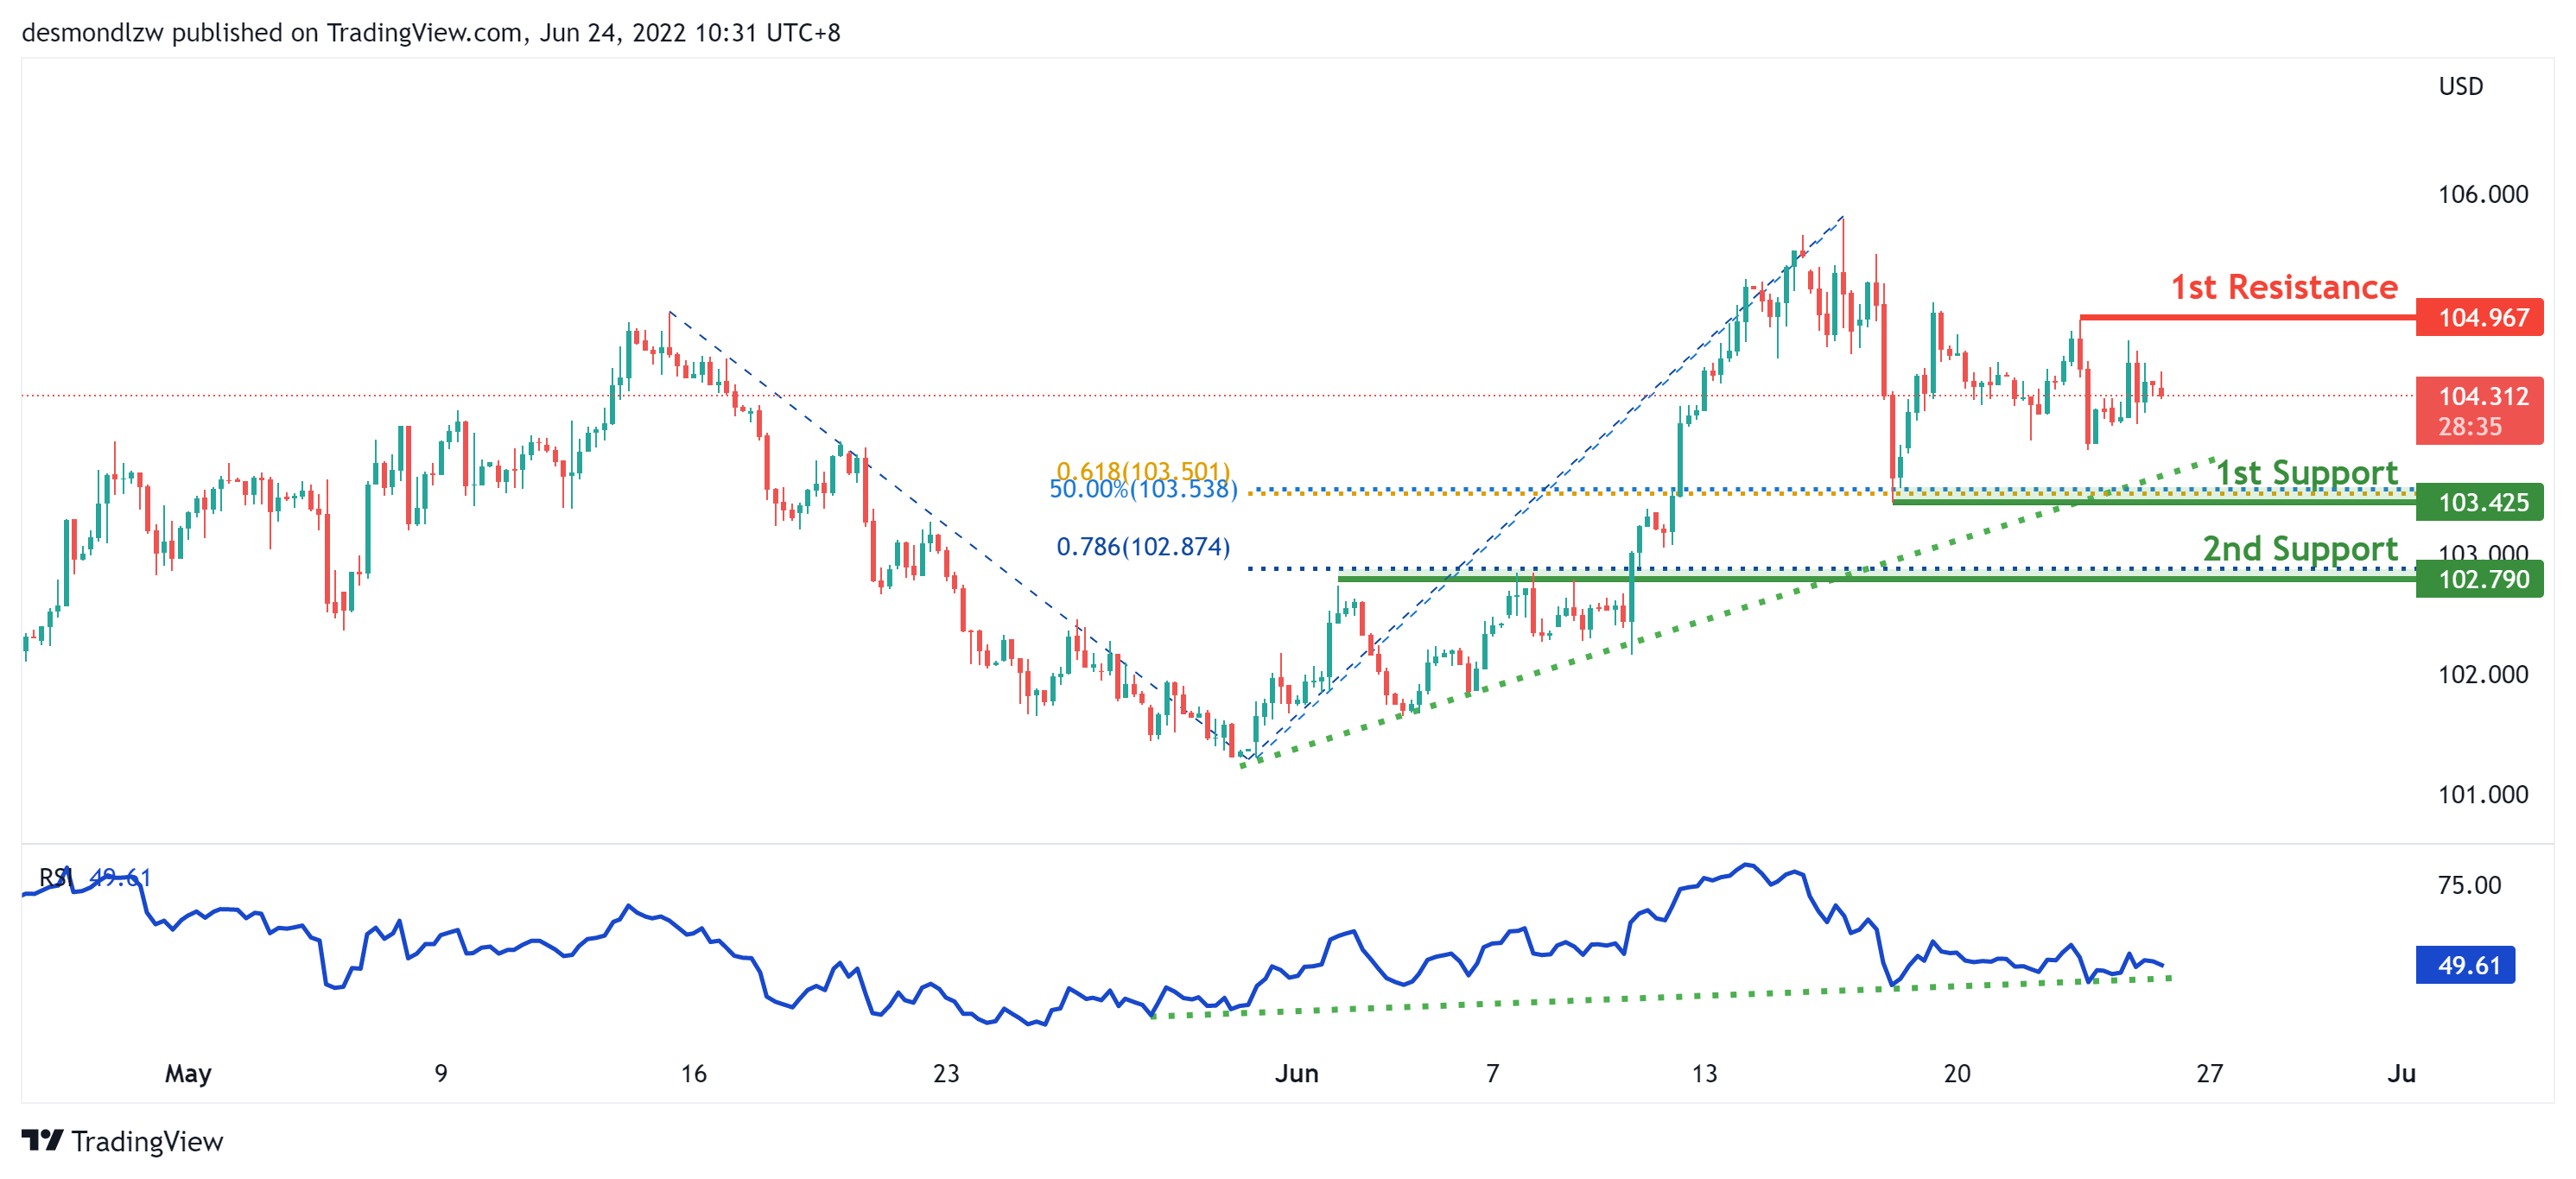
On the H4, with RSI moving along an ascending trendline and prices moving along the ascending trendline, we have a bullish bias that bullish momentum will carry prices from our 1st support at 103.425 where the 61.8% fibonacci projection, 50% fibonacci retracement and swing low support are to our 1st resistance at 104.967 in line with the horizontal swing high resistance. Alternatively, price may break 1st support structure and head for 2nd support at 102.790 where the horizontal overlap support and 78.6% fibonacci projection.
Areas of consideration:
- H4 time frame, 1st resistance at 104.967
- H4 time frame, 1st support at 103.425
XAU/USD (GOLD):
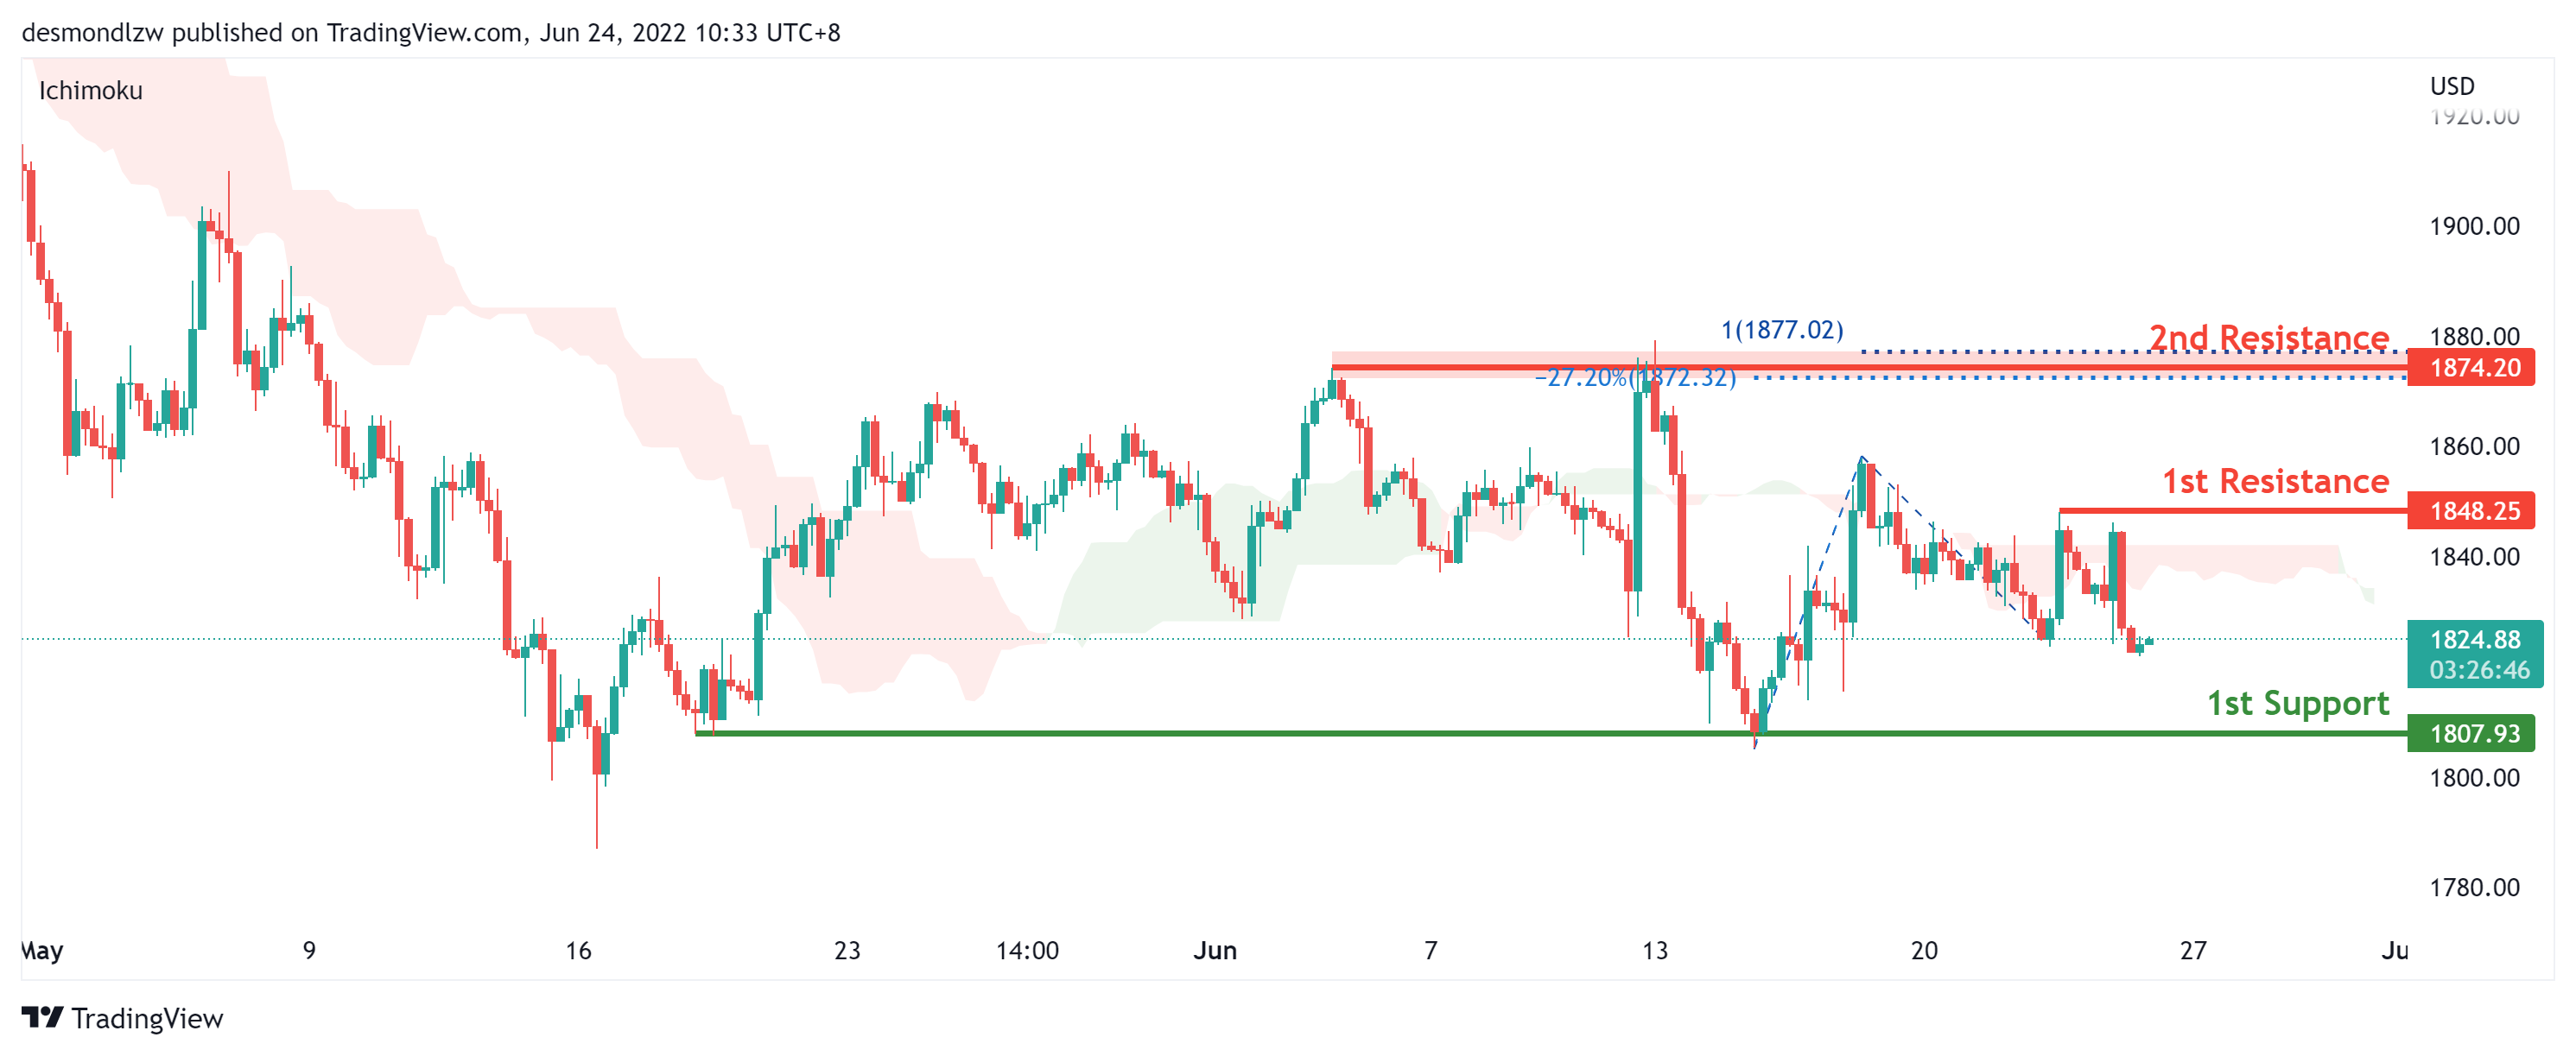
On the H4, with prices moving below the ichimoku indicator, we have a bearish bias that prices will drop from our 1st resistance at 1848.25 where the horizontal swing high resistance is to our 1st support at 1807.93 in line with swing low support. Alternatively, price may break 1st resistance structure and head for 2nd resistance at 1874.20 in line with swing high resistance, -27.2% fibonacci expansion and 100% fibonacci projection.
Areas of consideration:
- H4 time frame, 1st Resistance at 1848.25
- H4 time frame, 1st Support at 1807.93
GBP/USD:
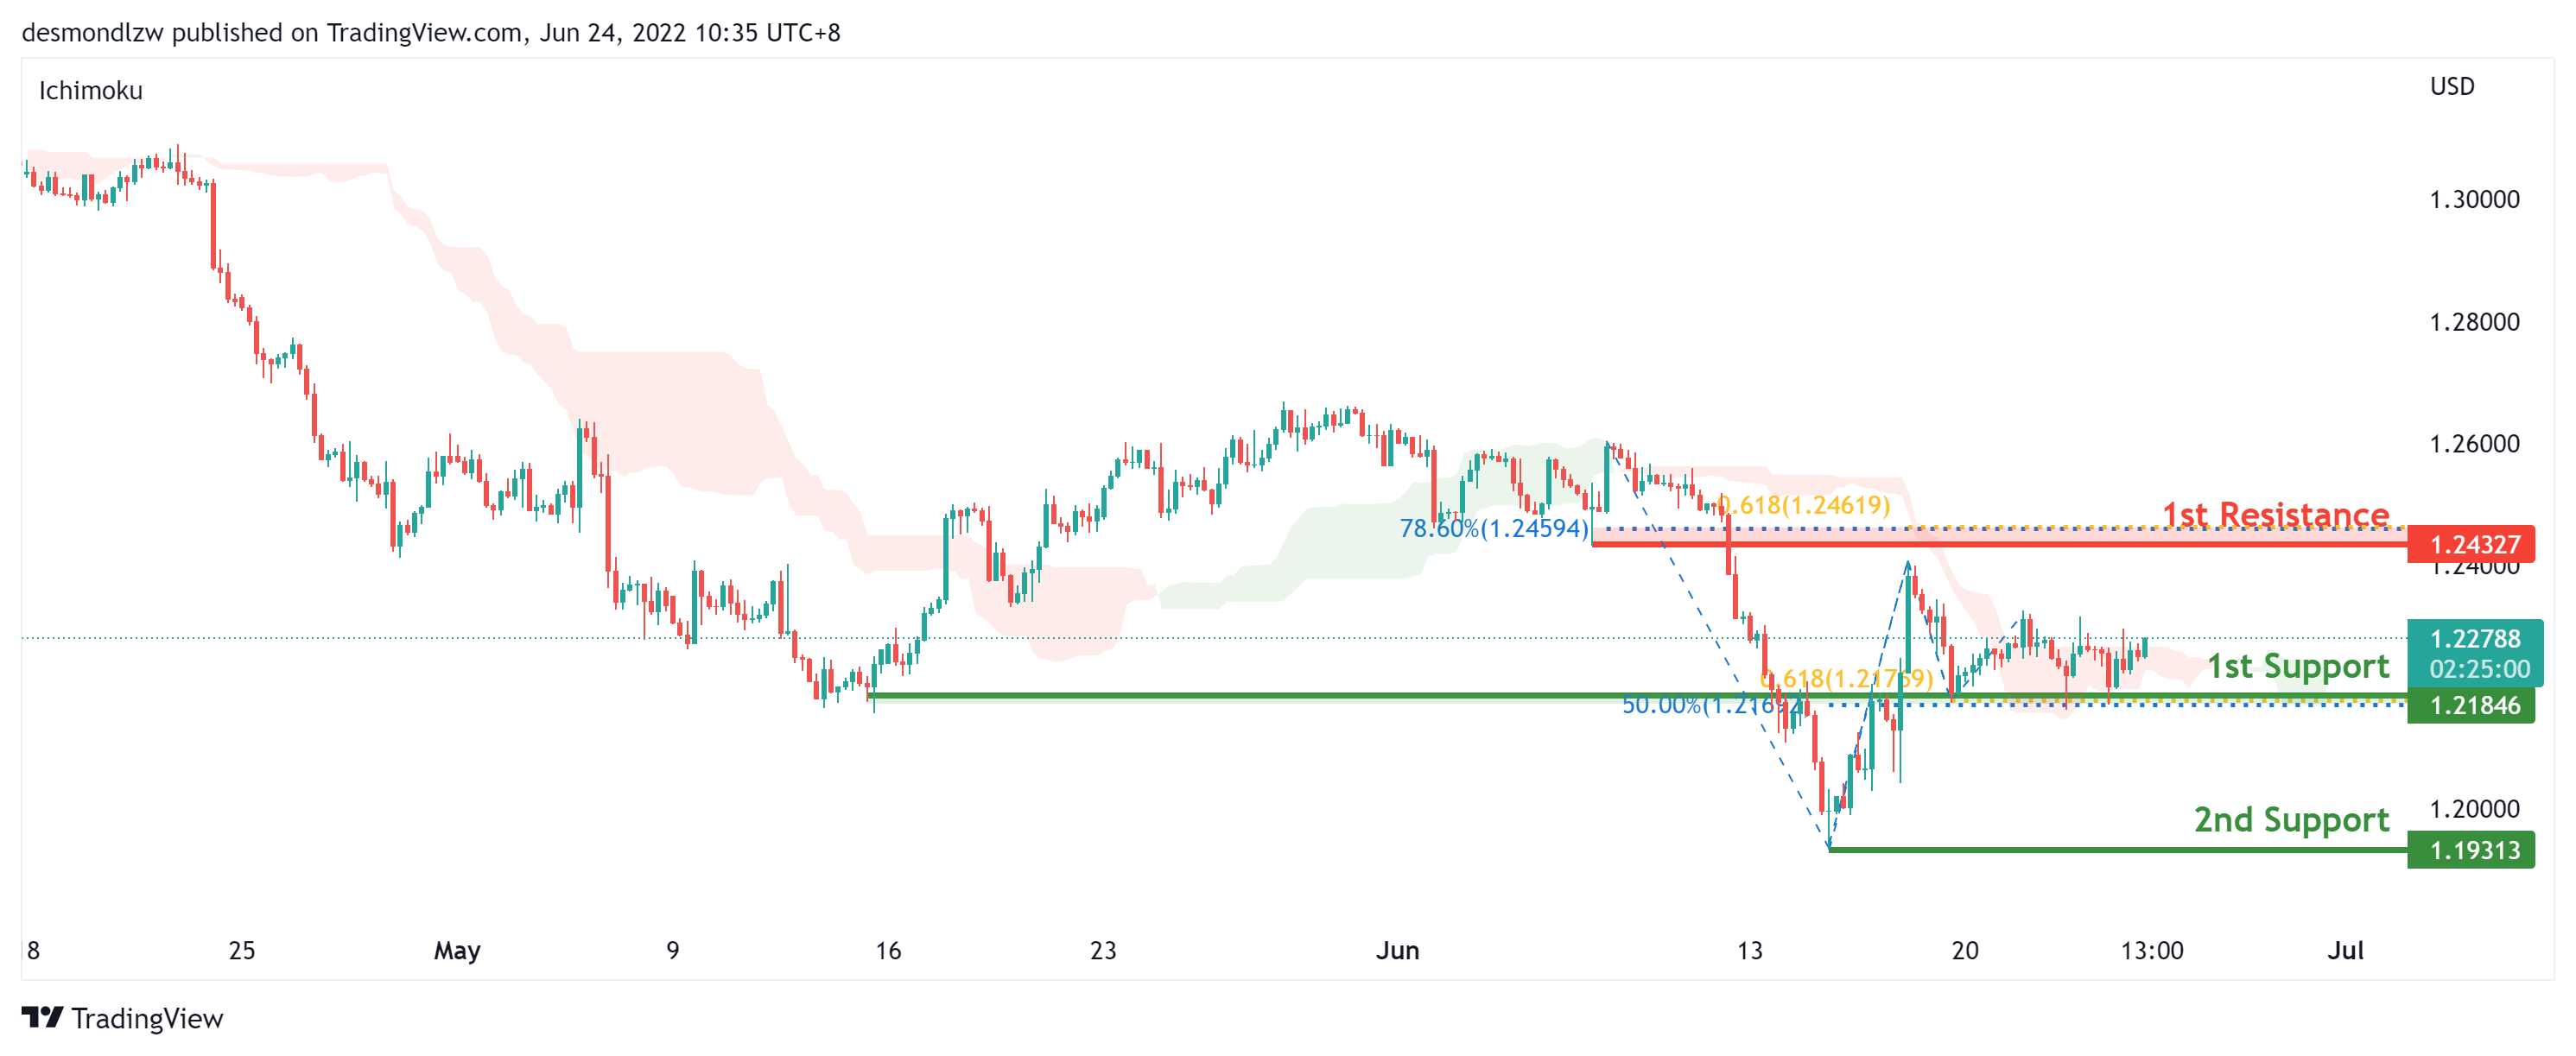
On the H4, with prices expected to bounce off the ichimoku support, we have a bullish bias that price will rise from our 1st support at 1.21846 where the horizontal overlap support,50% fibonacci retracement and 61.8% fibonacci projection to our 1st resistance at 1.24327 in line with the 61.8% fibonacci projection, 78.6% fibonacci retracement and pullback resistance. Alternatively, price may break 1st support structure and head for 2nd support at 1.19313 where the horizontal swing low support is.
Areas of consideration:
- H4 1st resistance at 1.24327
- H4 1st support at 1.21846
USD/CHF:
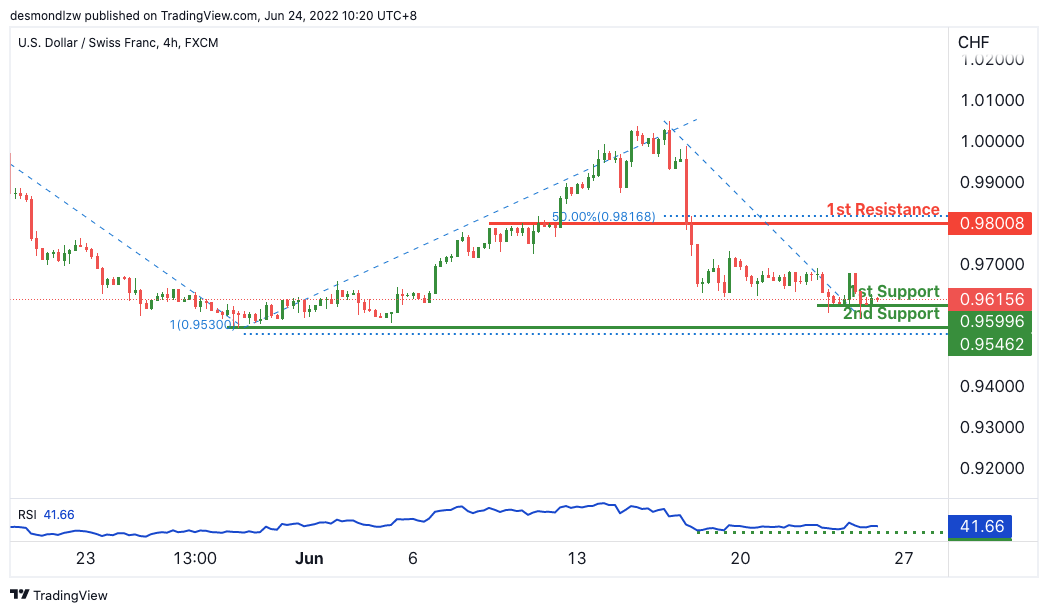
On the H4, with price expected to bounce off the stochastics indicator, we have a bullish bias that price will rise from our 1st support at 0.95996 where the horizontal pullback support is to our 1st resistance at 0.98008 in line with the horizontal pullback resistance and 50% Fibonacci retracement. Alternatively, price may break structure and head for 2nd support where the 100% Fibonacci projection is.
Areas of consideration
- 1st support level at 0.95996
- 1st resistance level at 0.98008
EUR/USD :
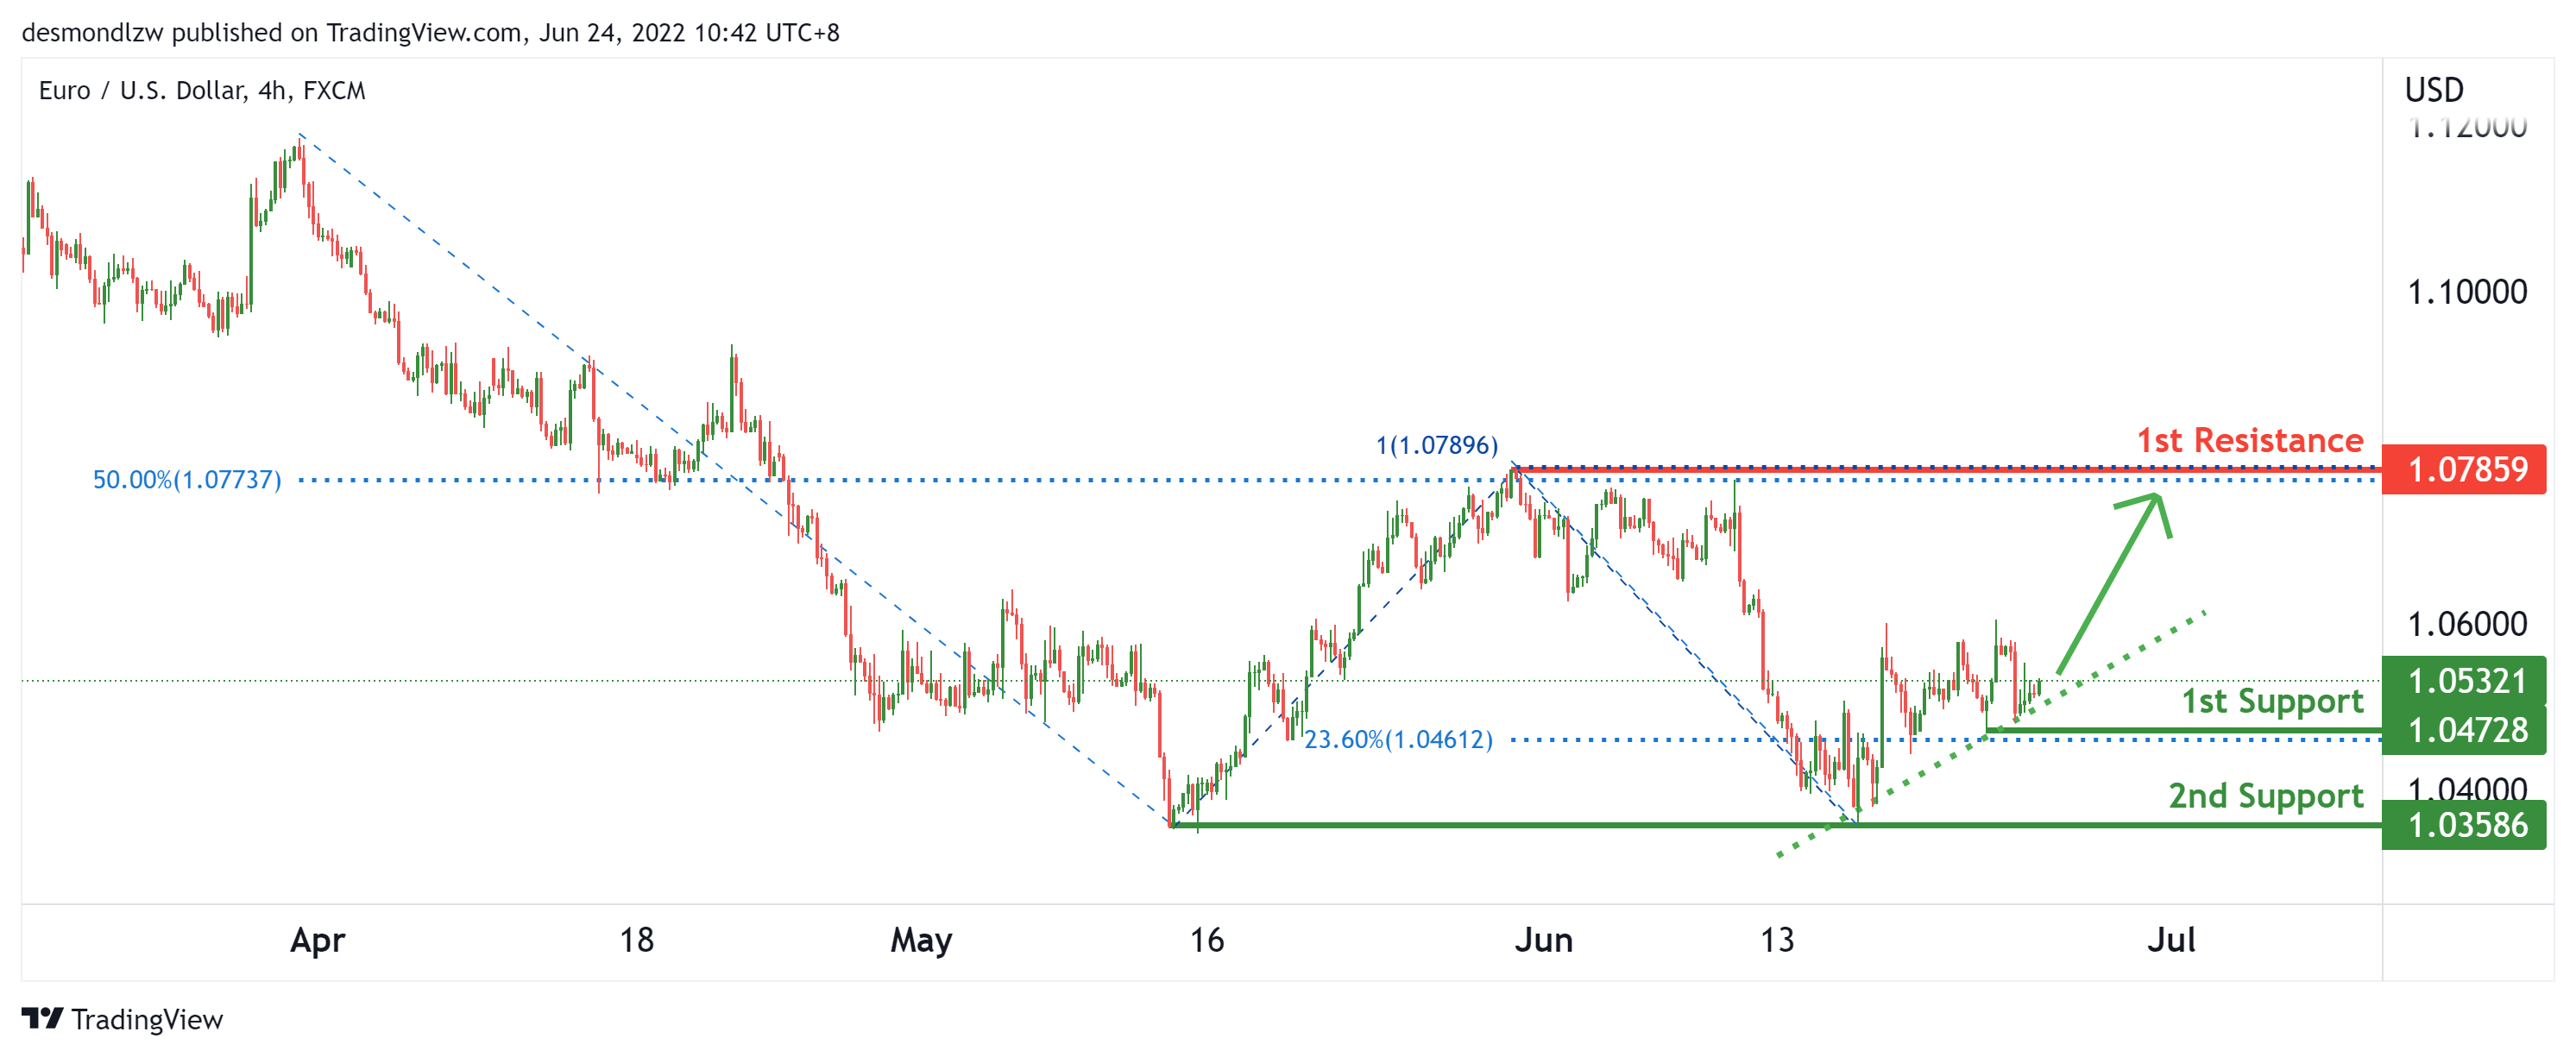
On the H4, with price moving in an ascending trendline, we have a bullish bias that price will continue to rise from the 1st support at 1.04728 in line with the 23.6% fibonacci retracement and swing low to the 1st resistance at 1.07859 at the swing high in line with the 100% fibonacci projection and 50% fibonacci retracement. Alternatively, price may drop from the 1st support to the 2nd support at 1.03586 at the horizontal swing lows.
Areas of consideration :
- H4 1st resistance at 1.07859
- H4 1st support at 1.04728
USD/JPY:
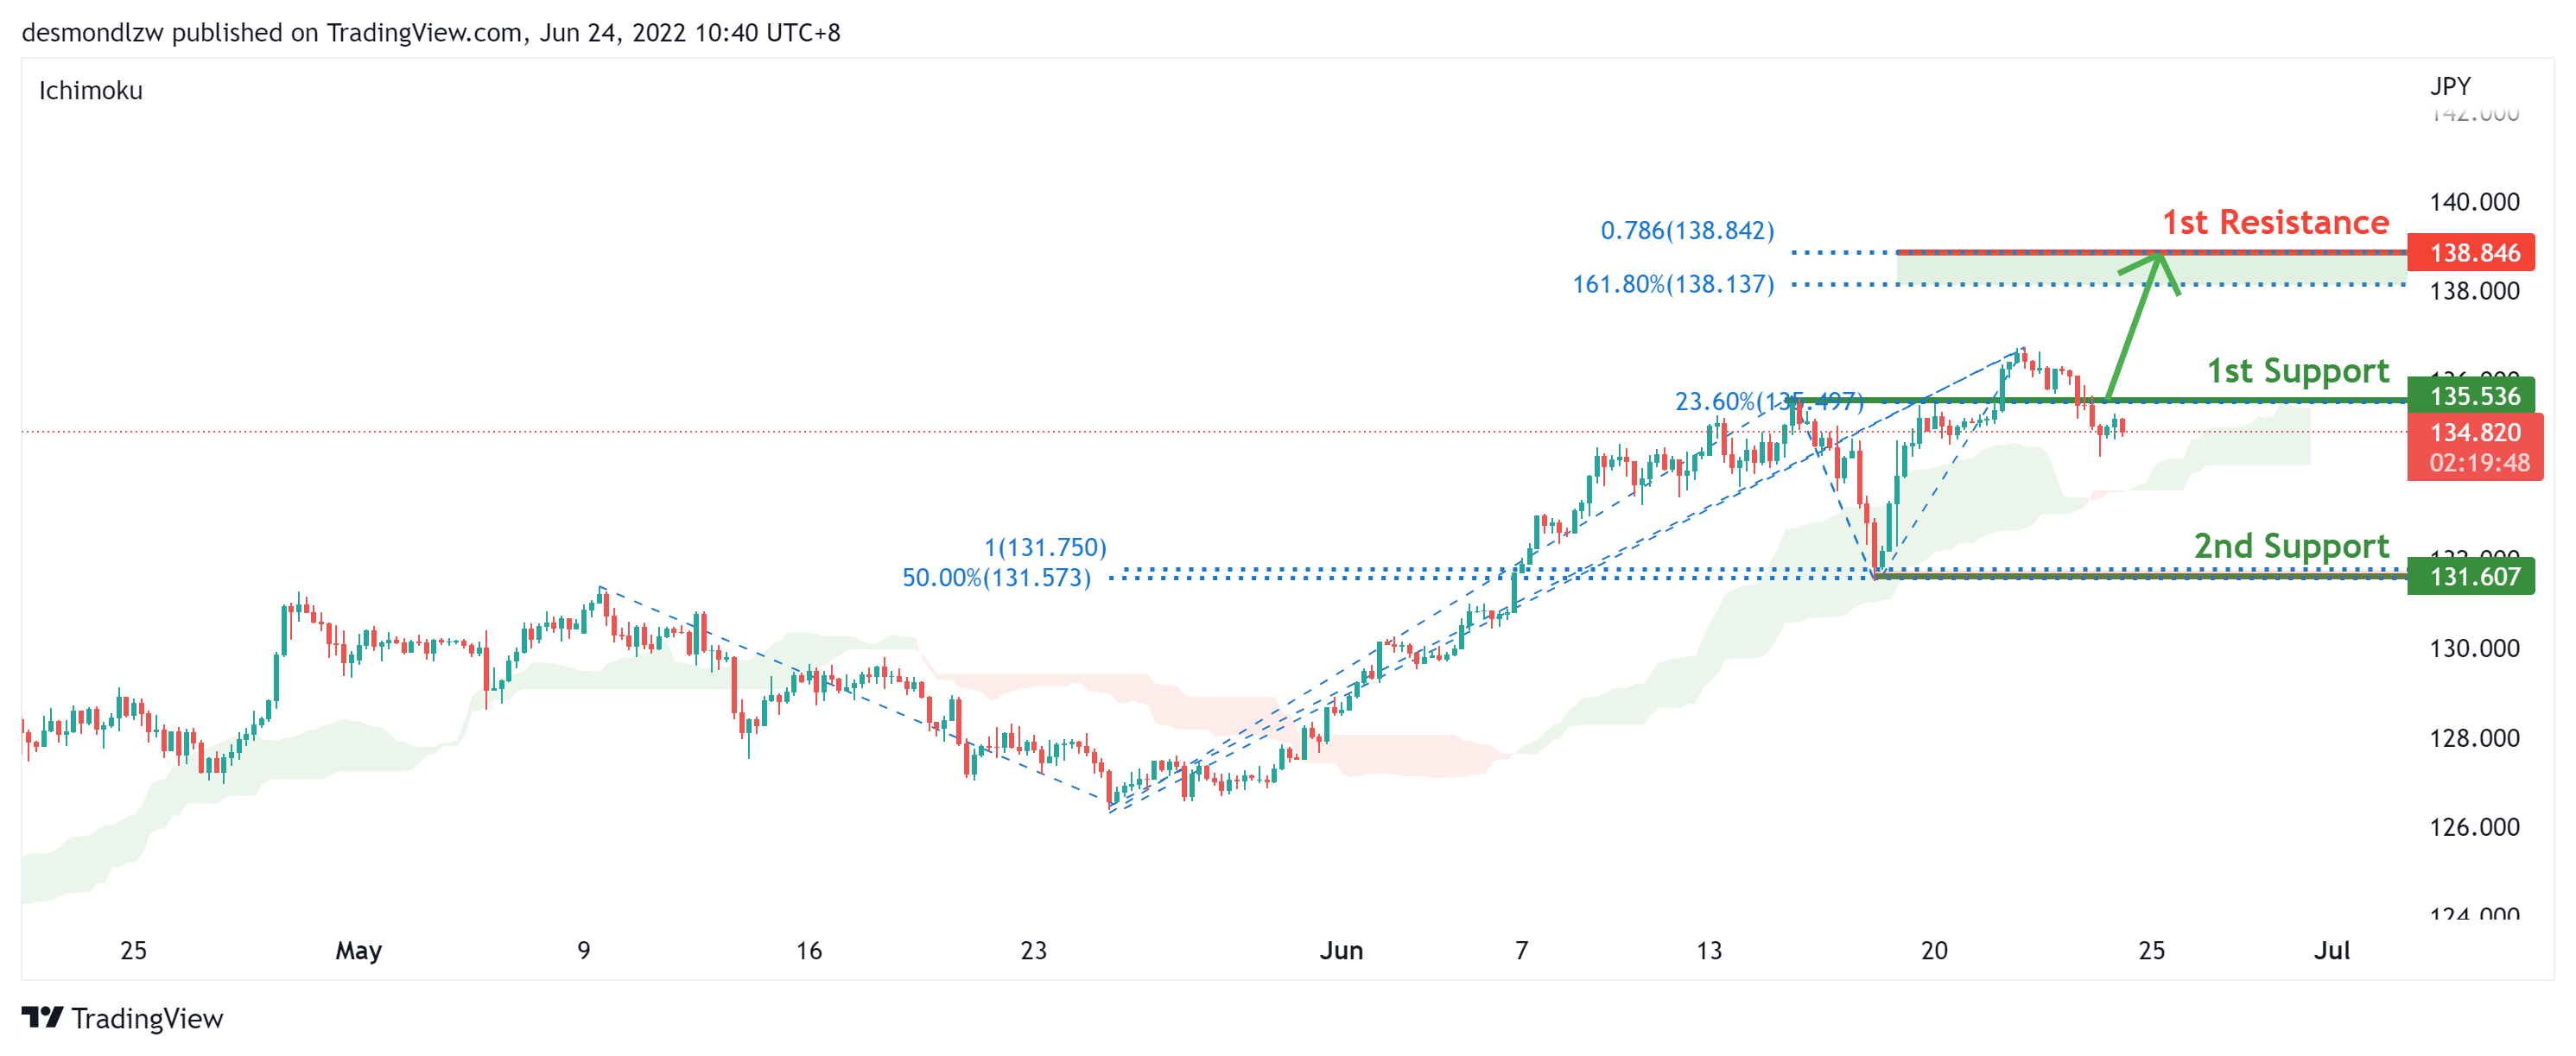
On the H4, with price moving above the ichimoku indicator, we have a bullish bias that price will rise from our 1st support at 135.536 in line with the pullback support and 23.6% fibonacci retracement to our 1st resistance at 138.846 where the 161.8% fibonacci extension and 78.6% fibonacci projection are . Alternatively, price may break 1st support structure and head for 2nd support at 131.607 in line with the swing low support,78.6% fibonacci projection and 50% fibonacci retracement.
Areas of consideration:
- H4 time frame, 1st resistance at 138.846
- H4 time frame, 1st support at 135.536
AUD/USD:
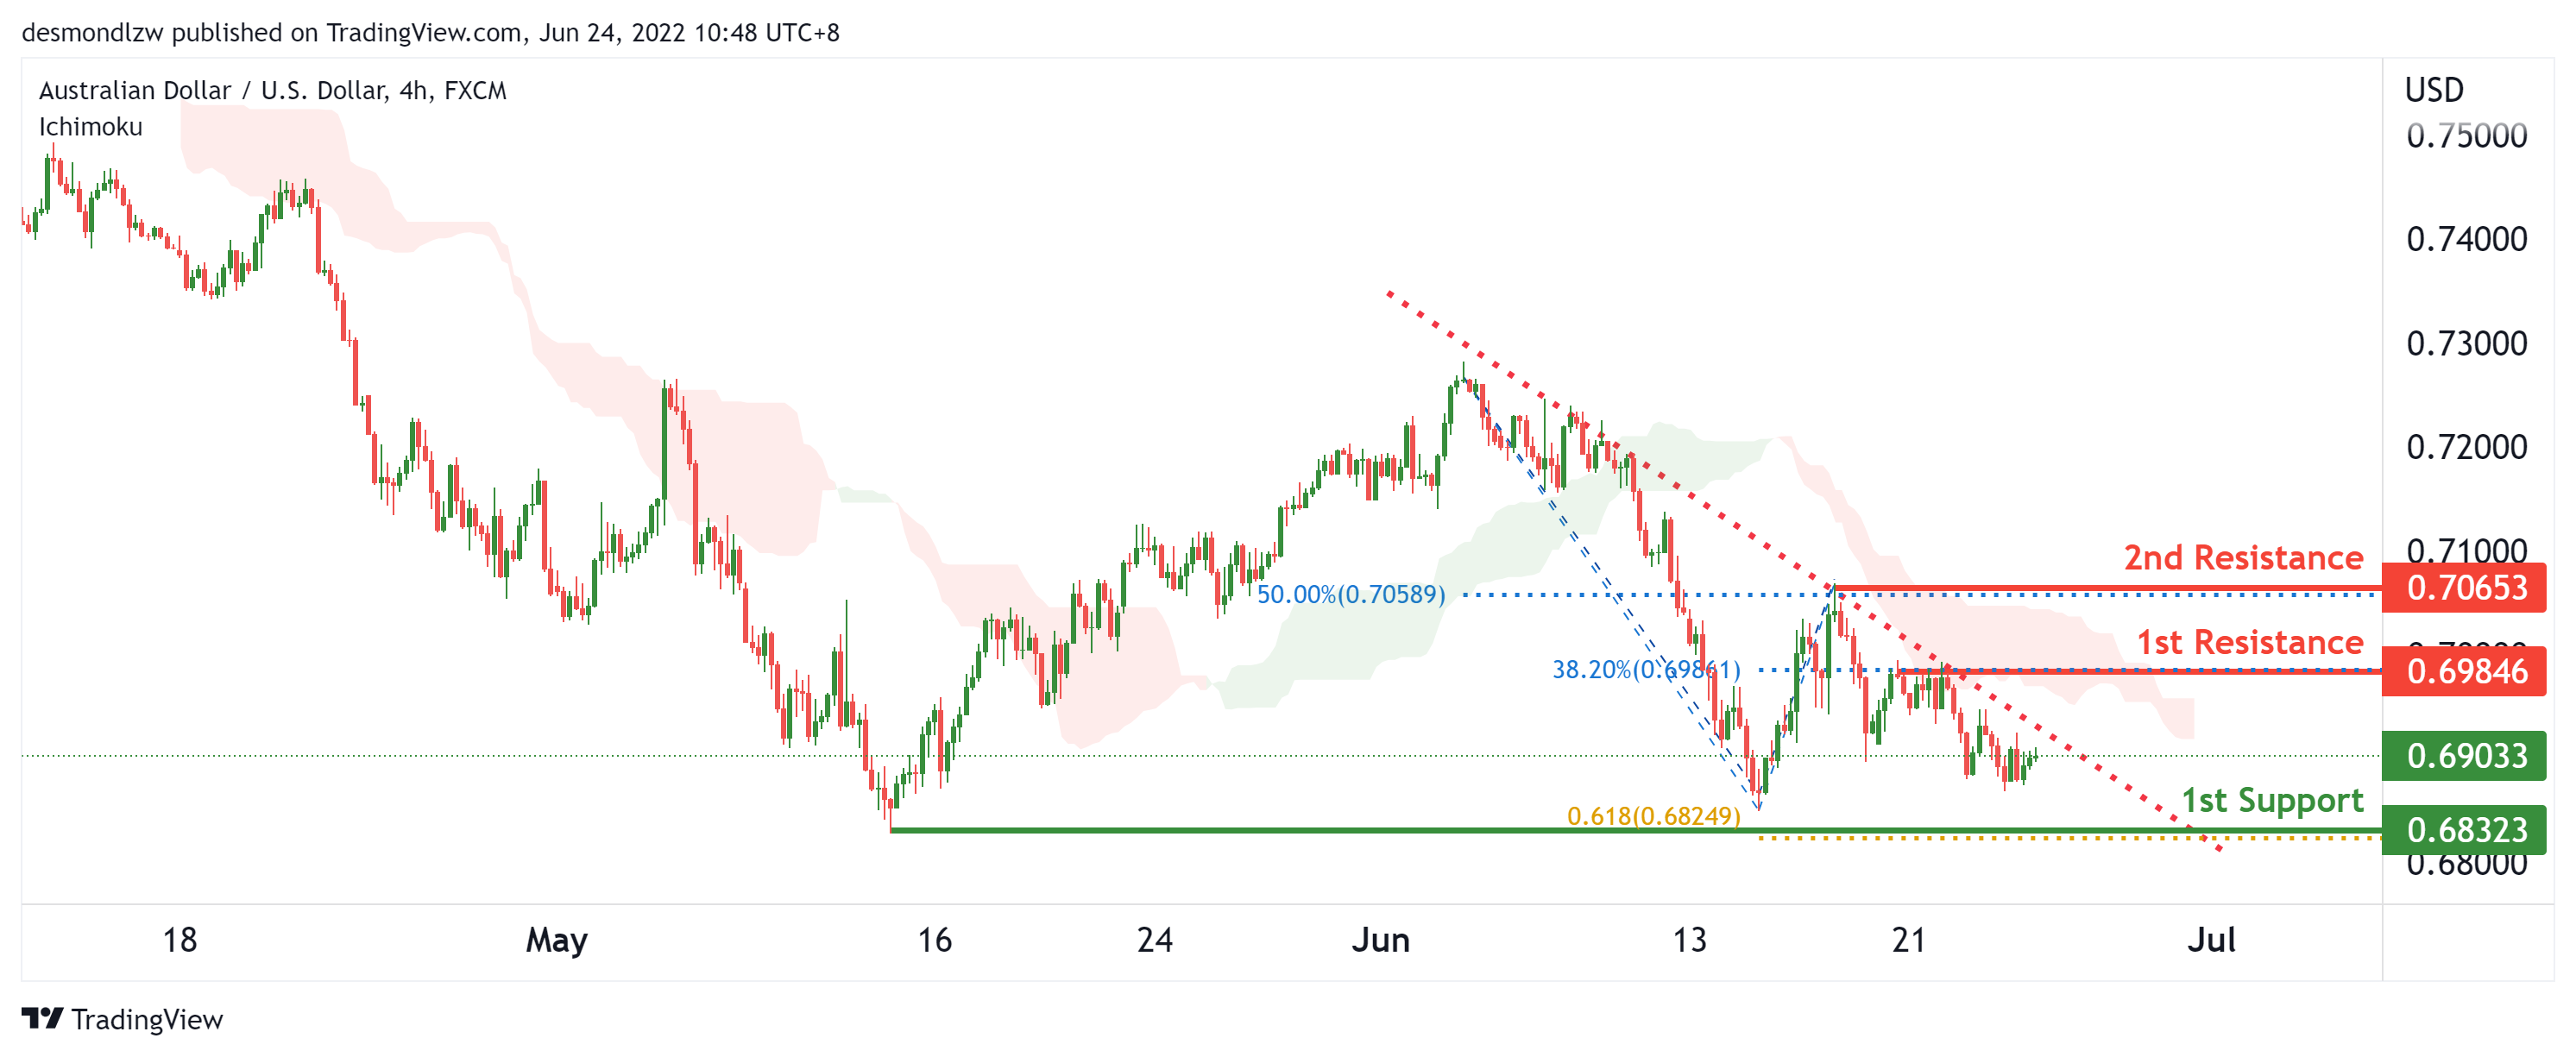
On the H4, with price moving below the ichimoku cloud and in a descending trendline, we have a bearish bias that price will continue to drop from the 1st pullback resistance at 0.69846 in line with the 38.2% fibonacci retracement to the 1st support at 0.68323 in line with the horizontal swing low and 61.8% fibonacci projection. Alternatively, price may reverse off the 1st resistance and rise to the 2nd resistance at 0.70653 in line with the 50% fibonacci retracement and swing high.
Areas of consideration
- H4 1st resistance at 0.69846
- H4 1st support at 0.68323
NZD/USD:
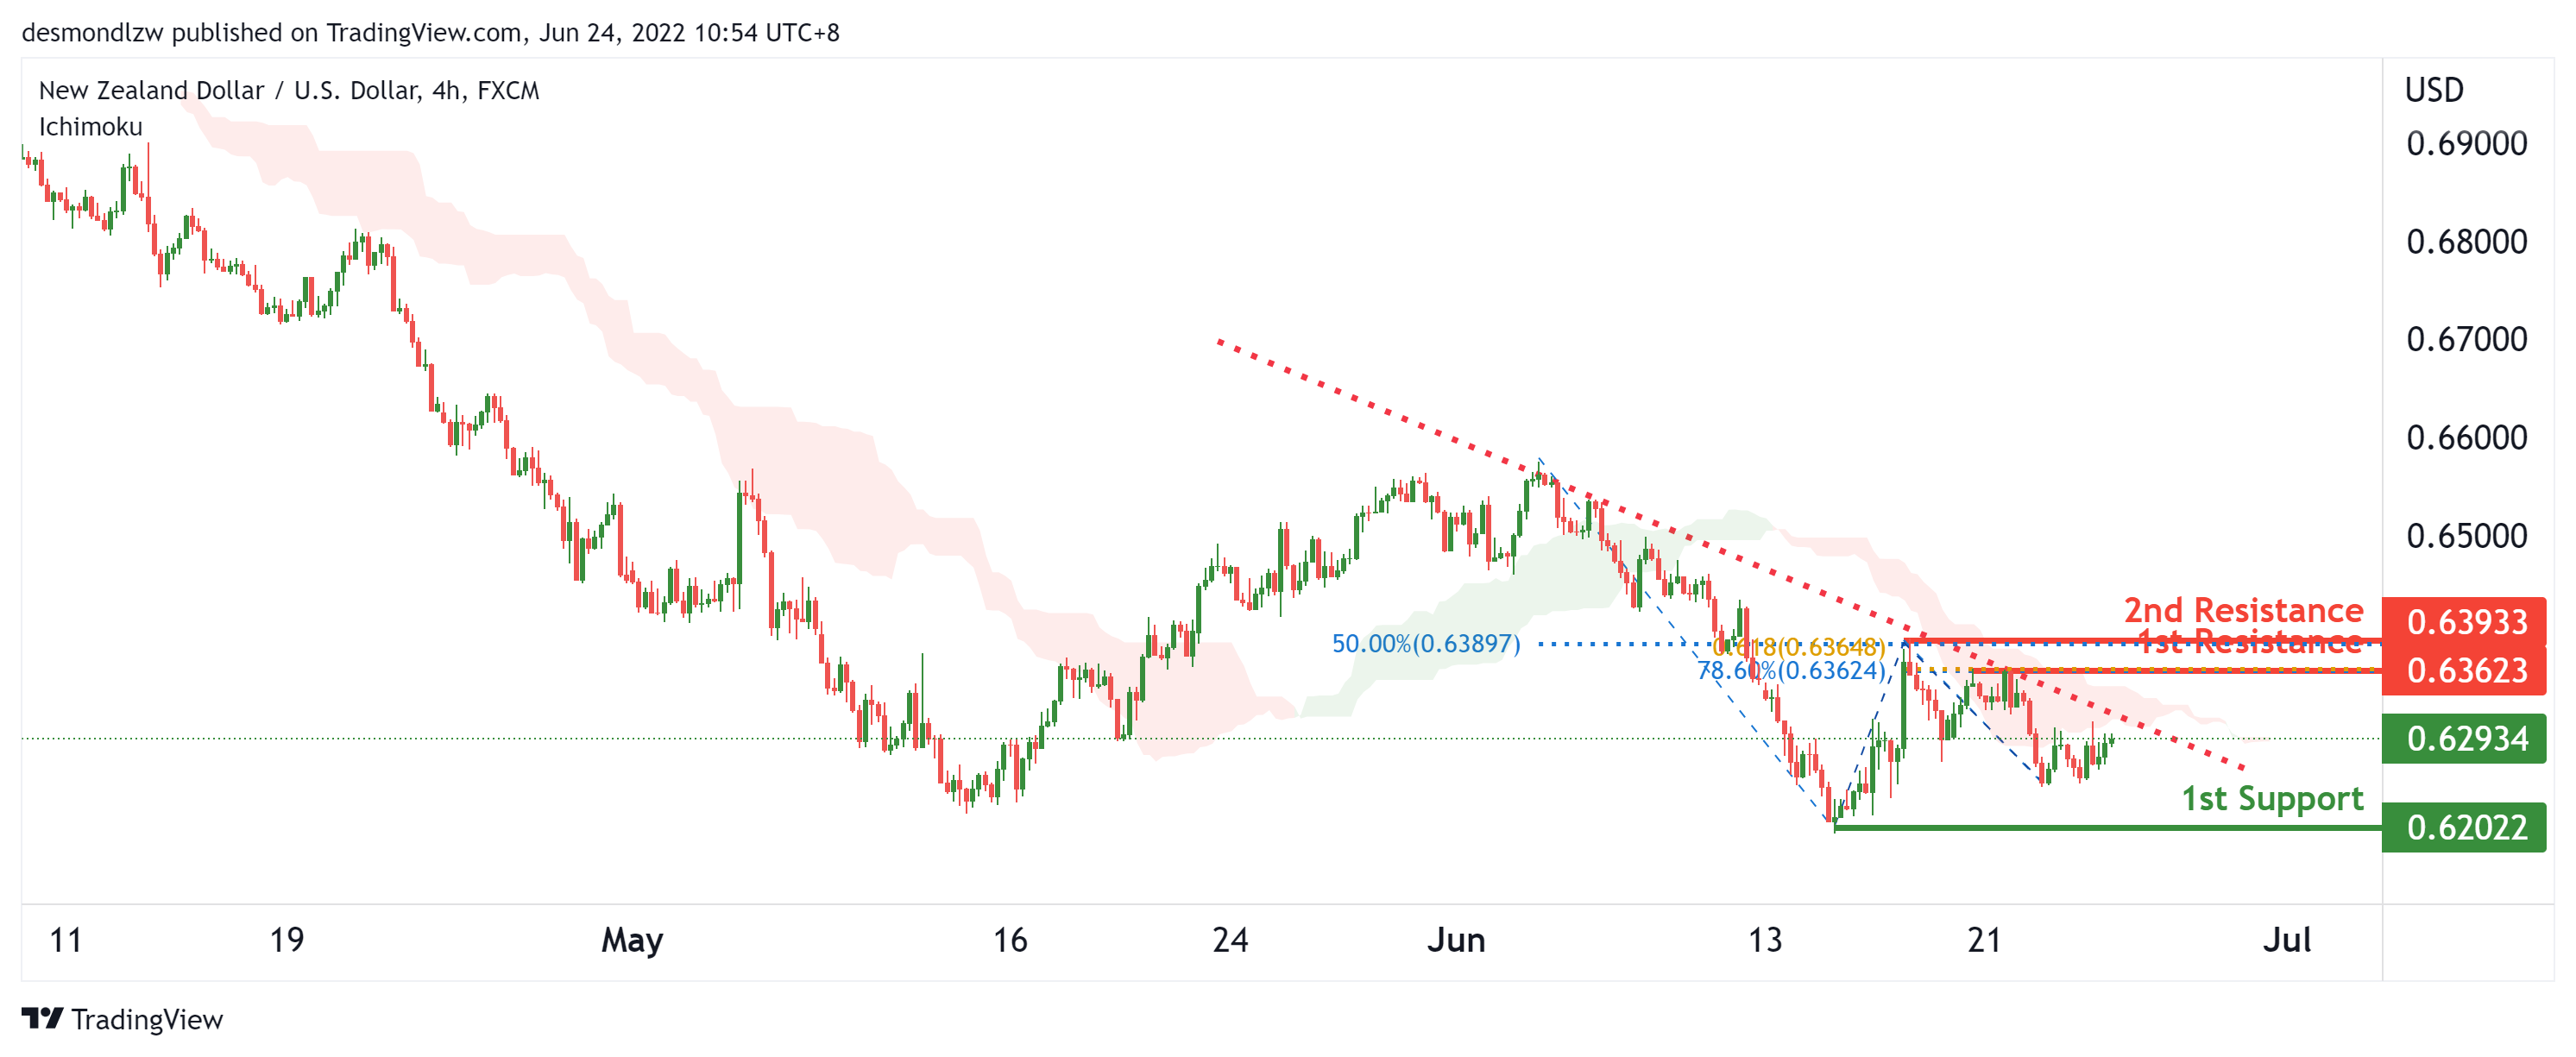
On the H4, with price moving below the ichimoku cloud and in a descending trendline, we have a bearish bias that price will continue to drop from the 1st resistance at 0.63623 in line with the 78.6% fibonacci retracement and 61.8% fibonacci projection, to the 1st support at 0.62022 at the horizontal swing low. Alternatively, price may reverse off the 1st resistance and rise to the 2nd resistance at 0.63933 in line with the swing high and 50% fibonacci retracement.
Areas of consideration:
- H4 time frame, 1st support at 0.62022
- H4 time frame, 1st resistance at 0.6372
USD/CAD:
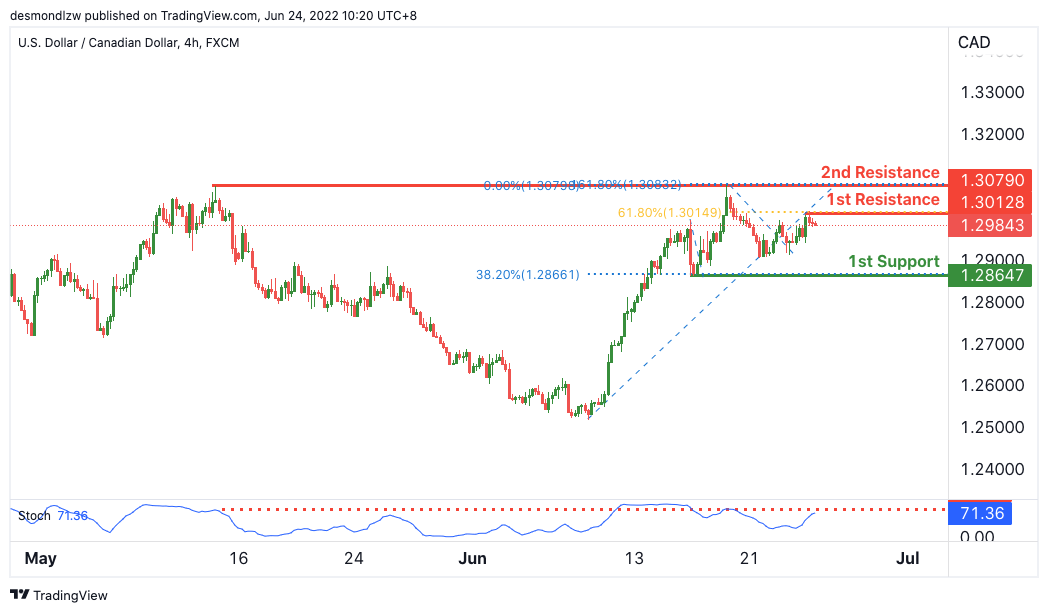
On the H4, with price expected to reverse off the stochastics indicator, we have a bearish bias that price will rise from our 1st resistance where the 61.8% Fibonacci retracement is to our 1st support at 1.28647 in line with the horizontal swing low support and 38.2% Fibonacci retracement. Alternatively, price may head for 2nd resistance where the horizontal swing high resistance and 161.8% Fibonacci projection is.
Areas of consideration:
- H4 time frame, 1st resistance at 1.30128
- H4 time frame, 1st support at 1.28647
OIL:
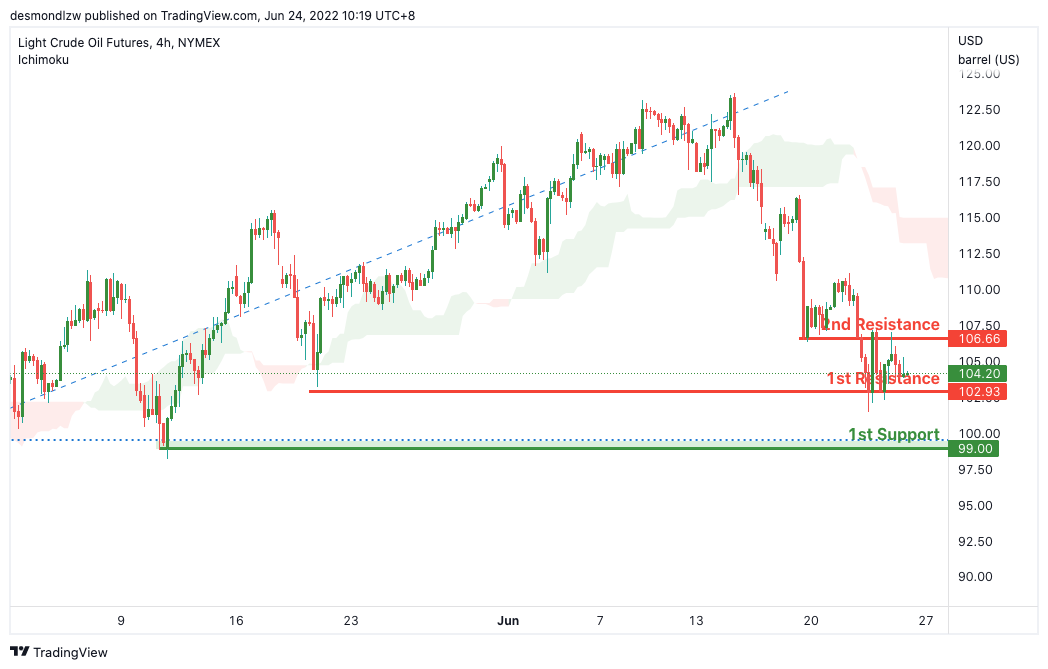
On the H4, with price moving below the ichimoku cloud, we have a bearish bias that price will rise from our 1st resistance where the horizontal pullback resistance is to our 1st support in line with the horizontal swing low support. Alternatively, price may head for 2nd resistance where the horizontal pullback resistance is. Take note that we are waiting for the break of 1st resistance to confirm the bearish continuation.
Areas of consideration:
- H4 time frame, 1st resistance of 102.93
- H4 time frame, 1st support of 99.00
Dow Jones Industrial Average:
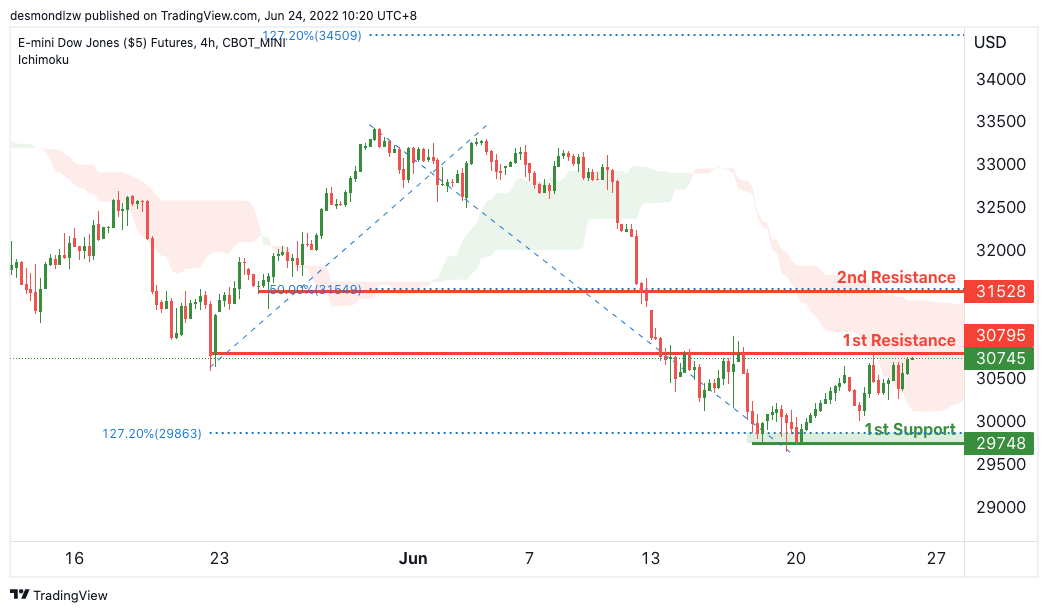
On the H4, with price expected to reverse off the ichimoku cloud resistance, we have a bearish bias that price will drop from our 1st resistance at 30795 where the horizontal pullback resistance is to our 1st support at 29748 in line with the horizontal swing low support. Alternatively, price may head for 2nd resistance where the horizontal pullback resistance and 50% Fibonacci retracement is.
Areas of consideration :
- H4 time frame, 1st resistance at 30795
- H4 time frame, 1st support at 29748
Cliff Notes: The Trade-off Between Inflation and Growth
Key insights from the week that was.
Monetary policy was again the focus in Australia and the US this week. RBA Governor Lowe spoke early in the week, providing an overview of inflation dynamics and the response of monetary policy. During the speech, Governor Lowe highlighted that the “rise in inflation is a global story” but also that domestic conditions are contributing and need to be monitored closely.
For the outlook, the most significant domestic factor is arguably the historic strength of Australia’s labour market which, if inflation expectations become unanchored, could lead to outsized wage claims and persistent support for consumer inflation. At this time, longer-run inflation expectations remain consistent with inflation returning to the RBA’s target range; however, short-term expectations as measured by the Melbourne Institute have recently jumped.
Limited available capacity, the risks to inflation expectations and the “highly stimulatory” starting point for policy were given as justification for the RBA Board’s June decision to lift the cash rate by 50bps in the meeting minutes. While the outlook for policy remains data dependent, it is clear the Board believe they have a lot more work to do. In short: at 0.85%, the cash rate currently remains materially below our estimate of neutral (1.5%-2.0%) and the medium-term neutral expectation of the RBA (2.5%); also, annual CPI inflation is not expected to peak until end-2022, while an easing of capacity constraints in the labour market could take years to fully eventuate given the uncertainties related to migration.
After this week’s developments, we have added an additional 25bps of rate hikes to our forward profile. As detailed by Chief Economist Bill Evans, two more 50bp rate hikes are now forecast for July (unchanged) and August (previously +25bps) to take the cash rate back to the middle of our neutral range (1.85%); after a two-month pause, 25bp hikes at the November 2022, December 2022 and February 2023 meetings are expected to leave the cash rate broadly in line with the RBA’s medium-term neutral level. This peak is well below the market’s expectation, but a stance we believe (in time) will allow inflation to moderate back to target without undue cost to the real economy.
On the data front, the Australian Chamber Westpac Business survey for the June quarter showed Australia’s manufacturing sector in strong form. The rebound in activity from the reopening saw output and new orders expand at a faster pace in Q2, and expectations for further growth in the September quarter remain positive. Manufacturers responded to this by growing their workforce and increasing overtime. That said, the upside for growth is being capped by significant and persistent headwinds. Labour and material shortages were noted as the factors most limiting production and are at their most extreme levels since the oil shock of the mid-1970s. Costs are rising rapidly, squeezing profit margins and putting upward pressure on finished goods prices and hence consumer inflation.
Offshore, the data flow was also light this week, resulting in an acute focus on the Congressional testimony of FOMC Chair Powell. His remarks confirmed significant additional tightening in coming months, in line with our forecasts. However, Chair Powell’s considered commentary also emphasised the FOMC still believe it is possible to remove current inflation risks without causing a recession (and desire to do so), that they are vigilant over the risks to activity, and will adjust the stance of policy to balance out these risks as necessary.
We have greater concern over the underlying strength of US economic activity and so forecast a lower and earlier peak fed funds rate than the market and FOMC (3.375% at December 2022 compared to around 3.8% in 2023). We also forecast a more aggressive and earlier rate cut cycle of 125bps from late-2023.
As a final point, whereas the market is increasingly becoming fixated on the probability and timing of a US recession, to us the bigger concern is the cumulative loss of growth relative to potential into the medium term. Despite strong domestic demand in Q1, GDP contracted on strong imports and soft inventories over the three months to March. Now in Q2, domestic demand has slowed such that the Atlanta Fed nowcast for quarterly GDP growth is pointing to a flat outcome. Furthermore, leading indicators are signalling below trend growth in the second half of 2022; and, with real incomes declining, financial conditions having tightened and a potential negative wealth effect ahead, there is little reason to suspect US growth will pick up materially through 2023 until support from lower interest rates comes through. While the opening up of a material output gap is helpful for containing inflation, clearly it also puts long-term productivity and wealth at risk.
Elliott Wave View: GBPJPY Correction Can Extend
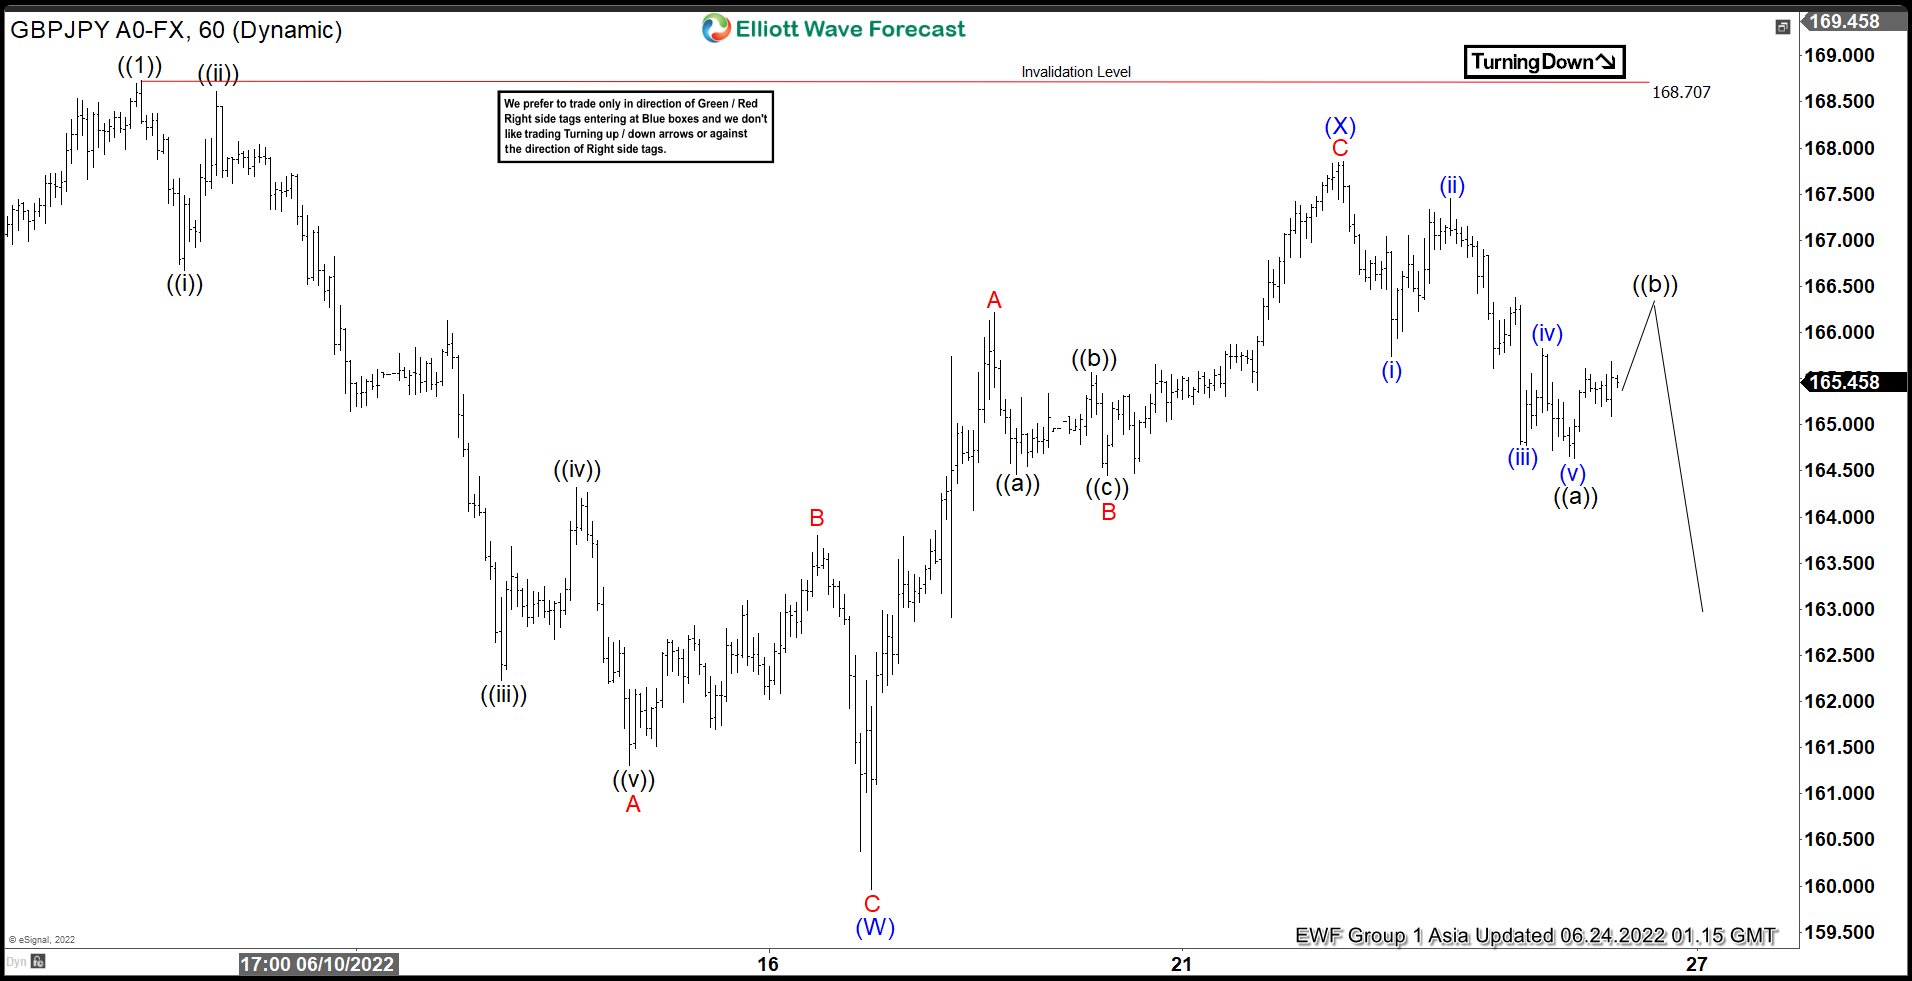
Short term Elliott Wave in GBPJPY suggests cycle from 12/3/2021 low has ended as wave ((1)) with the rally to 168.7. Wave ((2)) pullback is currently in progress to correct cycle from December 2021 low. Internal subdivision of wave ((2)) is unfolding as a double three Elliott Wave structure. Down from wave ((1)), wave A ended at 161.31 and rally in wave B ended at 163.8. Pair then extended lower in wave C towards 159.96 and this completed wave (W).
Wave (X) rally ended at 167.856 with internal subdivision as a zigzag structure. Up from wave (W), wave A ended at 166.22 and pullback in wave B ended at 164.44. Final leg higher wave C ended at 167.85 which also completed wave (X). Pair has started to turn lower in wave (Y). Down from wave (X), wave ((a)) ended at 164.63. Expect rally in wave ((b)) to correct cycle from 6/22/2022 high before the decline resumes. Near term, while pivot at 167.85 high and more importantly at 168.7 remains intact, expect rally to fail in 3, 7, or 11 swing for further downside. Potential target lower for wave (Y) is 100% -123.6% Fibonacci extension of (W) which comes at 157 – 159.1 area.
GBPJPY 60 Minutes Elliott Wave Chart
EURJPY Wave Analysis
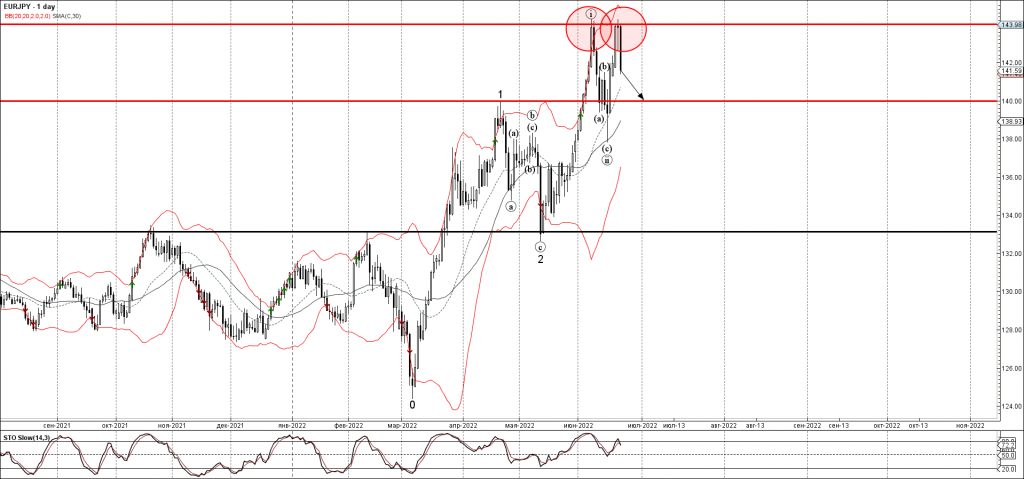
- EURJPY reversed from resistance level 144.00
- Likely to fall to support level 140.00
EURJPY currency pair earlier reversed down from the pivotal resistance level 144.00 (top of wave (i) from the start of June), standing close to the upper daily Bollinger Band.
The downward reversal from the resistance level 144.00 will form the daily Evening Star – if the price will close now near the current levels.
Given the bearish divergence on the daily Stochastic indicator, EURJPY can be expected to fall further toward the next support level 140.00.
Will Japan’s CPI Inflation Data Move the Yen?
The Bank of Japan has been the black sheep of all central banks, rigidly denying abandoning its ultra-easy monetary policy even if the long-sought inflation pressures have finally showed up in the economy. Investors, however, are less patient than the BoJ, and have already started to bet against it, making Friday’s inflation figures quite important to watch. Expectations are for the core CPI rate to hold steady and although the safe-haven yen is well known about its passive reaction to data releases, any deviations may find yen traders sensitive for the first time after a long time.
What’s the point of yield curve control?
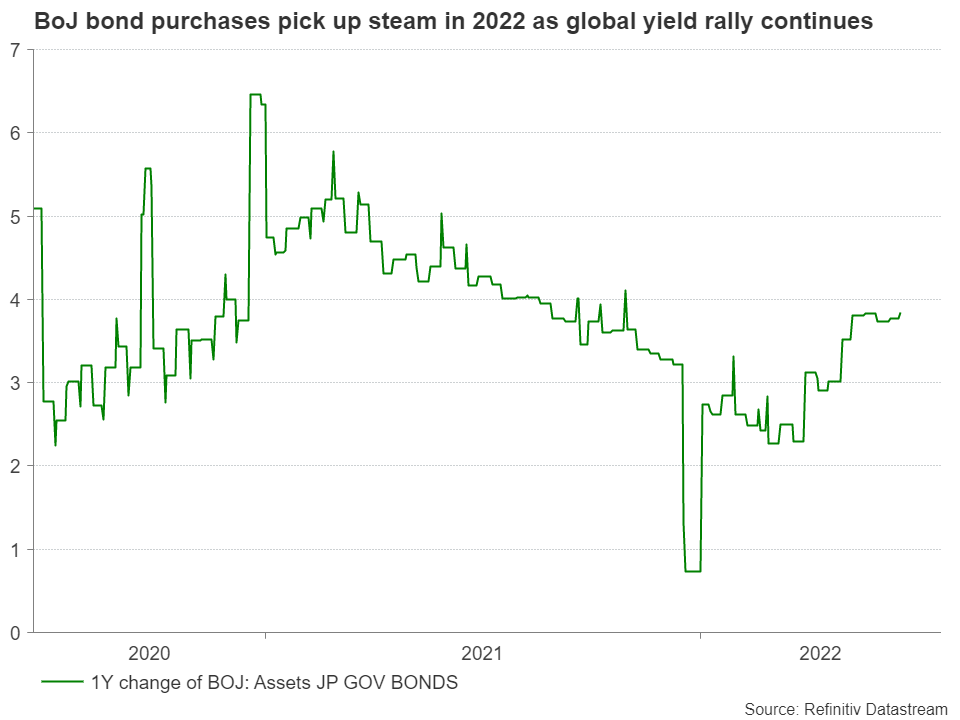
In 2016, the BoJ implemented yield curve control under Kuroda’s leadership as inflation was far below its 2.0% target, despite a couple of years of quantitative easing measures and low interest rates. In other words, it committed to buy as many bonds as needed, stimulating the economy with more liquidity, by pegging its long-term 10-year yield at 0%. Was that successful? Well, the answer is no. Inflation barely moved, while the switch to a more flexible yield curve control to 0.25% last year could not prevent the central bank’s balance sheet from further ballooning to around 135% of GDP – the highest among other central banks.
Inflation is not problematic so far
The inflation backdrop however changed suddenly when the pandemic-related supply jitters and the war in Ukraine send price shockwaves across the global economy, forcing even Japanese businesses, who are prominent for their deflationary mindset, to pass through rising production costs to consumers.
The headline CPI inflation is currently comfortably above the central bank’s 2.0% target at 2.5% y/y, while the core measure, which policymakers use as a reference for policy adjustments, is expected to remain steady at 2.1% y/y in May. That is a tight call, making any deviations likely as several major economies faced sharper price increases during the same month.
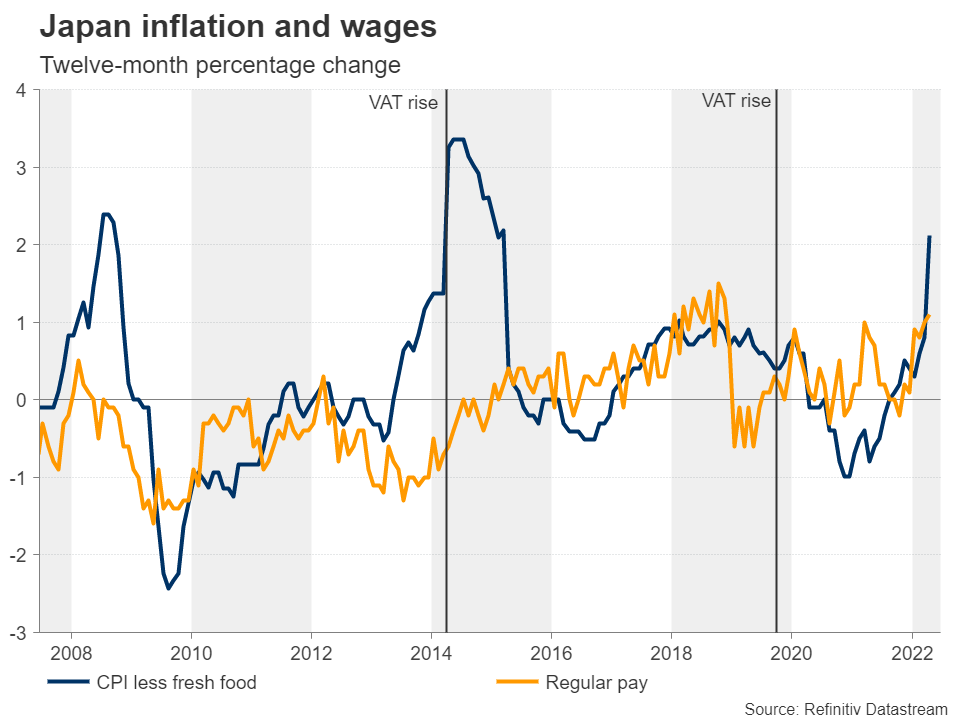
Nevertheless, if forecasts prove correct or underestimate the actual results on Friday, inflation would still be relatively less problematic than in other major economies. Hence, the BoJ will have little reason to abandon its rock-bottom interest rates before it sees a sustainable rise above 2.0% for more than a year, as the BoJ deputy governor recently argued; he also suggested that fiscal and energy policy would be a more appropriate tool to tackle price increases led by external factors, while highlighting that a potential hawkish policy change would make the economy move in the wrong direction after a soft stagnation in the first quarter.
Hence, policies other than monetary policy will remain preferable to ease inflation pressures, especially as the clock ticks down to the House elections on July 10, which Kishida's ruling party is expected to win.
How long will the BoJ stay on the sidelines?
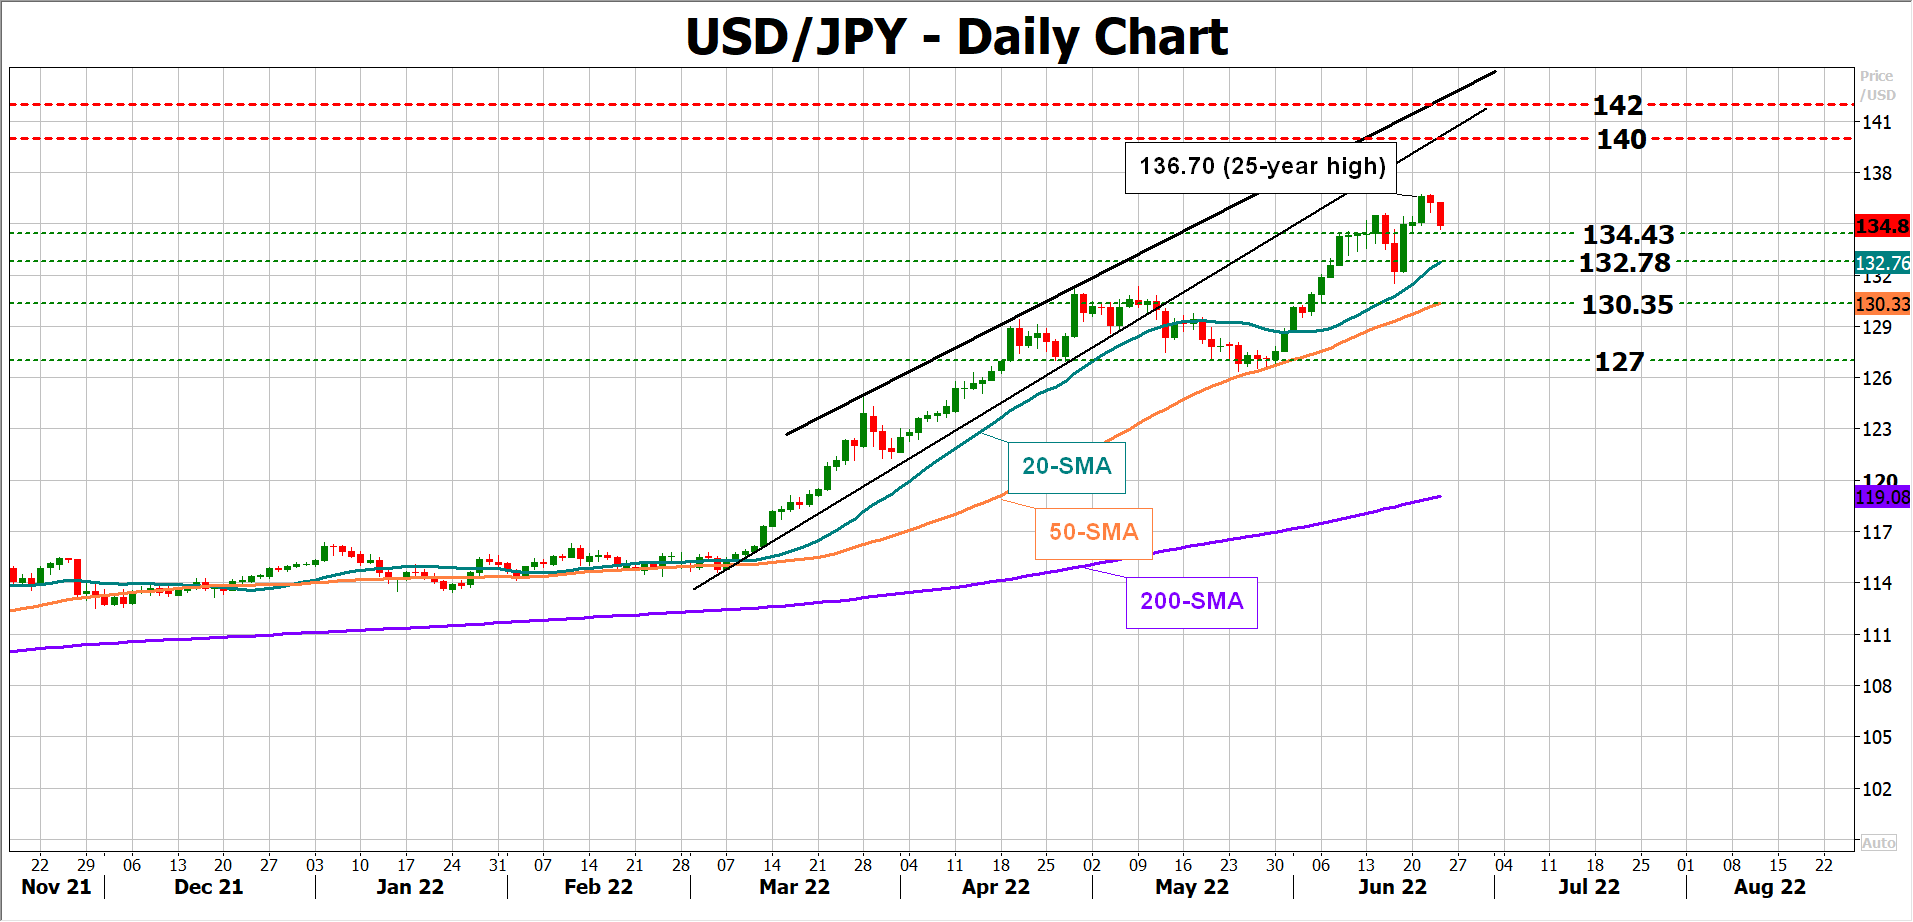
The battle, however, will not be easy. The verbal intervention from officials has been useless so far, as growing policy divergence between the Fed and the BoJ further bolstered bond yields. Analysts estimate that the central bank has spent a record amount of $80 billion in bond purchases last week to bring the 10-year yield back to 0.25%. Outstandingly, that is triple the $27 billion monthly purchase the ECB conducts and 20 times the pace of the Fed’s in 2021, adjusting for the size between the two economies. Consequently, the huge bond buying sent the yen sinking to a 24-year low of 136.70 per dollar, raising speculation that the freefall in the currency may force the BoJ to give in sooner than expected this year.
Well, the safe-haven yen could still find buyers as long as global recession fears linger on the horizon, while a potential deterioration in the US economic outlook after July’s super-sized rate increase could signal a slowdown in the Fed tightening plans, breathing some life back to bond markets too. Also note that Japan is still well-backed by foreign reserves, holding $9.6tr in foreign assets with liabilities of $6.5tr. Therefore, a huge capital flight is less likely as long as the R word drains investors’ mind.
If downside risks prove manageable, and inflation remains elevated instead, the BoJ may declare victory over its price stability goal, likely removing its cap on yields before raising its benchmark rate. For now, an intervention in FX markers looks more likely than a policy tweak as the BoJ clearly messaged lately, especially if dollar/yen extends its rally towards the 140.00 key level.
USD/JPY
As regards the data impact, the BoJ’s loose monetary policy is not completely warranted in the year ahead. Therefore, an upside surprise in Friday’s inflation readings could temporarily push dollar/yen lower, especially if such a result reveals that demand factors have contributed to a larger extent to price increases, elevating the subdued inflation expectations too. In this case, the pair could head for the 20-day simple moving average (SMA) at 132.78, where any step lower would bring the 50-day SMA at 130.35 next on the radar.
Otherwise, a lower-than-expected CPI could endorse the BoJ’s dovish stance, boosting dollar/yen above its latest peak of 136.70 and towards the 140.00 - 142.00 crucial zone.
Fed Bowman expects one more 75 bps hike, followed by subsequent 50bps hikes
Fed Governor Michelle Bowman said in a speech she expects to "support additional rate increases until we see significant progress toward bringing inflation down".
Based on current inflation readings, she expects that "an additional rate increase of 75 basis points will be appropriate at our next meeting as well as increases of at least 50 basis points in the next few subsequent meetings"
Bundesbank Nagel: Inflation expectations de-anchoring is worrying
Bundesbank President Joachim Nagel said: "The risk of inflation expectations becoming de-anchored has risen over the past months. Risks to price stability exist."
"Inflation expectations of households and firms in Germany are somewhat less anchored than, say, a year ago," he said. "The increase is worrying."
"If monetary policy falls behind the curve, even stronger hikes in interest rates could become necessary to get inflation under control," Nagel warned. "This would create much higher economic costs."
Choppy Trading Continues
It's been a rather choppy week in financial markets and we're seeing that reflected again on Thursday, with European stocks back in negative territory after recovering losses earlier.
Equity markets have fallen heavily over the last couple of weeks as aggressive tightening and heightened recession fears weigh heavily on risk appetite. They may now be establishing a temporary bottom as yields ease off their highs but don't get too excited. The outlook is highly uncertain, and economic risks are heavily tilted to the downside, making any significant stock market recovery challenging.
Slowly but surely, central banks are coming around to the idea that recessions may be the price to pay for price stability. Some are better placed than others to weather the storm but even they may ultimately get swept up in it eventually.
That came across during Jerome Powell's appearance in front of the Senate Banking Committee on Wednesday. Referring to a recession as "certainly a possibility", the Fed Chair appears to be edging towards waving the white flag on the economy, following in the footsteps of his peers here in the UK.
Perhaps that's why we're seeing yields easing over the last week. A recession is obviously not the desired outcome but it could in theory mean interest rates not rising as much. Still not a good reason for stock markets to undergo any significant recovery though. The outlook is uncertain at best until the inflation data shows signs of improving.
CBRT continues to turn a blind eye
The CBRT kept interest rates unchanged at 14% today. This section is going to be quite short as there's nothing new to add on the Turkish central bank. It remains committed to its monetary policy experiment despite 73.5% inflation and a plunging lira. The fact that it's undertaking such an experiment at arguably the worst moment in decades as other central banks scramble to hike rates and rein in what they consider to be sky-high single-digit inflation makes the stubbornness of the CBRT all the more ridiculous.
Are oil traders buying the dip?
Oil prices have recovered earlier losses to trade modestly higher on the day. It's been quite the correction in oil with all the talk of recession proving to be the counterforce to a tight market. Let's not get carried away though, we're still in triple figures and I don't see a strong case for the price to retreat too far. That's naturally dependent on how serious the threat of recession becomes but right now, price risks remain tilted to the upside. Today's recovery may even be a sign of traders flooding back in to buy what has been a decent dip in a very short period of time.
Worst yet to come?
Bitcoin continues to hang on in there around $20,000 but it's far from convincing. There still doesn't appear to be an enormous amount of appetite at these levels and while it has shown some resilience, I'm not convinced it can hang on. There's plenty of support below though but it may just be the case that it's going to get worse before it gets better.