Sample Category Title
Elliott Wave View: Further Downside in Nasdaq
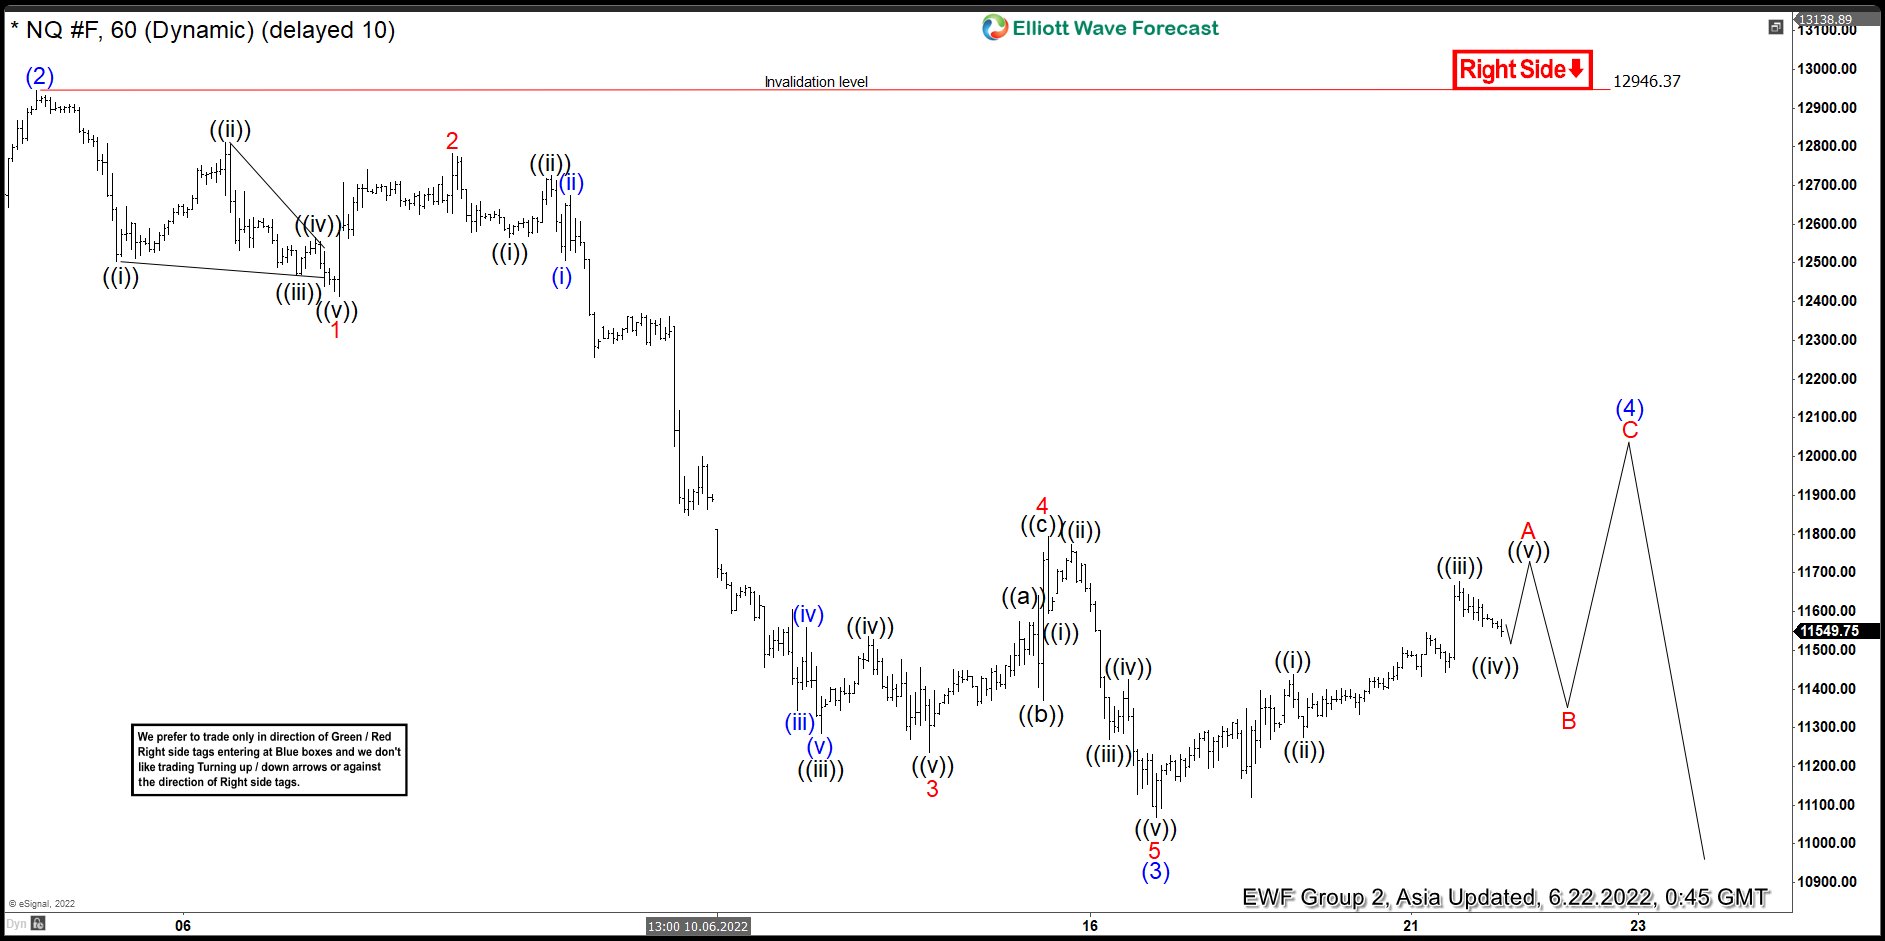
NASDAQ ($NQ) broke below previous low on 5/20/2022 at 11490.50 and opens up a bearish sequence favoring further downside. The entire decline from 11/22/2021 high is unfolding as a zig zag Elliott Wave structure. A zig zag structure is a 3 swing corrective structure where A, B, and C subdivides into 5-3-5 waves. Down from 11/22/2021 high, wave ((A)) ended at 13024.50, and rally in wave ((B)) as expanded flat ended at 15275.75. Index then extended lower with subdivision as an impulse in wave ((C)). Wave ((C)) has internal subdivision of 5 waves.
The 60 minutes chart below shows the decline from wave (2) of ((C)) high unfolded as an impulse Elliott Wave structure to complete wave (3) of ((C)). Down from 12966.37, wave 1 ended at 12412.14 and rally in wave 2 ended at 12786.04 Index then extended lower in wave 3 towards 11235.06. Rally in wave 4 finished at 11794.52 and last push lower to complete wave 5 of (3) ended at 11068.88. Currently the Index is rallying in 3 swing higher in wave (4) before the decline resumes as far as pivot at 12966.37 stays intact.
Nasdaq ($NQ) 60 Minutes Elliott Wave Chart
Brent Wave Analysis
- Brent reversed from key support level 111.80
- Likely to rise to resistance level 115.00
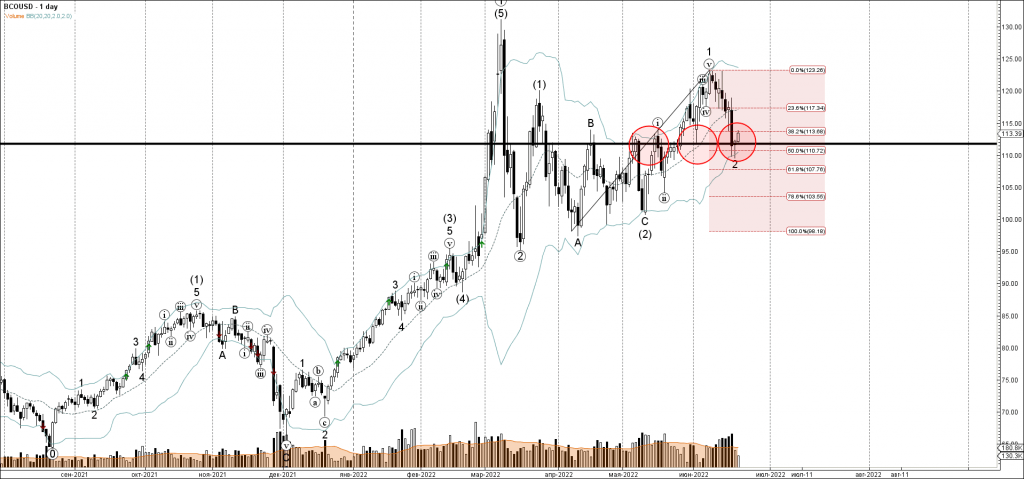
Brent crude oil earlier reversed up from the key support level 111.80 (former strong resistance from April and May) – which completed the earlier correction 2.
The support level 111.80 was further strengthened by the lower daily Bollinger Band and by the 50% Fibonacci correction of the upward impulse from April.
Given the predominant daily uptrend, Brent crude oil can be expected to rise further toward the next resistance level 115.00.
USDJPY Wave Analysis
- USDJPY broke key resistance level 135.50
- Likely to rise to resistance level 137.25
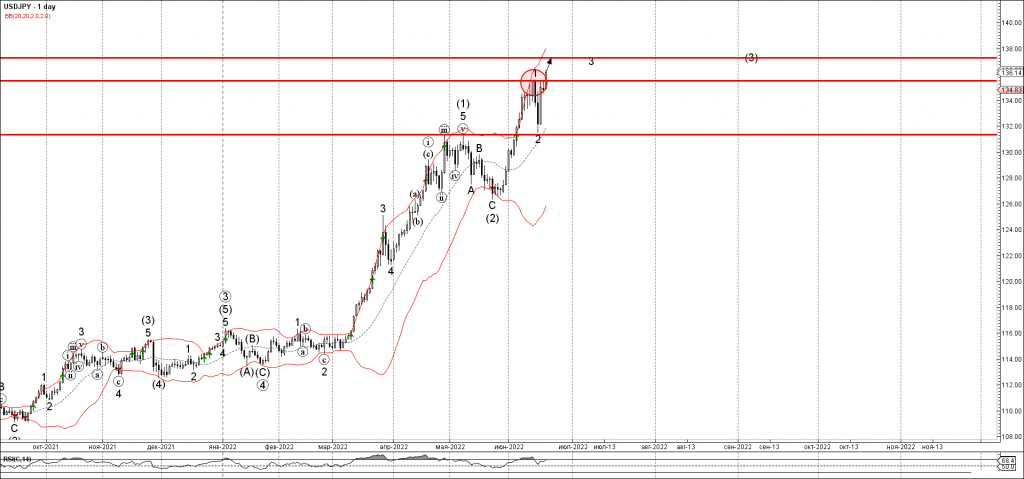
USDJPY currency pair today broke above the key resistance level 135.50 (which stopped the earlier minor impulse wave 1 at the start of June).
The breakout of the resistance level 135.50 should accelerate both of the active impulse waves 3 and (3).
Given the clear daily uptrend and the continued yen outflows, USDJPY currency pair can be expected to rise further toward the next resistance level 137.25 (target for the completion of the active minor impulse wave 3).
Eurozone PMIs: Slowing Down But No Recession Yet
The flash PMI releases by S&P Global are one of the monthly highlights of the Eurozone calendar as the forward-looking indices tend to track GDP growth in the euro area quite closely. The first look at the June readings is due Thursday (08:00 GMT) and investors will be scouring for clues about how close the Eurozone economy is to stagflation. The forecasts suggest the danger is quite low for now. But can the data offer the bruised euro any relief?
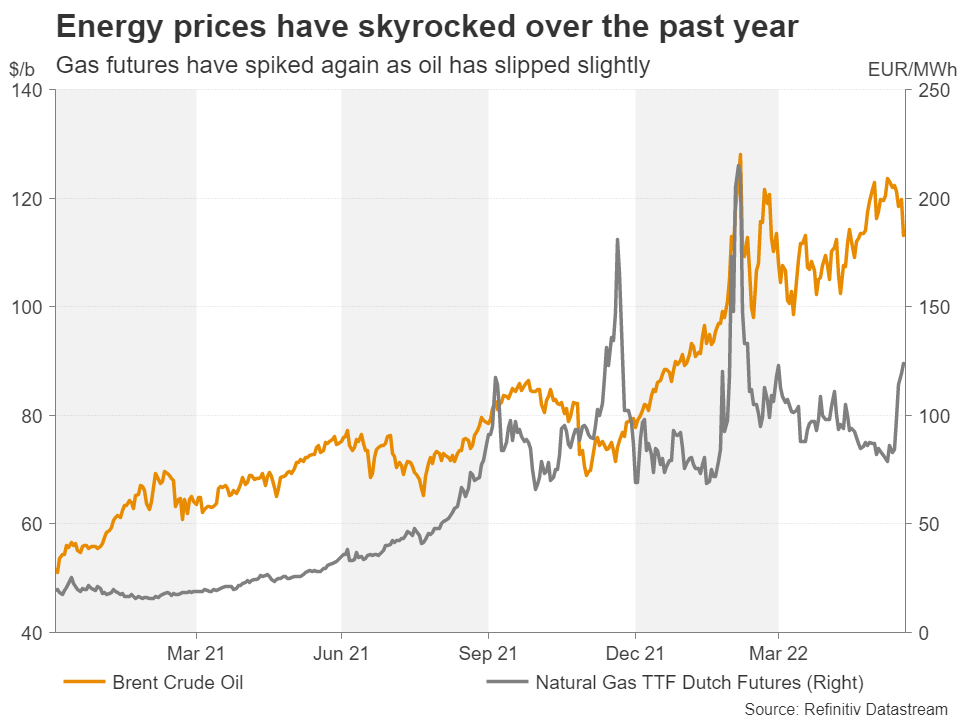
No let-up in energy crisis
Ever since the war in Ukraine erupted, there has been no let-up in Europe’s energy crisis. Just as oil prices have started to pull a little lower, gas futures are spiking again after Russia began to reduce shipments to major European buyers. The prospect of energy prices staying elevated for longer does not bode well for the monetary policy outlook.
The European Central Bank is almost certain to hike interest rates by 25 basis points at its July meeting and calls for a larger increase in September are growing louder. Although the policy paths of the ECB and Federal Reserve have diverged significantly this year, the two central banks are similar in that they are both leaning against the strength of their respective economies as they plough ahead with tightening policy during these highly uncertain times.
Eurozone GDP grew a lot faster than projected in the first quarter, but inflation has also been a lot stronger than anticipated; the headline CPI rate hit 8.1% y/y in May. The massive energy-driven surge in inflation since the beginning of the year combined with a surprisingly resilient economy make it all the more likely that the ECB will hike interest rates very aggressively over the coming months.
Still expanding
But this would carry a lot of risks as raising rates too rapidly could choke off economic growth. Survey data already point to some loss of momentum. The euro area’s composite PMI, consisting of the manufacturing and services sectors, fell slightly to 54.8 in May and is expected to have moderated further in June to 54.0. The slowdown in manufacturing seems to be more pronounced amid the shift to services, as European economies fully reopen, as well as the ongoing supply constraints. The manufacturing PMI could hit the lowest in June since November 2020.
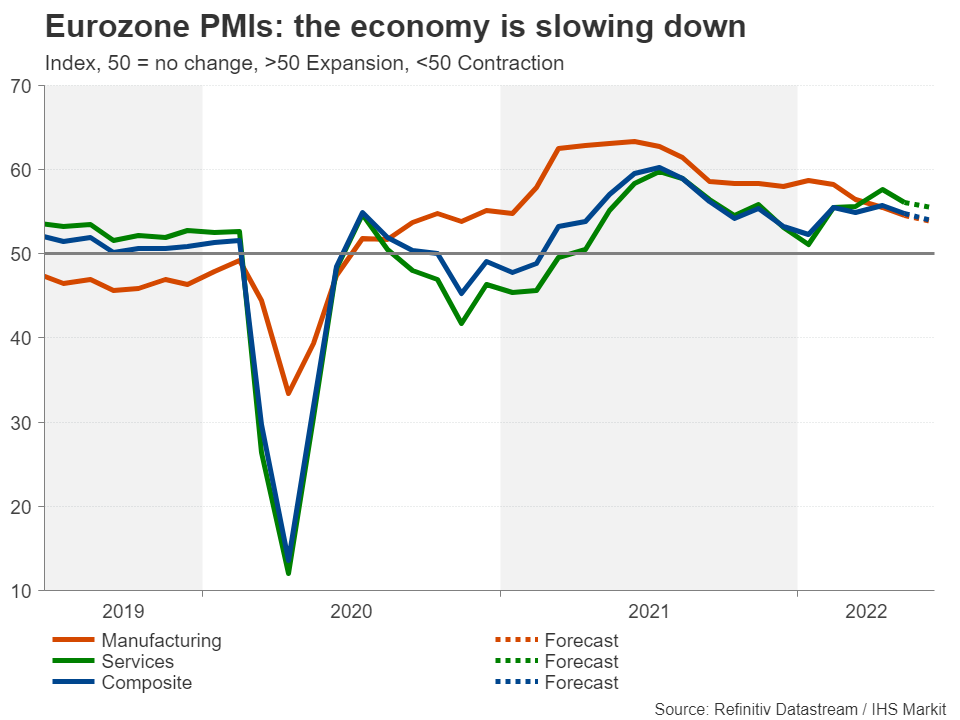
Nonetheless, stagnation does not appear to be on the near-term horizon, let alone a recession. Even Europe’s rigid labour market has come out of the pandemic in stronger shape than before, giving policymakers additional credence to begin normalizing policy.
Euro is bouncing higher, but does it have enough legs?
Should the June PMIs underscore the view that the Eurozone economy is merely losing steam but is far from recessionary territory, the euro could extend its latest bounce back. Euro/dollar is currently testing the 50% Fibonacci retracement of the May uptrend at $1.0567. A climb above this level would bring into focus the 50-day moving average, which is about to intersect the 38.2% Fibonacci of $1.0619, before traders turn their attention to the May peak of $1.0786.
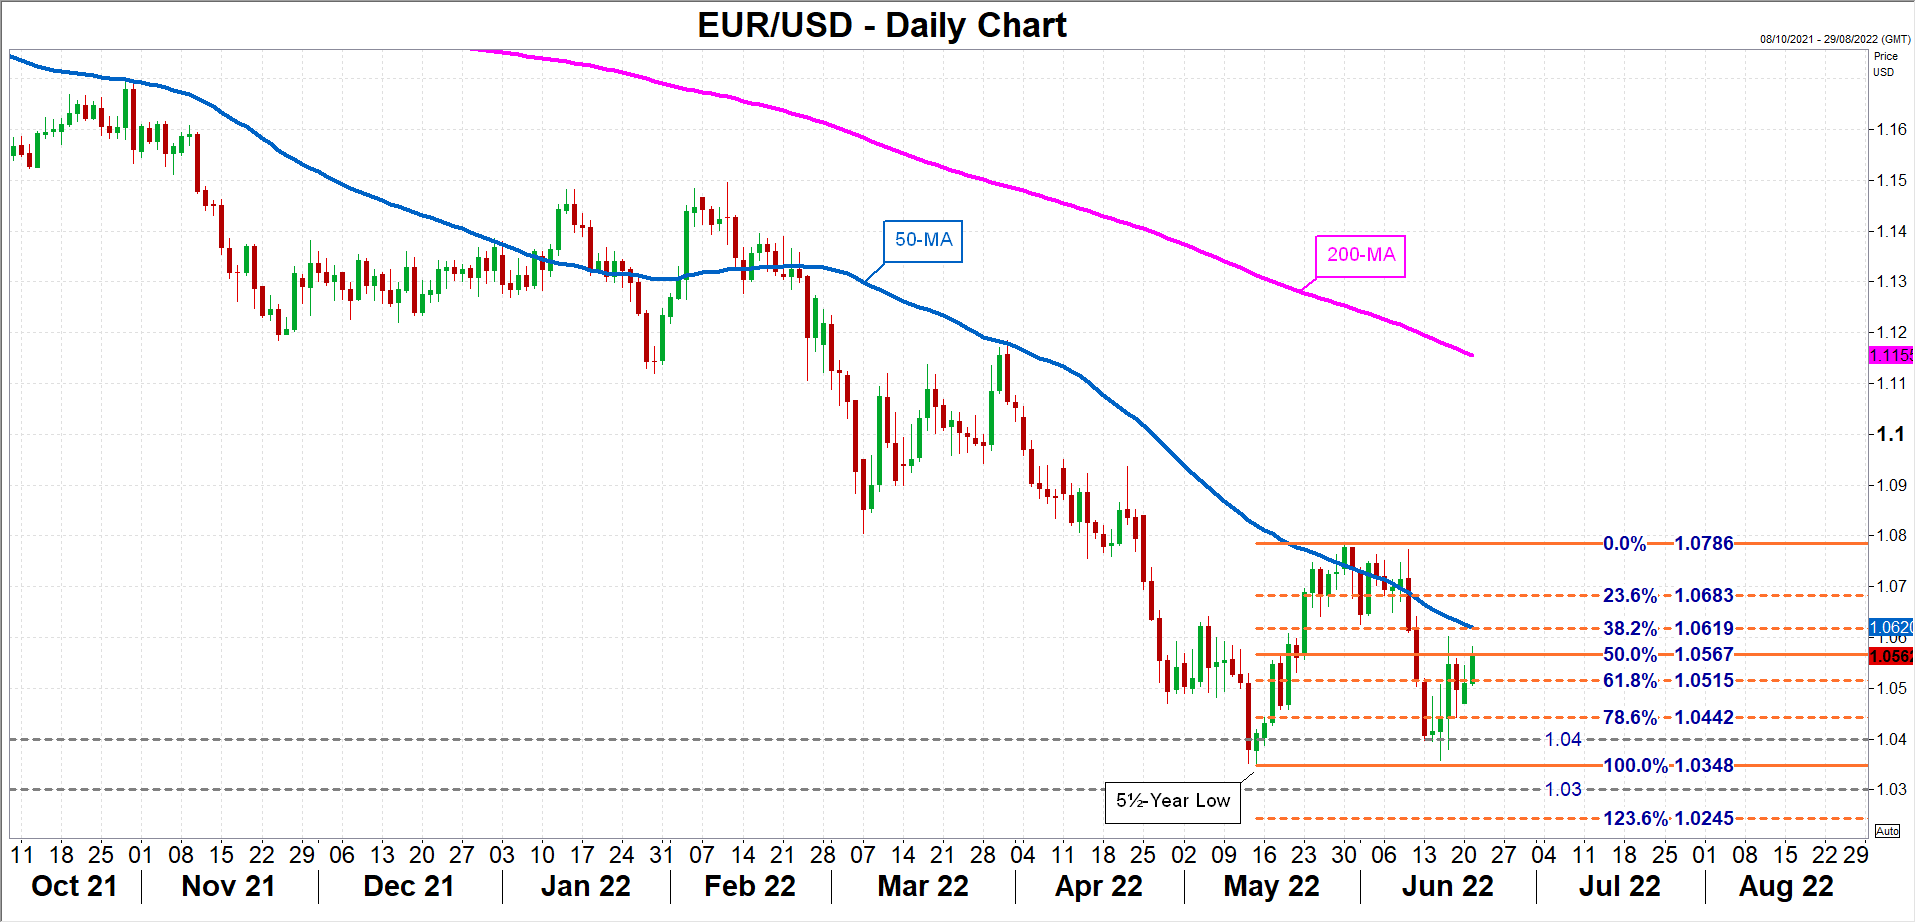
However, any negative shocks in the PMI data could cause the rebound to falter, risking a re-test of the $1.04 level. Breaching this support could accelerate the selloff initially towards the May tough of $1.0348 and then towards the 123.6% Fibonacci extension of $1.0245.
In the somewhat more medium term, the euro is likely to consolidate during the course of the summer as investors will be watching how the growth and inflation outlooks evolve for clues as to how aggressively the ECB will act later in the year. Though, whether the Fed remains as hawkish as it currently is will be just as crucial in determining the euro’s direction.
S&P500 Bounces Back from Oversold, But What’s Around the Corner?
The US market opens later today after a long weekend. S&P500 futures indicate a 1.5% gain to Friday’s closing level, playing off the positive outperformance on the outside. The currency market has also swung towards buying risky assets, reinforcing hopes of at least a rebound in the coming days after a 13.5% dip from the highs to the lows of the month in the first two weeks of June.
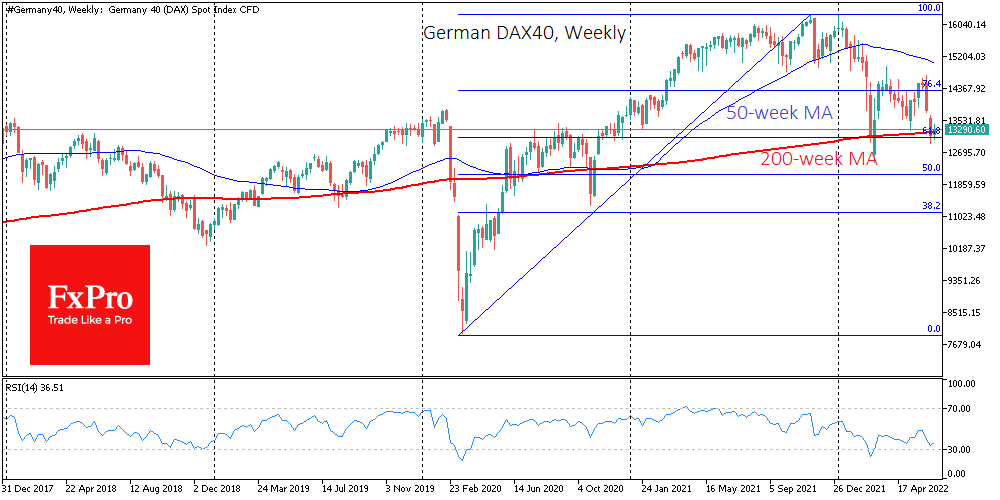
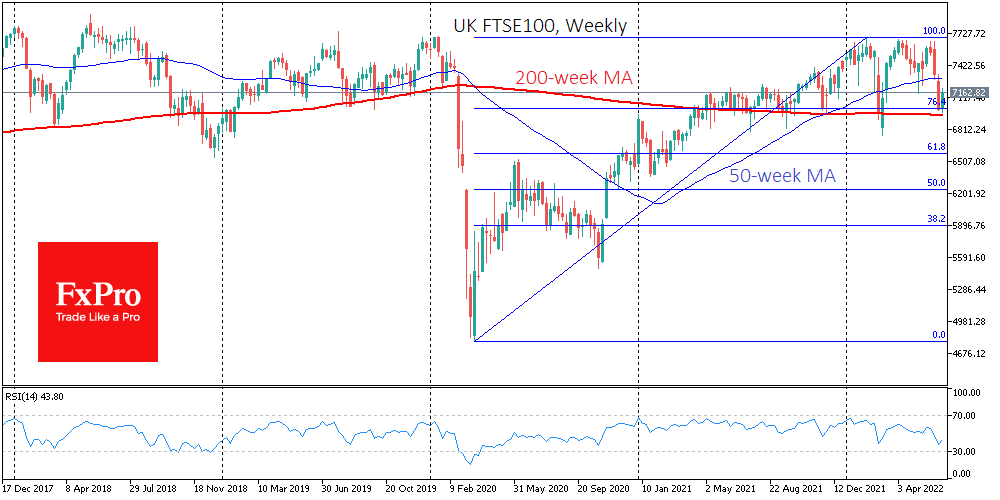
In equities, the positive tone is set by the performance of Asian equities and the recovery of major European indices from oversold territory. The DAX40 and FTSE100 are recovering from their lows of March. Both indices have stuck within the Fibonacci retracement pattern and got support at 61.8% for DAX and 76.4% for FTSE from the pandemic amplitude.
The weakening of the traditional shelter currencies – JPY, CHF – is setting a positive tone. The USDJPY has updated to a new high since 1998, above 136, indicating a return of risk appetite in some financial market segments. USDCHF settled near 0.9660, stopping the decline after last week’s unexpected SNB rate hike.
The euro and the pound are also gaining against the dollar, signalling a recovery in risk appetite.
However, it is essential to note the fragility of the current rebound. Most likely, we will see a corrective bounce after the worst week in equities in more than two years.
However, finding medium-term reasons to buy “risk” is still tricky. Aside from the BoJ, the main central banks are tightening policy or promise to do so as soon as next month. And so far, we see no sign that this trend is about to end or reverse.
Thus, cautious investors can still only tune in for a short-term bounce but do not hold out hope that the markets have bottomed out. The bear market in the USA will likely continue until we hear from the Fed the first hints of a halt to aggressive policy tightening. Until then, a bear market with occasional corrective bounces is likely.
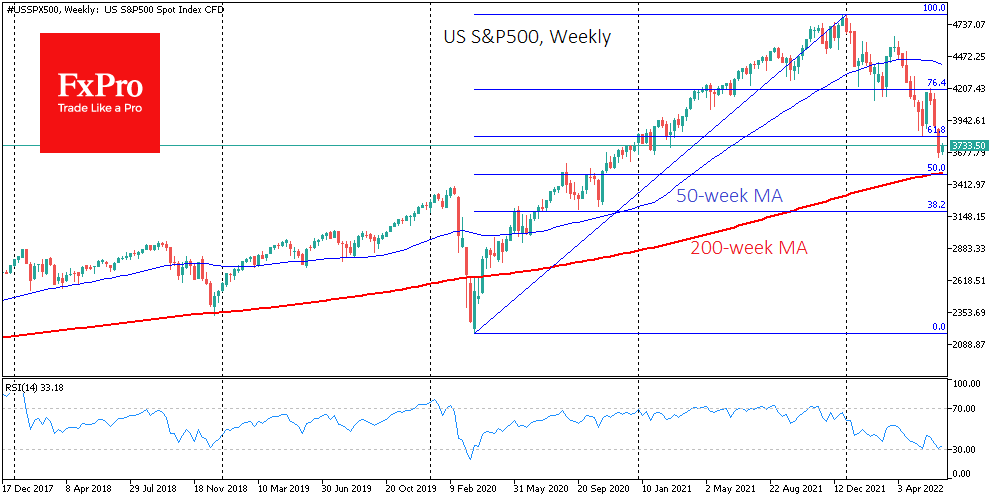
History also tells us that after entering a bear market phase and losing 20%, the market loses about another 20% on average (about 2900 for the S&P500) before it finds its footing. This scenario looks especially relevant when the Fed is not at all concerned about markets correcting, as it did at the beginning of the pandemic.
But it is too early for the bears to celebrate because they have yet to break the emerging rebound and push the S&P500 below 3500, significant psychological support, where the 200-week moving average and critical support/resistance levels of the second half of 2020 are located.
Our pessimistic scenario could be reversed if the S&P500 exceeds the 3900 mark during the emerging rebound. In that case, a reversal of the equity market to the upside would have to be considered.
British Pound Calm ahead of Inflation
The pound is having a quiet week, after some sharp swings last week. Monday was a holiday in the US, and it was a quiet session for the US dollar. The currency markets are calm today as well, with the exception of the sinking Japanese yen.
British pound eyes CPI
Last week was the turn of the central banks to perform on stage, with the Fed, BoE and SNB all raising rates. All three central banks are keeping a close eye on rising inflation and tightening policy in order to wrestle down inflation. The BoE has been accused of raising a white flag with regard to inflation, and last week’s tepid rate hike of 0.25% won’t silence the critics.
The UK releases the May inflation report on Wednesday, with headline CPI expected to nudge higher to 9.1%, up from 9.0% in April. The BoE estimates that inflation will peak above 11%, sometime later this year. With the BoE grimly predicting that inflation will hit double-digits, the cost of living crisis, which is already bad, is poised to get even worse. This has led to inflation expectations continuing to accelerate, and the UK rail strike, the biggest in 30 years, is a reflection of workers taking extreme action in the face of rising inflation. Consumer confidence is down, and a drop and consumer spending would be disastrous for an economy that may be headed for a recession.
In the US, Fed Chair Powell will testify on Capitol Hill on Wednesday and Thursday, and the ratings should be high, following the Fed’s largest rate hike since 1994. Fed members Barkin and Mester will speak later today, and the markets will be listening, looking for insights regarding upcoming rate hikes.
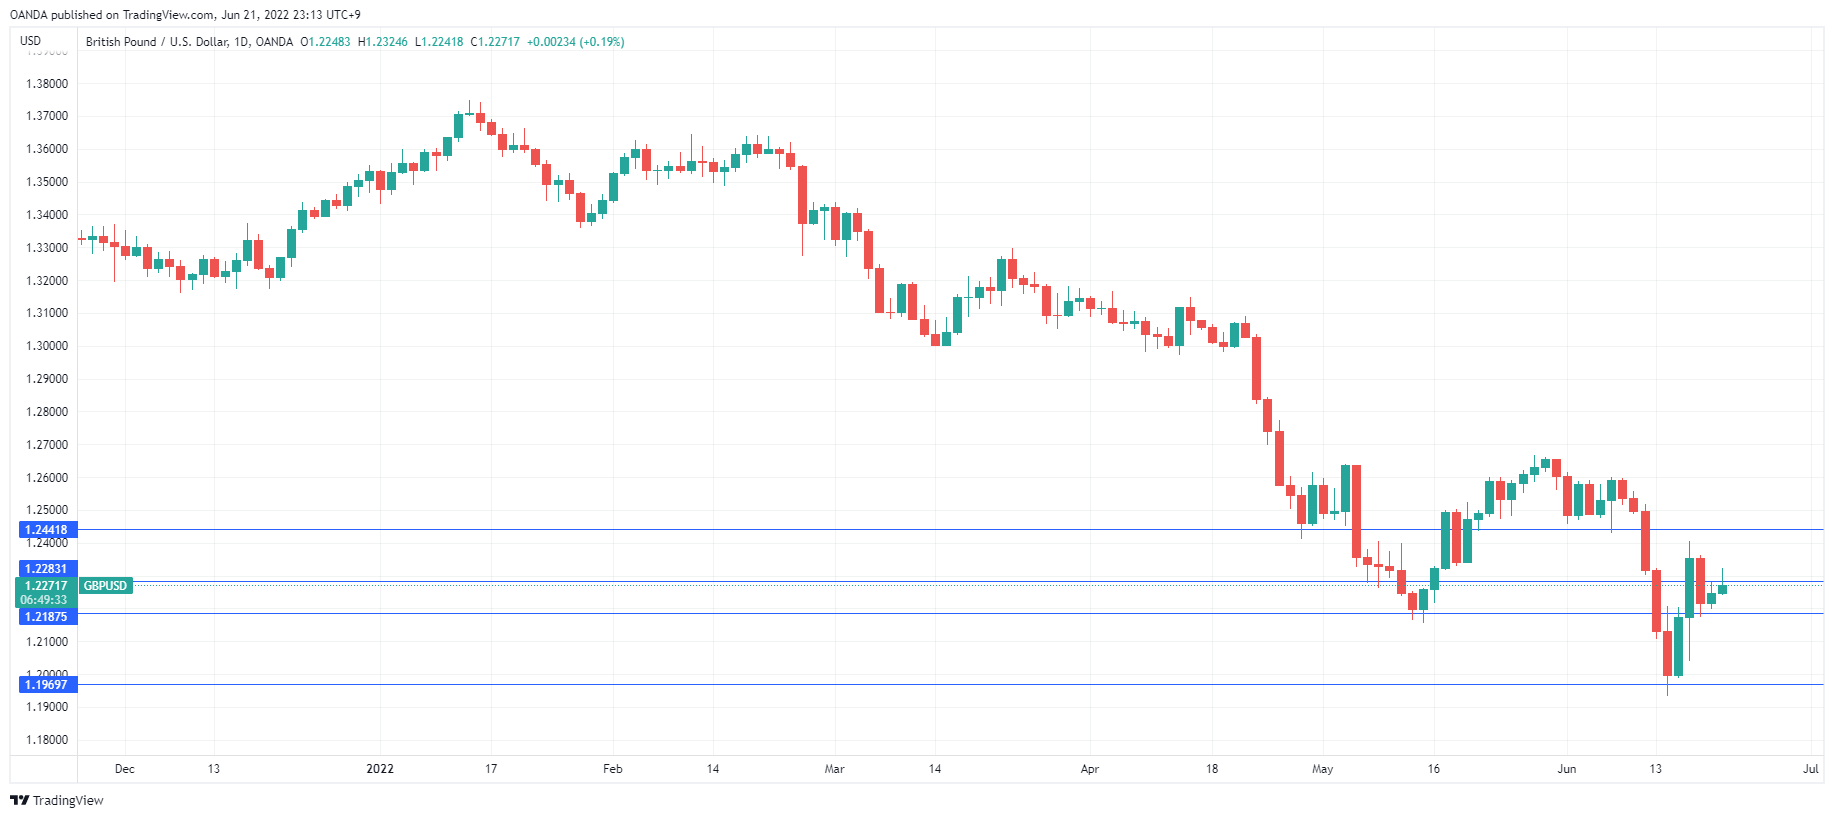
GBP/USD Technical
- GBP/USD is testing resistance at 1.2292. Above, we have resistance at 1.2441
- There is support at 1.2187 and 1.1969
Sunset Market Commentary
Markets
Europeanstock markets built on Asian risk momentum at the start of trading, but had some difficulties to really hold on to that vibe. As the US session gets going, they gain around 0.5% compared to +1.5% at their best levels around European noon. It’s another sign that the global setting of central bank policy normalization, high inflation, sluggish growth forecasts and still relatively high valuation isn’t really inviting for bulls to show their teeth. We remain in a sell-on-upticks environment with room for correction higher near term given the absence of inflation numbers and central bank meetings before the end of the month. Core bonds followed the intraday dynamic of stocks. They attempted to recover some lost ground in the early stage of European dealings, but the move lacked dash and was followed by return action lower. The German yield curve steepens at the time of writing with daily changes varying between -1.3 bps (2-yr) and +3 bps (30-yr). Peripheral yield spreads vs Germany narrow by up to 3 bps with Greece (-13 bps) and Italy (-7 bps) continuing their outperformance since last week’s extraordinary ECB meeting in which the central bank added strength to its commitment of not allowing for market fragmentation during the normalization cycle. Yield changes on the US yield curve are amplified by yesterday’s Juneteenth holiday. The US yield curve bear steepens with yields rising by 0.8 bps (2-yr) to 7.9 bps (30-yr). The euro gains some technically insignificant ground to trade at 1.0550 from an open at 1.0511. First intermediate resistance stands at 1.0627/42. EUR/GBP in the same vein rises to the 0.86 handle. Comments by BoE chief economist Pill are ignored. He added weight to last week’s policy meeting outcome (sharper tightening might be on the horizon) by saying that he would sacrifice some growth to cut inflation. Before last week’s meeting, the BoE sounded less firm in its inflation fighting commitment compared with other central banks. UK Gilts underperform today, rising by 4 bps (2-yr) to 7 bps (30-yr). Eco and event news was thin today, though we retain the ECB’s new measure of domestic inflation for the euro area that takes into account the import intensity of HICP items (“Low Import Intensity or LIMI-indicator). More specifically it looks at items like housing rentals, domestic services, maintenance and repairs en education. LIMI suggests that, although the sharp rise in headline inflation is mainly explained by imported inflation, domestic inflationary pressures have also increased over the past year. Tracking back, the LIMI-indicator started to point at increasing underlying inflationary pressures in the years immediately preceding the Covid-pandemic. It restarted its upward trend in mid-2021, passing 2% in the final quarter of last year to currently trade around 3.25% Y/Y.
News Headlines
The Russian ruble continues to appreciate and is now trading at a 7-year high vs the dollar (USD/RUB 54.7). The strong ruble was powered by surging prices for Russia’s commodity exports while imports collapsed and is increasingly posing a threat to exporters and public finances. Russian officials are scrambling for ways to keep the currency on a leash without abandoning the 4% inflation target. The most obvious one – direct FX interventions – is prevented by international sanctions. A suggestion that didn’t make the cut was a requirement for exporters to convert their earnings into yuan. Another abandoned idea was modeled after Iran’s approach to include two-tier exchange rates. One of the only options that remain open is to further loosen rules on currency operations for companies active abroad and more access to foreign exchange for households and business at home.
British manufacturing order books deteriorated in the three months to June, CBI data revealed. The diffusion index fell from 26% to 18% vs 21% expected. That is still high compared to history though, 0% in the series is considered a “normal level”. Slipping export orders (falling back from 19% to a 1%) were the main responsible. Looking ahead, the subseries gauging output volumes for the next three months eased slightly from 23% to 20%. Selling price expectations over that same period fell markedly, from 75% to 58%, a 9-month low. CBI notes that “we may be seeing the first signs that weaker activity is beginning to slow the pace of price increases in the sector.”
EUR/USD Mid-Day Outlook
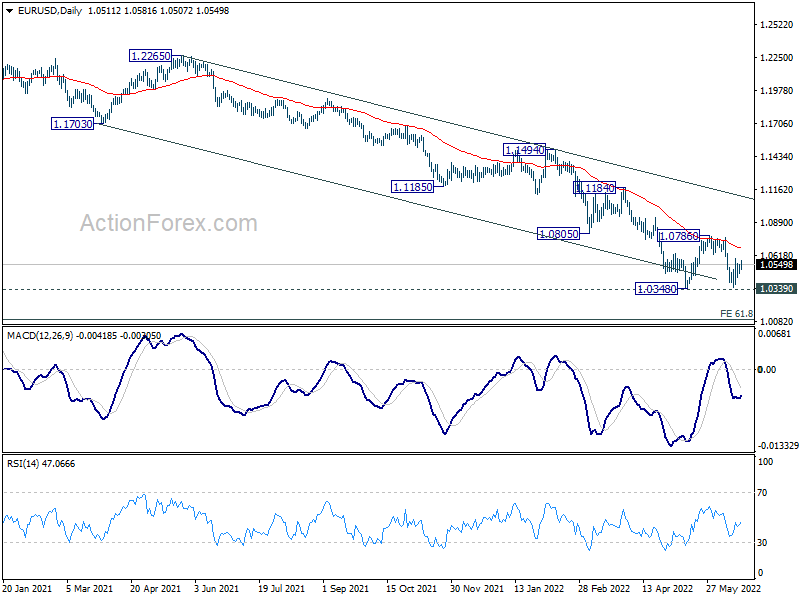
Daily Pivots: (S1) 1.0475; (P) 1.0511 (R1) 1.0546; More...
Intraday bias in EUR/USD remains neutral as sideway consolidations continues. Further fall is in favor with 1.0786 resistance intact. On the downside, sustained break of 1.0339/48 will resume larger down trend. Next target is long term projection level at 1.0090.
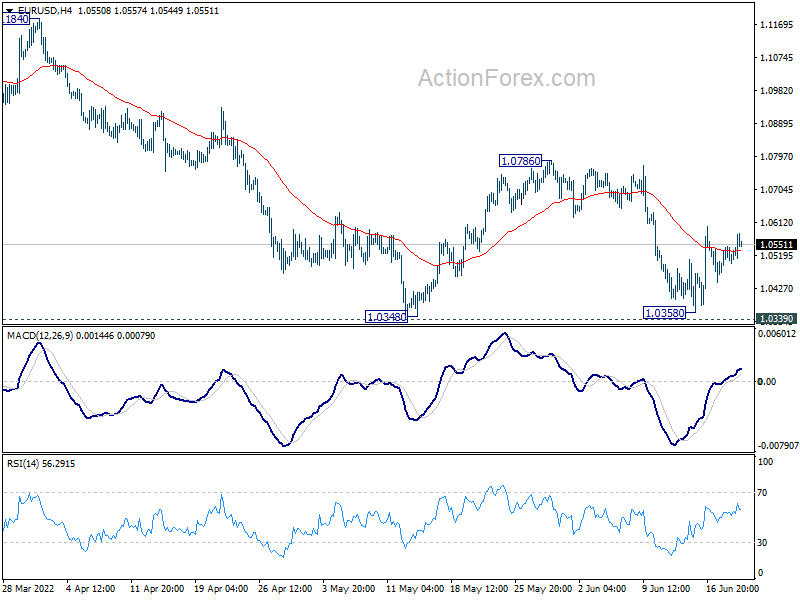
In the bigger picture, focus stays on 1.0339 long term support (2017 low). Decisive break there will resume whole down trend from 1.6039 (2008 high). Next target is 61.8% projection of 1.3993 to 1.0339 from 1.2348 at 1.0090. However, firm break of 1.0805 support turned resistance will delay this bearish case, and bring stronger rebound first.
GBP/USD Mid-Day Outlook
Daily Pivots: (S1) 1.2205; (P) 1.2242; (R1) 1.2286; More...
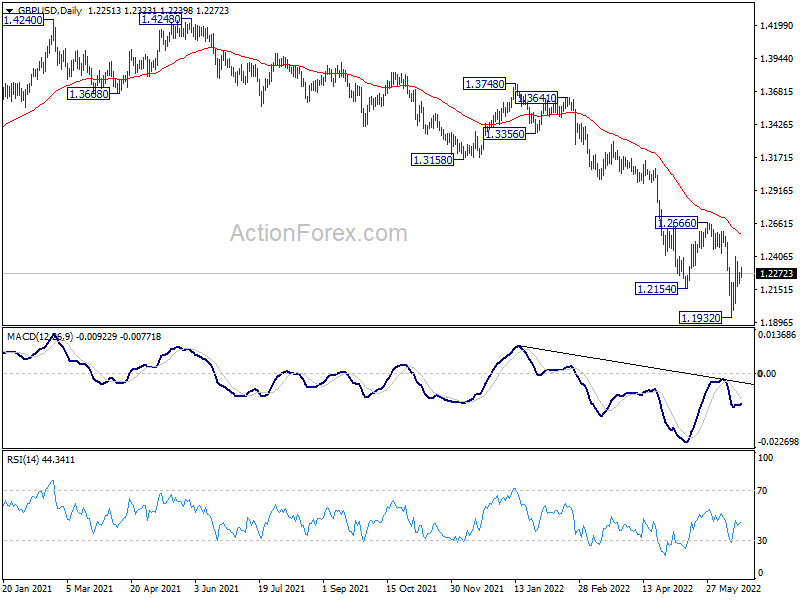
Intraday bias in GBP/USD remains neutral as range trading continues. Outlook stays bearish as long as 1.2666 resistance holds. On the downside, break of 1.1932 will resume larger down trend from 1.4248. However, firm break of 1.2666 will suggest medium term bottoming and bring stronger rebound back towards 1.3158 support turned resistance.
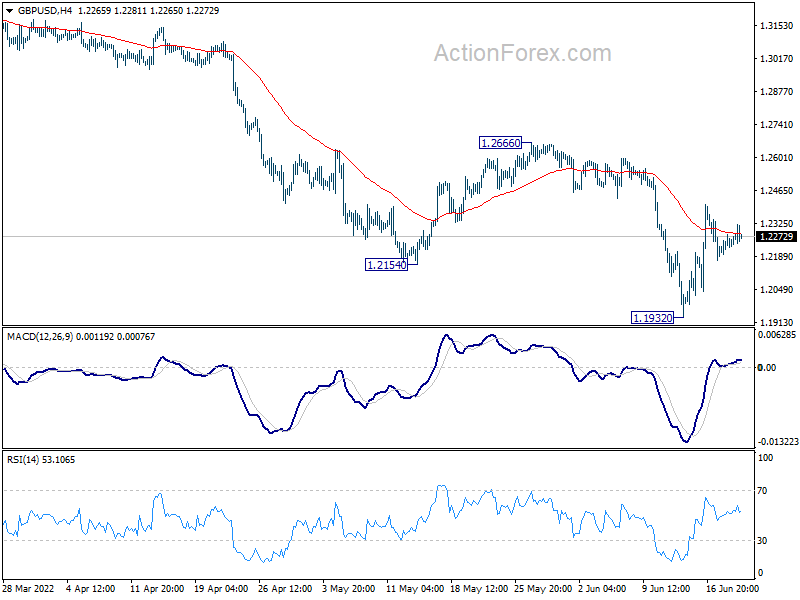
In the bigger picture, fall from 1.4248 (2018 high) could be a leg inside the pattern from 1.1409 (2020 low), or resuming the longer term down trend. Deeper decline is expected as long as 1.2666 resistance holds. Next target is 1.1409 low. However, firm break of 1.2666 will bring stronger rise back to 55 week EMA (now at 1.3175).