Sample Category Title
Bruised Pound Looks for Rebound ahead of Q1 GDP Data
A bleak economic forecast from the Bank of England exacerbated the sell-off in the bruised pound last week, making Thursday’s preliminary Q1 GDP growth figures important to watch at 07:00 GMT. Despite a quarterly slowdown, the UK economy is expected to have picked up steam at the start of the year, vindicating the BoE’s monetary tightening strategy, though the data may not be enough to push the bears entirely out of the way.
The Bank of England hiked its main interest rate for the third time consecutive time to 1.0% this month in efforts to contain the rapid rise in inflation but acknowledged the hardship that its policy will cause to households alongside higher energy prices. It expects a double-digit rate of inflation of 10.2% at the end of 2022, which wages will not be able to offset, and an economic contraction despite a falling unemployment rate. For the first quarter of the year, it projects a softer quarterly growth of 0.9%, which is in line with analysts’ current estimates, though on a yearly basis the UK economy has probably accelerated. Initial forecasts suggest a stronger annual growth of 9.0% from 6.6% registered at the end of 2021. That would be the highest since Q2 2021.
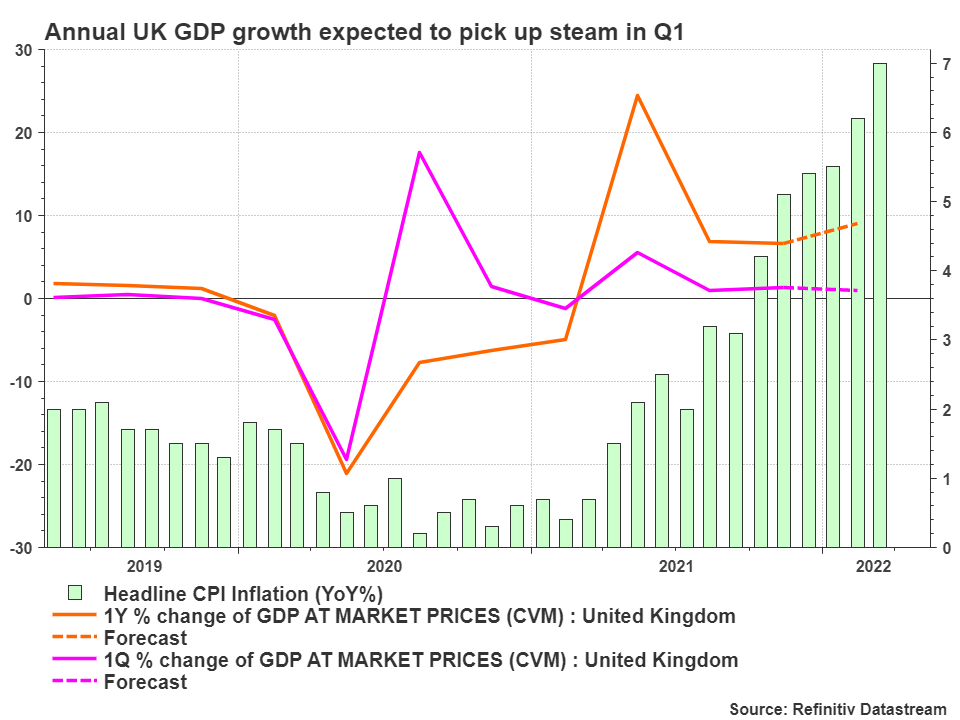
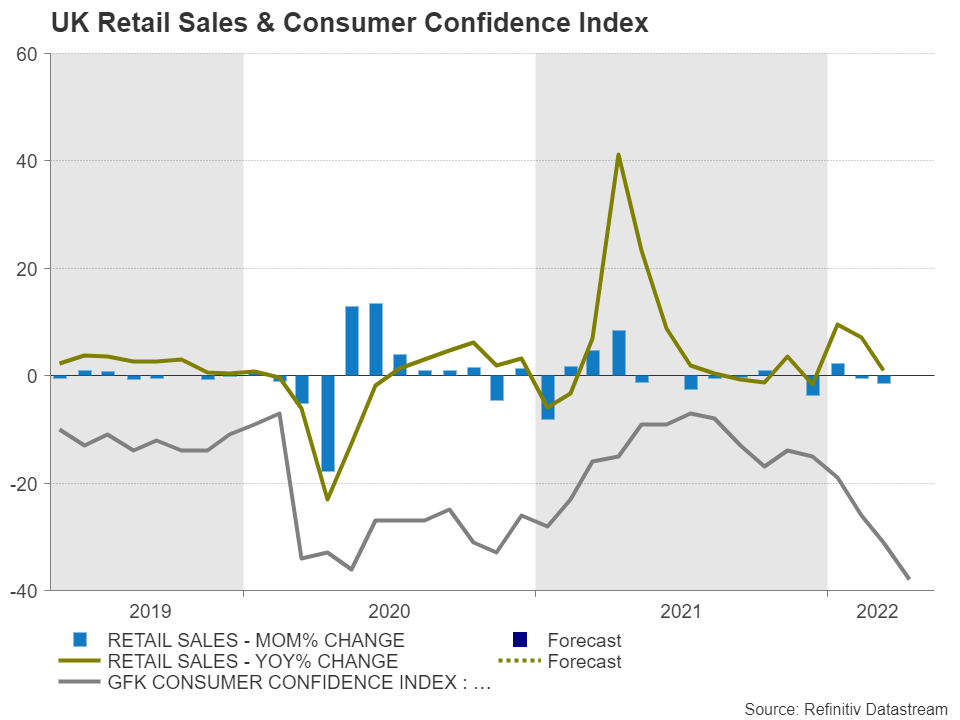
The Russian invasion in Ukraine has extended the pandemic-led supply disruptions, causing more inflation and therefore squeezing households’ pockets further, though the external shocks have probably been less obvious in the Q1 GDP data, allowing for some expansion. Nevertheless, investors may retain some discomfort even if the stats beat forecasts as the dominant service sector notably lost momentum at the start of the second quarter, while consumer confidence sank to the lowest since 2008, making a growth deceleration almost inevitable in the coming quarters. Retail sales were on the back foot for the second consecutive month, revealing diminishing economic activity as well.
Apparently, the central bank will follow its guidance and deliver a couple of moderate rate increases in the coming months (June and August) to avoid cliff-edge effects from inflation as promised, though that strategy risks having a cosmetic effect if the economy shrinks in Q2, hinting at a late response to price spikes. Therefore, investors could become more sensitive to Q2 GDP and inflation readings in fear that any persisting slowdown may force the committee to push the pause button earlier than expected.
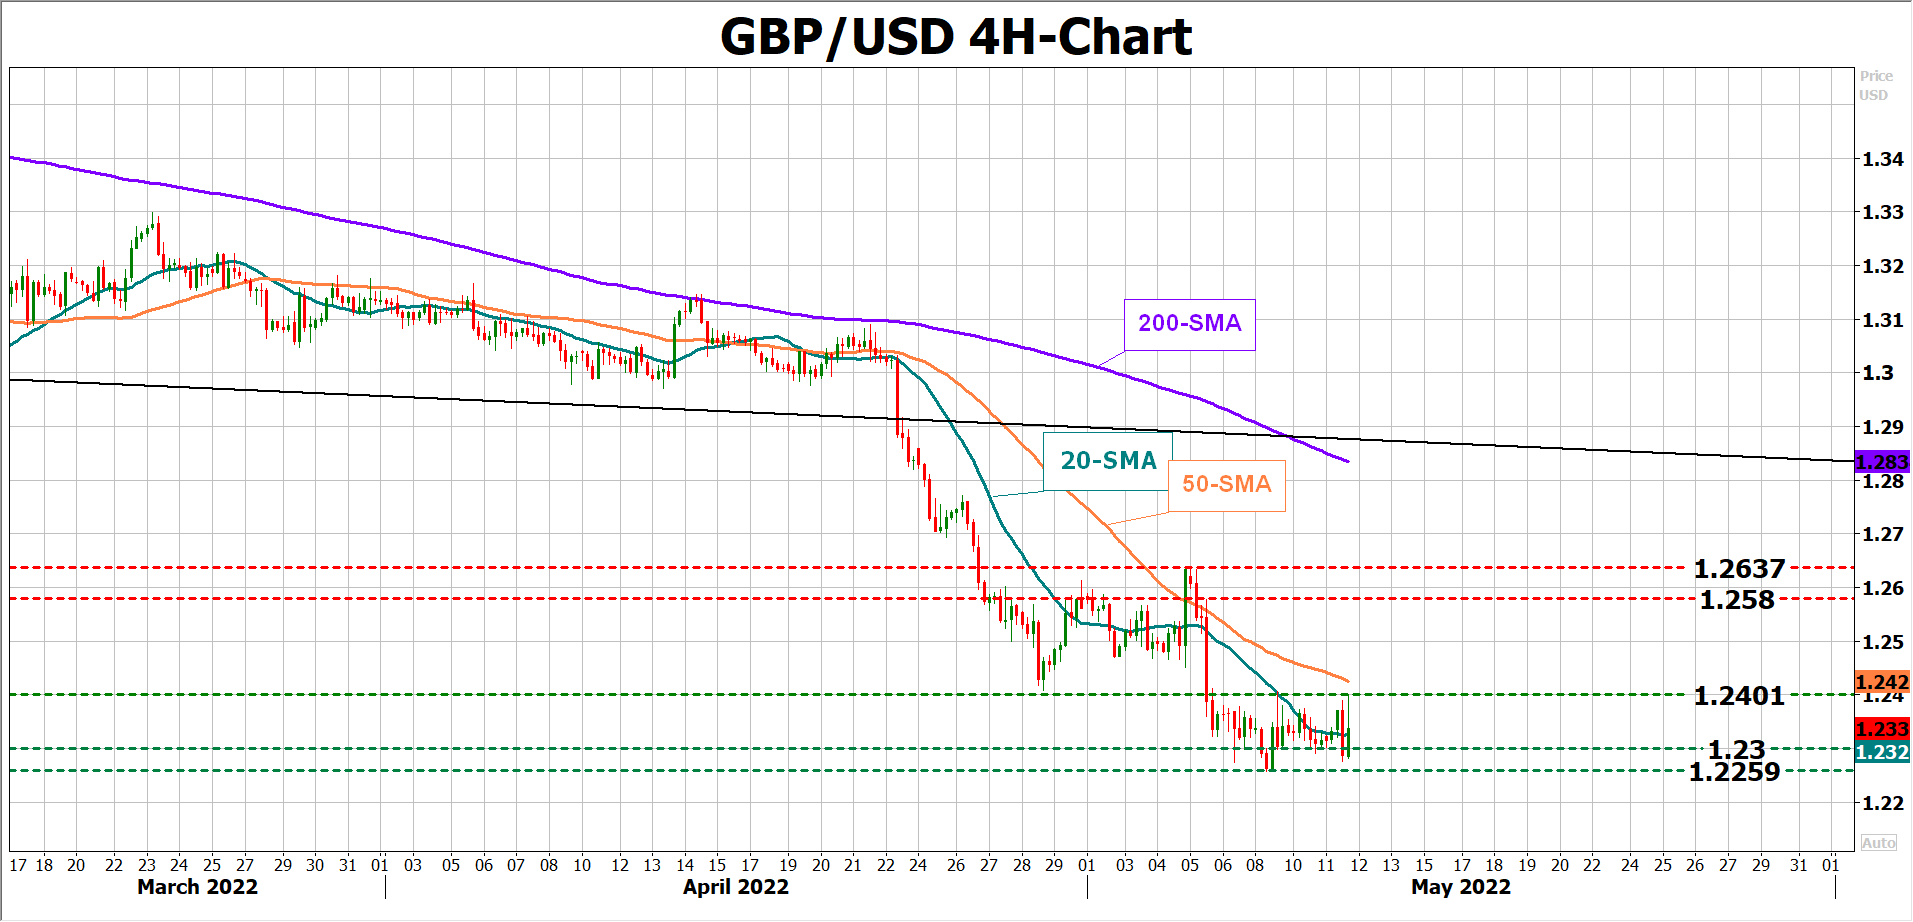
As regards the pound, the BoE’s careful policy approach and the dollar’s strength have been a toxic cocktail for the market, but the British currency managed to build a floor within the $1.2300 - $1.2259 zone. In the case of a positive surprise, pound/dollar may attempt to crawl above the $1.2400 resistance and the 50-period simple moving average (SMA) with scope to speed up to $1.2580, though given the cloudy outlook for the UK economy, any bullish corrections could be temporary.
Otherwise, a worse-than-expected GDP report could deliver the next punch to cable, likely motivating an aggressive decline towards May's 2020 low of 1.2074.
Elliott Wave View: AUDJPY Rally Should Fail for More Downside
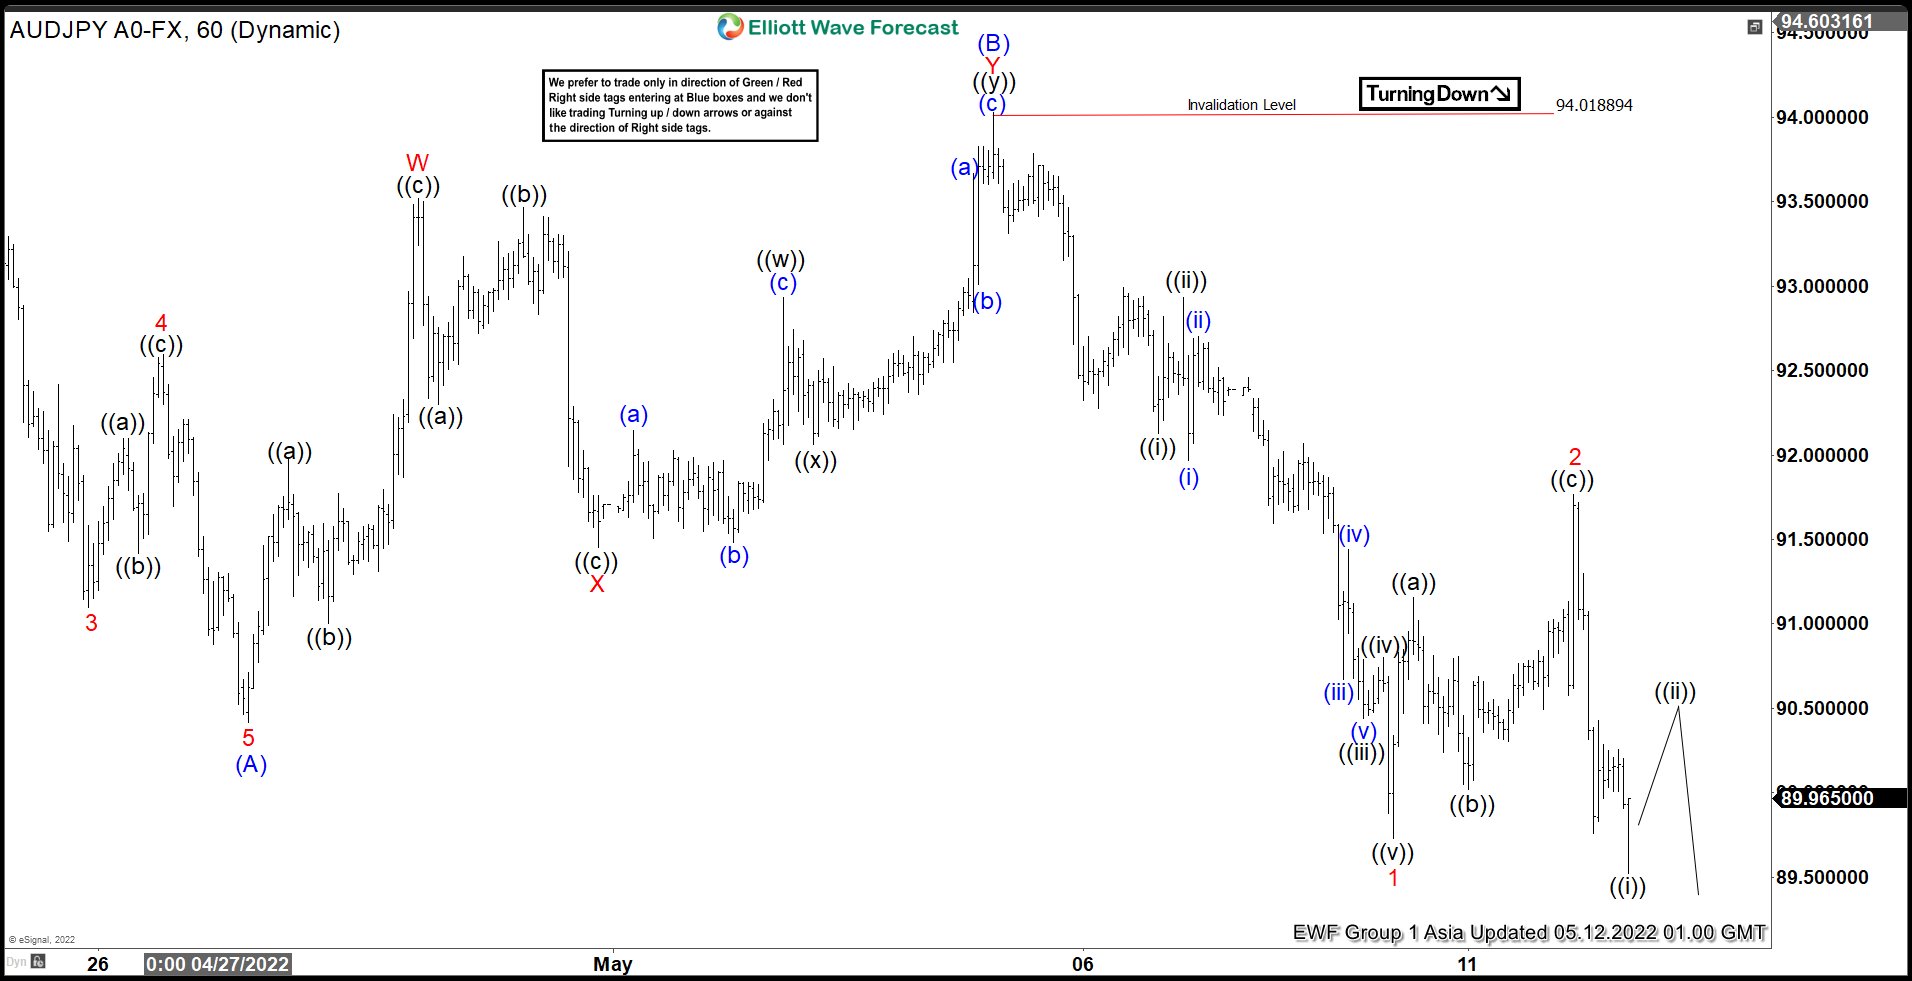
Short Term View in AUDJPY shows a bearish sequence from April 20, 2022 high favoring further downside. The decline from April 20 is unfolding as a zigzag Elliott Wave structure. Down from April 20, wave (A) ended at 90.41 and rally in wave (B) ended at 94.02. Internal of wave (B) unfolded as a double three Elliott Wave structure. Up from wave (A), wave W ended at 93.52 and pullback in wave X ended at 91.45. Pair then extended higher in wave Y towards 94.01 which completed wave (B).
Pair has resumed lower in wave (C). Internal of wave (C) is unfolding as a 5 waves impulse Elliott Wave structure. Down from wave (B), wave 1 ended at 89.72 and rally in wave 2 ended at 91.76. Near term, as far as rally fails below 91.76, and more importantly below 94.01, expect pair to extend lower. Potential target lower is 100% – 123.6% fibonacci extension from April 20 high at
Down from wave X, wave (i) ended at 106.45 and rally in wave (ii) ended at 111.18. Oil then extends lower in wave (iii) towards 100.44, and rally in wave (iv) ended at 104.16. Expect wave (v) of ((a)) to end soon, then Oil should rally in wave ((b)) to correct the decline from May 5, 2022 high before it resumes lower. Potential target lower is 100% – 161.8% Fibonacci extension from March 24, 2022 peak at 85.45 – 88.7 area.
AUDJPY 60 Minutes Elliott Wave Chart
China Shatters World Economy
A four-day lockdown turned out to be two months of complete isolation. Factories are frozen, supply chains are under heavy pressure, and the future is gloomy. Find out how to trade in times of crisis in this article!
Covid is the reason
China has chosen a zero-covid policy. This is a set of measures to eradicate the virus in China. To do so, the Chinese government restricted Beijing's citizens from exiting their homes. First, the restrictions were supposed to last four days. But growing infections caused stricter rules. Long story short, 25 million people in Beijing and Shanghai are now in their homes, without a single possibility to go out.
Although covid cases have started to ease from their April peak, authorities once again tightened lockdown measures today (May 11). Now some of Shanghai's districts aren't able to receive non-essential deliveries. Moreover, the lockdown became even stricter, and now about 373 million people are far away from grocery stores and pharmacies.
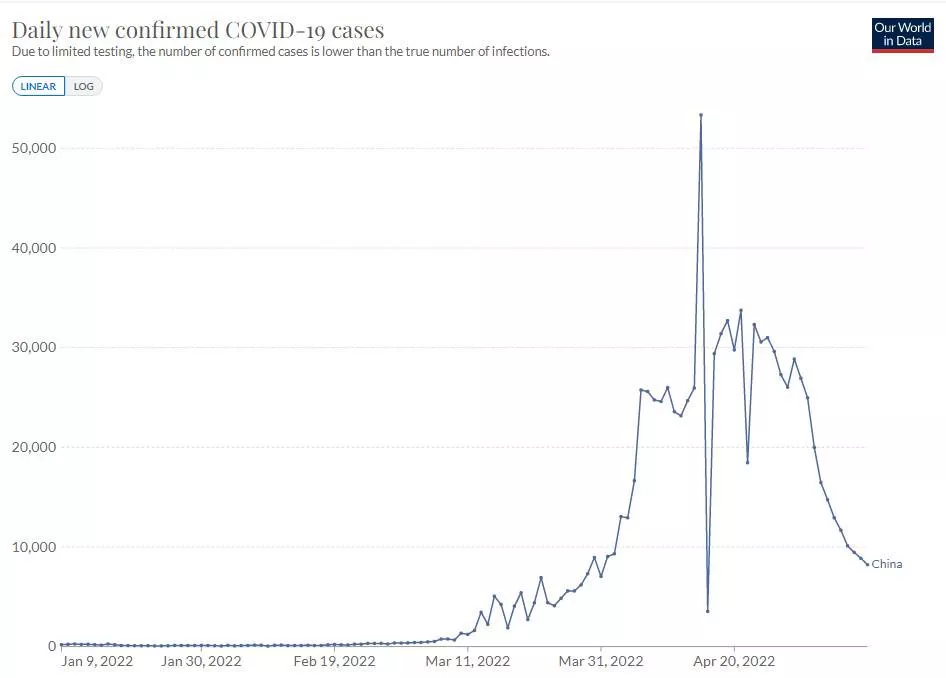
Now, China has around 8000 Covid-19 cases per day, which is much better than the peak of 50 000 daily cases in mid-April 2022. However, the lockdown may last for another month or even more, rising uncertainty for the economy.
Why is it important?
These restrictive measures have created widespread economic disruptions within China. But it's not rocket science that China is one of the world's biggest producers of almost everything. Food, drugs, clothes, cars, technologies – trillions of dollars worth of goods are produced here every year.
Placing hundreds of millions of workers under lockdown has hammered China's factories. Tesla factory stopped working, and the company will lose 60 000 cars due to the restrictions. The International Monetary Fund has cut its forecast for Chinese economic growth in 2022 from 4.8% to 4.4% because of the lockdowns—well below the government target of 5.5% and down nearly half from last year's 8.1%. Some (pessimistic) analysts suppose that China's lockdowns could push the country into a recession this year.
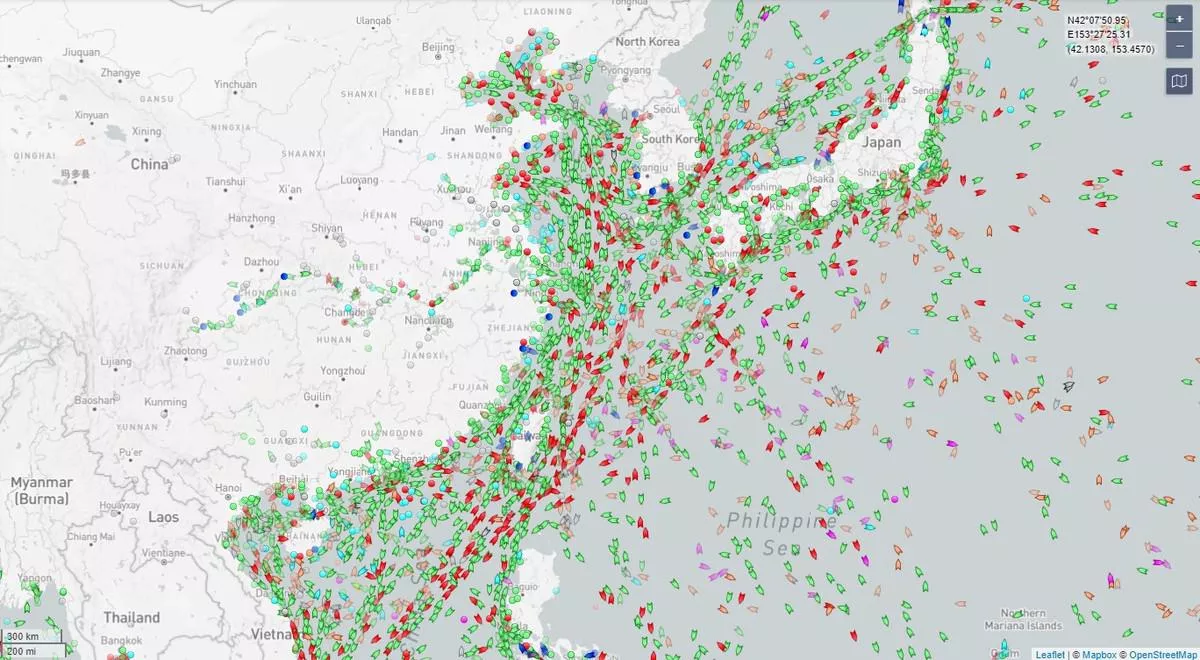
There are thousands of cargo vessels near China waiting for ports to open. How long will they have to wait? Estimations are unclear, but we can assume that the lockdown may last until daily cases reach near-zero levels. It can be a long way since the omicron strain (so far the latest Covid strain) is highly contagious.
Is it a "Sell" for HK50 and Chinese Yuan?
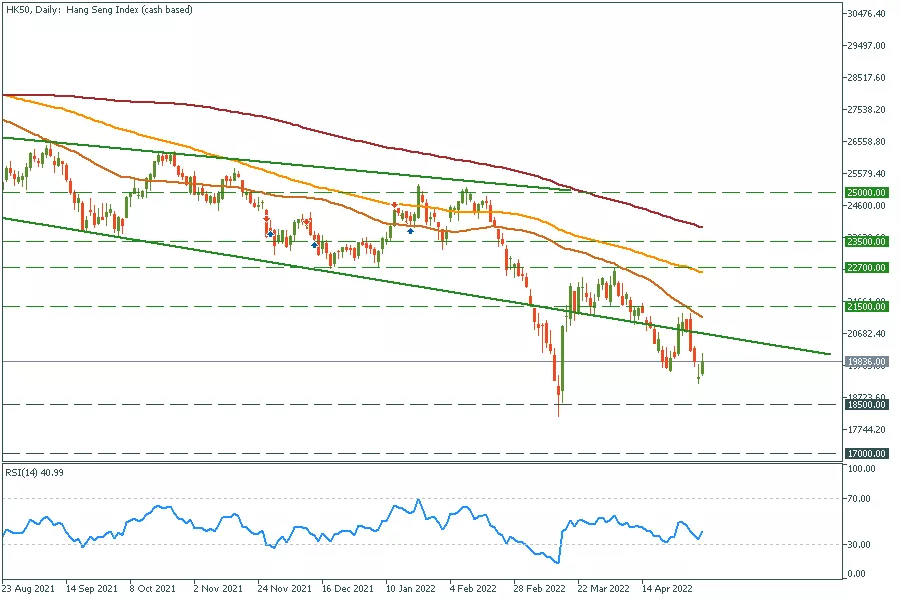
You already know the answer, and the chart also hints to you. The Chinese stock market has been moving lower for a year now, and the bearish waves will continue. As HK50 (China's stock index) is below the vital resistance of 21 000 – 21 500, we suggest looking for short trades with several targets. The first is a retest of the historic low at 18 000. Then, in case of a breakout, 17 000 is a decent target for your trades.
HK50 daily chart
- Resistance: 21.5K, 22.7K, 23.5K, 25.0K
- Support: 18.5K, 17.0K
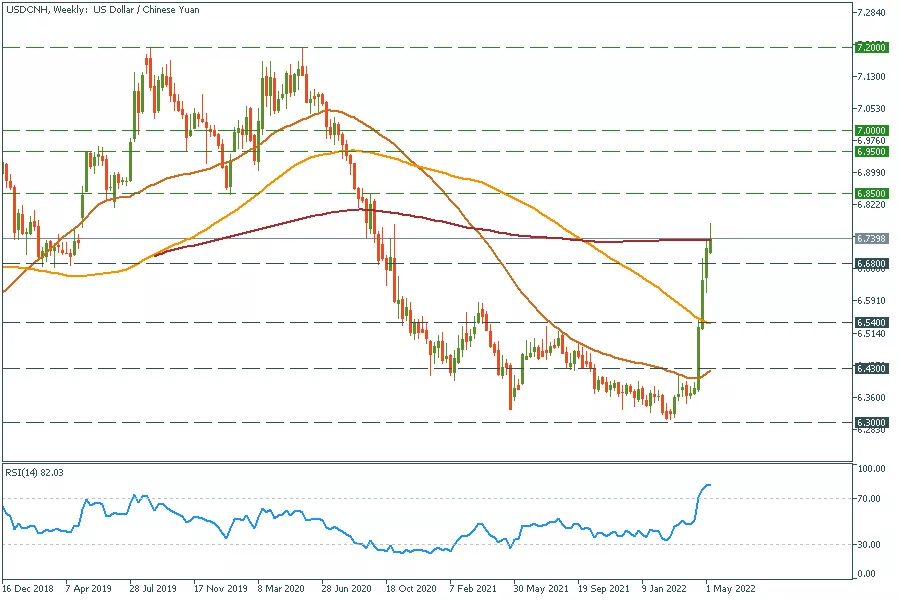
As for the USDCHN chart, Yuan has lost an impressive 4000 points over the last month, so we expect a pullback from 200-weekly MA to 6.680. The USD is about to lose its power, so a further plunge of the pair to the 6.540 support level is possible. In case of a 200-weekly MA breakout and a consolidation above the moving average, technical patterns will signal the extreme weakness of the Chinese Yuan. Thus, the USDCHN pair may reach a robust resistance area of 6.950-7.000.
USDCHN weekly chart
- Resistance: 6.850, 6.950-7.000, 7.200
- Support: 6.680, 6.540, 6.430, 6.300
DXY: US April CPI Keeps Inflation Fears Aalive
Those who awaited US April CPI data hoping for a summary execution of the inflation narrative walked away from Wednesday’s release disappointed. But the reality is that inflation, although falling, is not doing so quite at the rate most were expecting. For the time being, traders will need to balance both of those factors as they trade the US dollar.
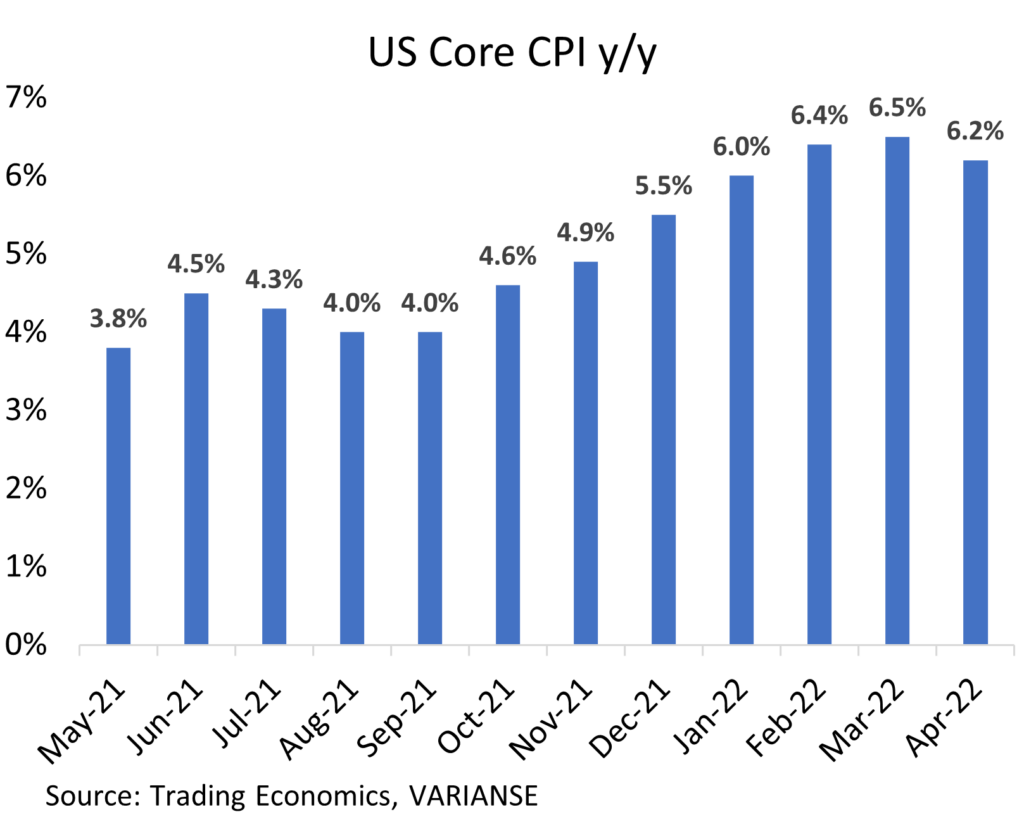
What Wednesday’s CPI data did show is that inflation can at least fall on an annualised and monthly basis in one form or another. Headline CPI in April dropped to 8.3% from 8.5% even though it was above the 8.1% economists were predicting. Likewise, the core inflation rate, which excludes food and energy prices, fell to 6.2% from 6.5% prior, missing expectations of a 6.0 %drop.
That, alongside expectations of further disinflationary pressures, still point to a further drop in CPI as the year progresses. The unexpected degree of acceleration in both m/m figures, however, undermines those expectations. Headline CPI accelerated by 0.6% m/m versus an expected 0.4% (prev. 1.2%), while the core figure rose by 0.6% m/m versus 0.4% (prev 0.3%).
Analysts, moreover, have been quick to point out that several components of CPI still point to underlying inflation worries. For one, services ex-energy component, rather than fall, rose by 0.7% m/m. In addition, rents rose by 0.5% as did owner’s equivalent rents. In fact, rents were one key reason why April’s core CPI rose by more than many were expecting.
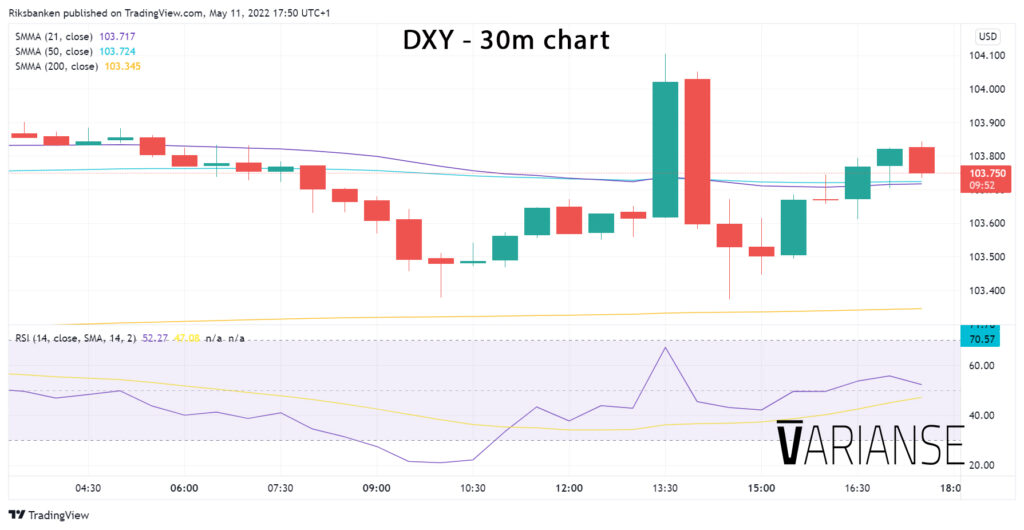
Still, high inflation has been the market narrative for some time. The initial move higher in the DXY to today’s inflation data were quick to respond to an above consensus print. Meanwhile, the subsequent retracement in gains means there is some capitulation to the idea that inflation is falling, and Fed rate hiking expectations may be close to their peak. The market is just waiting for the proof in the pudding.
EURCAD Wave Analysis
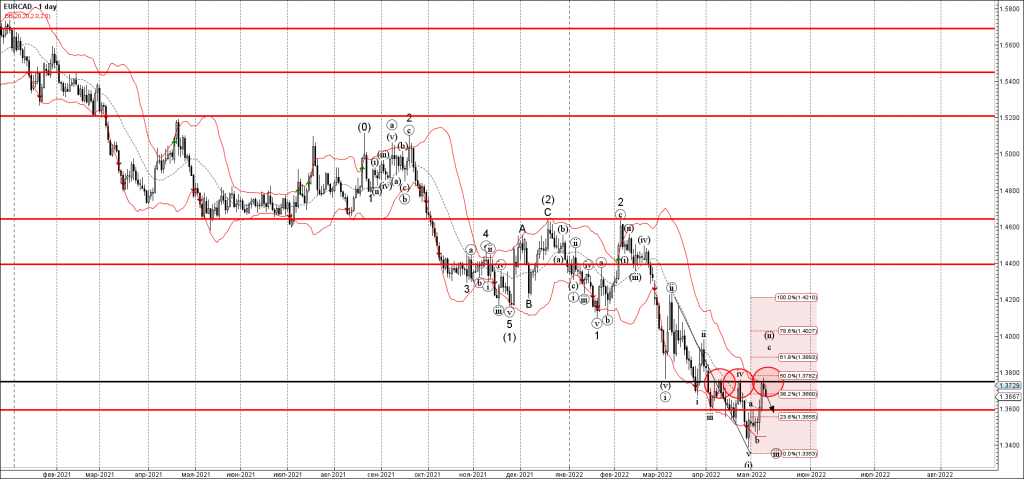
- EURCAD reversed from resistance area
- Likely to fall to support level 1.3600
EURCAD recently reversed down from the resistance area located between the key resistance level 1.3750 (which has been reversing the pair from March) and the upper daily Bollinger Band.
This resistance area was further strengthened by the 50% Fibonacci correction of the previous downward impulse from March.
EURCAD can be expected to fall further toward the next support level 1.3600 (earlier top of wave a).
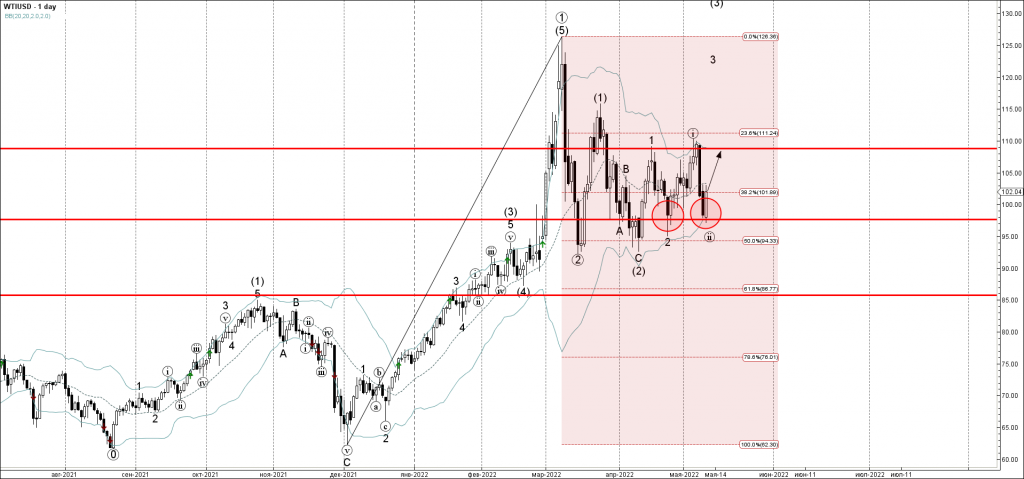
WTI Wave Analysis
- WTI reversed from support area
- Likely to rise to resistance level 108.80
WTI crude oil recently reversed up from the support area located between the key support level 97.60 (which has been reversing the pair from April) and the lower daily Bollinger Band.
The price is currently forming the daily Bullish Engulfing – which should stop the earlier downward correction (ii).
Given the clear uptrend – WTI crude oil can be expected to rise further toward the next resistance level 108.80 (which has been reversing the earlier waves 1 and (i)).
Pound Rises on US Inflation, GDP Looms
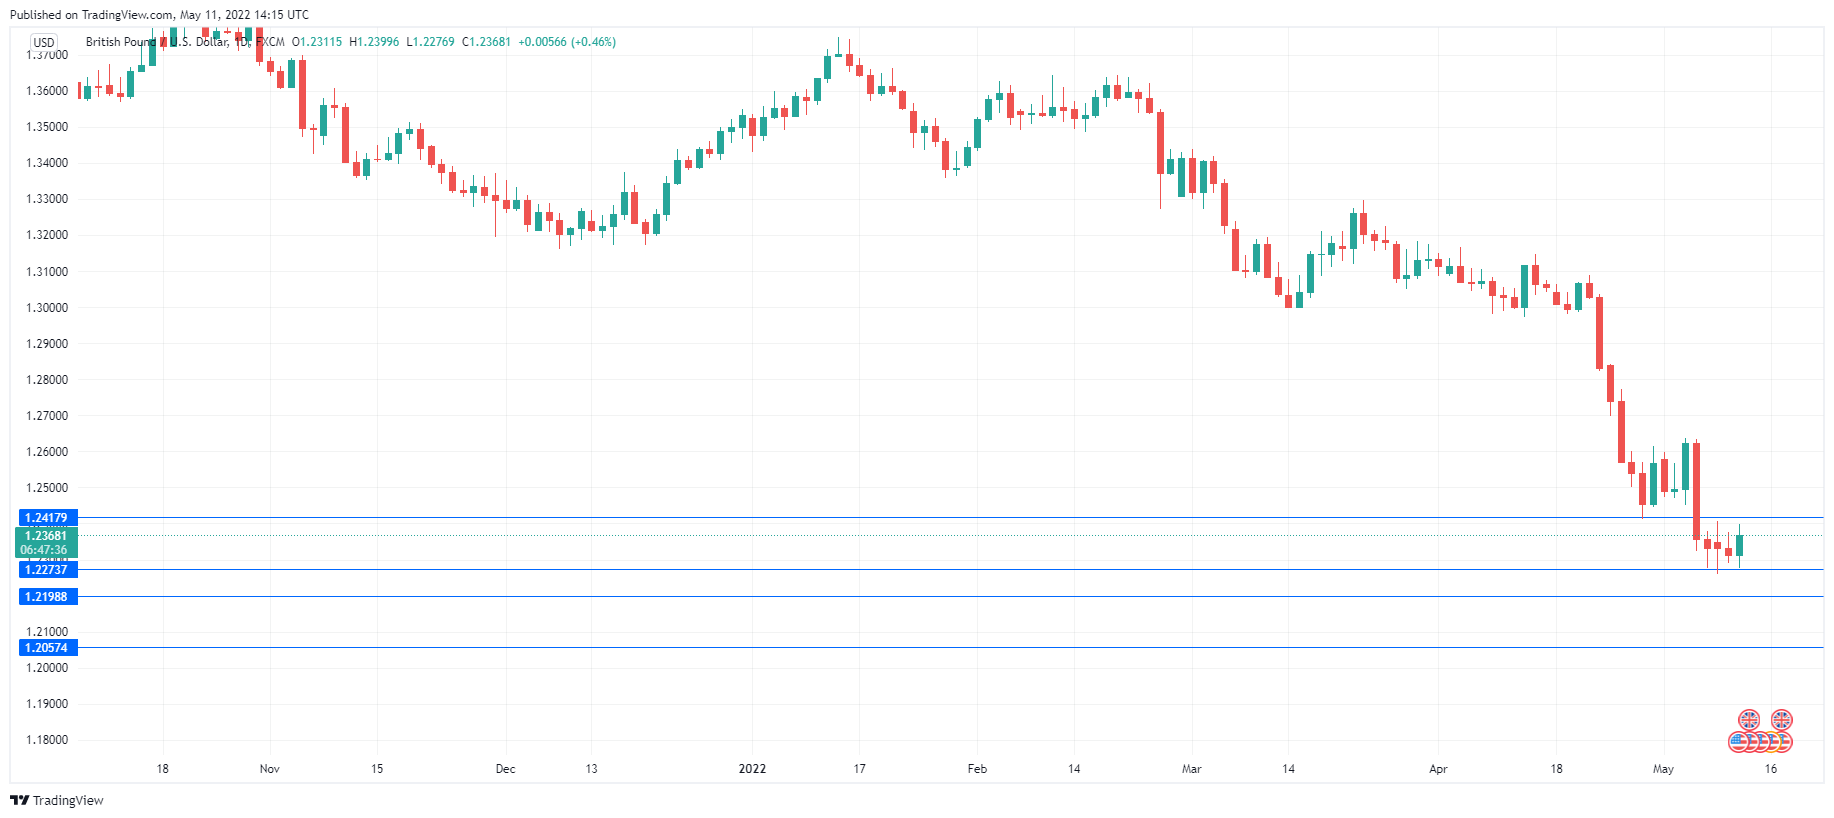
The British pound is in positive territory, as the currency tries to break a four-day losing streak. In the European session, GBP/USD is trading at 1.2355, up 0.36% on the day.
US inflation slows, but is higher than expected
US inflation dipped in April, but still came in above the forecast. Headline CPI dropped from 8.5% to 8.3%, above the estimate of 8.1%. Core CPI came in at 6.2%, down from 6.5% but above the estimate of 6.0%. The US dollar is broadly lower as a result, although the decline would have been sharper had the estimates been right on.
Today’s inflation data will no doubt result in some headlines proclaiming an “inflation peak”, but I would caution that it seems premature to declare that inflation is on its way down after just one release. Higher interest rates will do the job and curtail inflation, but it will take time. In the meantime, today’s inflation report will not change the Fed’s stance, and the CME’s FedWatch has pegged the likelihood of a 50-bps rate hike in June at 89%.
Looking forward, inflation gazing has become even trickier in the current environment. There are huge unknowns around price pressures due to the Ukraine war, as well as the extent of China’s slowdown and the impact on supply chains due to China’s uncompromising zero-Covid policy. With energy prices at very high levels, it will be difficult for headline CPI to come down.
Over in the UK, we’ll get a load of data on Thursday. The key release, Preliminary GDP for Q1, is expected to slow to 1.0%, down from 1.3% in the fourth quarter. The UK economy is showing an unhealthy mix of slower growth together with soaring inflation, which has raised concerns about stagflation. The BoE has been raising rates to curb inflation, but investors have not been impressed, as the pound has hit hard times and hit a 23-month low earlier this week.
GBP/USD Technical
- There is support at 1.2199 and 1.2056
- GBP/USD faces resistance at 1.2272 and 1.2418
Sunset Market Commentary
Markets
Another series of ECB speeches made it all but certain now: a July rate hike is coming. This was not only confirmed by usual suspects including German ECB governor Nagel. The middle/neutral camp in the ECB is also favouring the idea. Executive board member Elderson said they can “start weighing policy rate normalization in July” while French governor Villeroy expects to raise rates gradually from the summer on. Even president Lagarde caved, saying a rate hike may follow “weeks” after the end of bond buying. The July 21 meeting thus ticks all the boxes. The comments had little impact though. Markets were extremely focused on the US CPI release, and rightly so. Both headline and core inflation eased in April from their historic highs to 8.3% and 6.2% respectively. However, more easing was expected (8.1% and 6% respectively). Month-on-month, headline inflation slowed significantly to 0.3% from a commodity-driven 1.2% in March. But the core measure doubled in speed, from 0.3% to 0.6% m/m whereas only 0.4% was expected. Shelter (0.5% m/m) continues to be a major source of price pressures, along with new vehicles (1.1% m/m) and food (0.9% m/m). (General) services inflation printed at a hot 0.8%. The steep drop in inflation expectations over the past few days suggested markets were perhaps getting a bit too comfortable with the idea of prices pressures easing soon and quickly. Today’s outcome was a reminder to both US and European investors: it won’t. US bond yields immediately shot up, erasing intraday losses. Stakes for, and pressure on the Fed remain very high, resulting in a textbook bear flattener. Changes went as high to 10 bps before trimming gains as the CPI dust settled. Yields currently add 1.3 bps (30y) to 6 bps (2y). German yields rise in lockstep, adding up to 4 bps (30y). EUR/USD dipped in a kneejerk reaction to an intraday low of 1.05. But in a sign of building fatigue, the dollar rally didn’t last. The currency pair is currently back at or even higher than levels from before the release at 1.056. The trade-weighted DXY is circling around recent cycle highs at 103.68. The British pound holds steady against the euro (EUR/GBP 0.854) and the USD (GBP/USD 1.235) even with Brexit tensions resurfacing. A rebound in prices of the likes of oil (Brent +3.6%) boosts commodity currencies (AUD, NZD, NOK) today. In Central-Europe, the Czech koruna underperforms peers during CNB’s Michl’s first speech after being appointed as new head of the central bank (see below).
News Headlines
Czech president Milos Zeman officially appointed Ales Michl as the next governor to the lead the Czech National Bank. He’ll succeed Jiri Rusnok in July. Michl was already known as an ultra-dove as he opposed the aggressive rate hike cycle that brought the policy rate to 5.75% currently. Michl wants to bring inflation back to 2.0% from an expected peak of 15% in summer. He expects this process can take two years. However, as he sees current inflation as mainly due to external factors/energy prices he doesn’t consider higher rates as a solution. He will propose interest rate stability at the first meeting he will lead in summer (August 4). However, the CNB still has one meeting left at June 22 where it will decide on further rate hikes in its current composition. Zeman also still has to decide on the reappointment of two other board members who voted in favour rate hikes (Benda, Nidetzky). The Czech two year swap yield declined more than 20 bps today to 6.12%. The koruna resumed the downmove that started after first rumours on Michl’s appointment were aired last week. EUR/CZK jumps from the 25 area to 25.3.
The pace of monthly prices rises in Brazil eased in April from 1.62% M/M to 1.06.% M/M. However, this still resulted in headline inflation printing at 12.13%Y/Y, the fastest pace since 1996! Eight out of nine components rose on a monthly basis with food and beverages, transportation and health and personal care showing the biggest gains. Only housing related prices eased. The Central Bank of Brazil last week raised the policy rate further by 1.0% to 12.75%. In the minutes of the meeting the CB indicated that it already did quite some work to stem inflation (cycle started at 2.0%). However, a further rate hike of a lower magnitude probably is still needed at the June meeting. The Brazilian real, which had a good run earlier this year, today slightly eased further trading at USD/BRL 5.1475.
GBP/USD Outlook: Cable Bounces after US CPI Data as Markets Digest Results
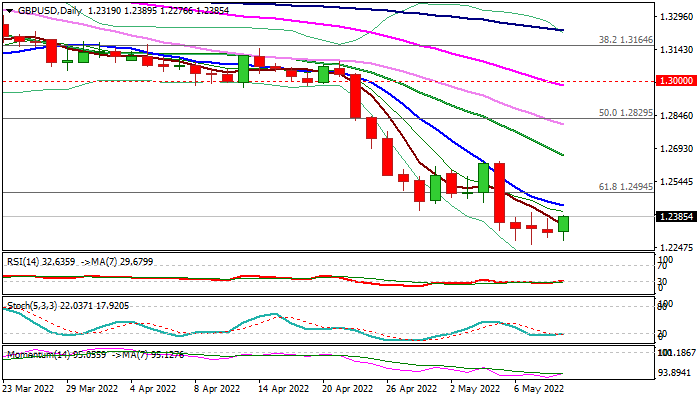
Cable fell below 1.23 handle after US CPI data came above expectations in April, but dip stayed above new 2022 low (1.2260) posted on Monday and subsequent bounce pushed the price to the mid-point of the near-term range which extends into fourth straight day.
Persisting high US inflation adds to expectations that the Fed would step up with policy tightening, bringing the possibility of 0.75% rate hike back on the table that would offer fresh support to the US currency and maintain pressure on sterling.
However, markets need to digest the data to give clearer near-term direction picture, as triple Doji on daily chart and indicators emerging from oversold territory signal that bears may take a breather for correction, attempt to counter strong bearish signal from rise in closely watched core CPI (Apr m/m 0.6% vs 0.4% f/c and Mar 0.3%) that works in favor of Fed’s more aggressive approach.
Break above near-term range top (1.2405) and daily Tenkan-sen (1.2450) would ease bearish pressure, but further rise above minimum 1.25 handle would boost initial positive signal. Failure to clear daily Tenkan-sen would keep near-term bias with bears and signal extended consolidation before bears resume.
Res: 1.2411; 1.2449; 1.2469; 1.2548.
Sup: 1.2328; 1.2300; 1.2260; 1.2200.