Sample Category Title
Inflation on the Mind of NZ Dollar
The New Zealand dollar has posted strong gains on Wednesday. In the European session, NZD/USD is trading at 0.6339, up 0.76% on the day.
NZD/USD has been on a nasty slide, with only one winning session since April 20th. The US dollar has flexed its muscles lately, particularly against risk currencies like the New Zealand dollar. This is a result of rising risk aversion as well as the Fed tightening its monetary policy.
Investors have plenty to worry about on the global scene, with a slowdown in China and the ongoing Ukraine war among the most pressing problems. China has stubbornly stuck to its zero-Covid policy and put massive numbers of residents under lockdown. This has caused a downturn in the Chinese economy and has also spilt over and is causing significant disruptions to global supply chains. China is New Zealand’s largest export market by far, and the deterioration in China’s growth is taking a toll on New Zealand’s economy.
New Zealand, US inflation data next
Inflation has been spiralling in New Zealand. CPI hit 6.9% in Q1, the highest level since 1990. The RBNZ has responded with a series of rate hikes, and the central bank is clearly concerned about inflation expectations becoming embedded. Inflation Expectations have accelerated over seven straight quarters and hit 3.27% in Q1, up from 2.96% in the Q4 of 2020. We’ll get a look at the Q2 data on Thursday – if the upward trend continues, there will be additional pressure on the RBNZ to aggressively raise interest rates.
The US releases April inflation numbers later today. Headline CPI is expected to drop from 8.50% to 8.1%, and Core CPI is forecast to fall from 6.50% to 6.0%. If the estimates prove accurate, I expect to see headlines proclaiming that inflation has peaked. This would seem to be a premature conclusion based on just one reading, but it would increase risk appetite and the US dollar would likely weaken as a result. On the other hand, stronger than expected numbers will likely boost the greenback, on concerns that the Fed could respond with faster tightening.
NZD/USD Technical
- 0.6391 is under strong pressure in support, as NZD/USD is sharply lower. Below, there is support at 0.6325
- There is resistance at 0.6519 and 0.6648
Euro Edges Up, Eyes US Inflation
Lagarde signals a rate hike
ECB President Christine Lagarde spoke today at an event sponsored by the Slovenia Central Bank, but what was of most interest were her remarks on future rate hikes. The ECB remains in dovish mode, but with inflation hitting 7.5% in the eurozone, the ECB will be tightening the monetary screws. More ECB members are publicly urging the central bank to raise rates and in her speech, Lagarde appeared to heed these calls, in her clearest signal yet that a rate hike is coming later in the year.
Lagarde stated that the ECB will end asset purchases under its QE programme, likely in Q3. This will be followed by a rate hike “some time” later. She acknowledged that “some time” was imprecise but added that it could be as little as several weeks. Lagarde added that the normalisation process would be “gradual”, which means investors shouldn’t expect an aggressive rate-hike cycle such as we’re seeing with the Fed and the BoE.
US inflation next
All eyes are on the US inflation report for April. Headline CPI is expected to drop from 8.50% to 8.1%, and Core CPI is forecast to fall from 6.50% to 6.0%. The inflation report is likely to produce a binary outcome. If inflation does drop significantly, as expected, we will see headlines trumpeting that inflation has peaked, and the US dollar will likely lose ground. Conversely, higher numbers than expected will lead to expectations of faster Fed tightening and should give the dollar a boost.
EUR/USD Technical
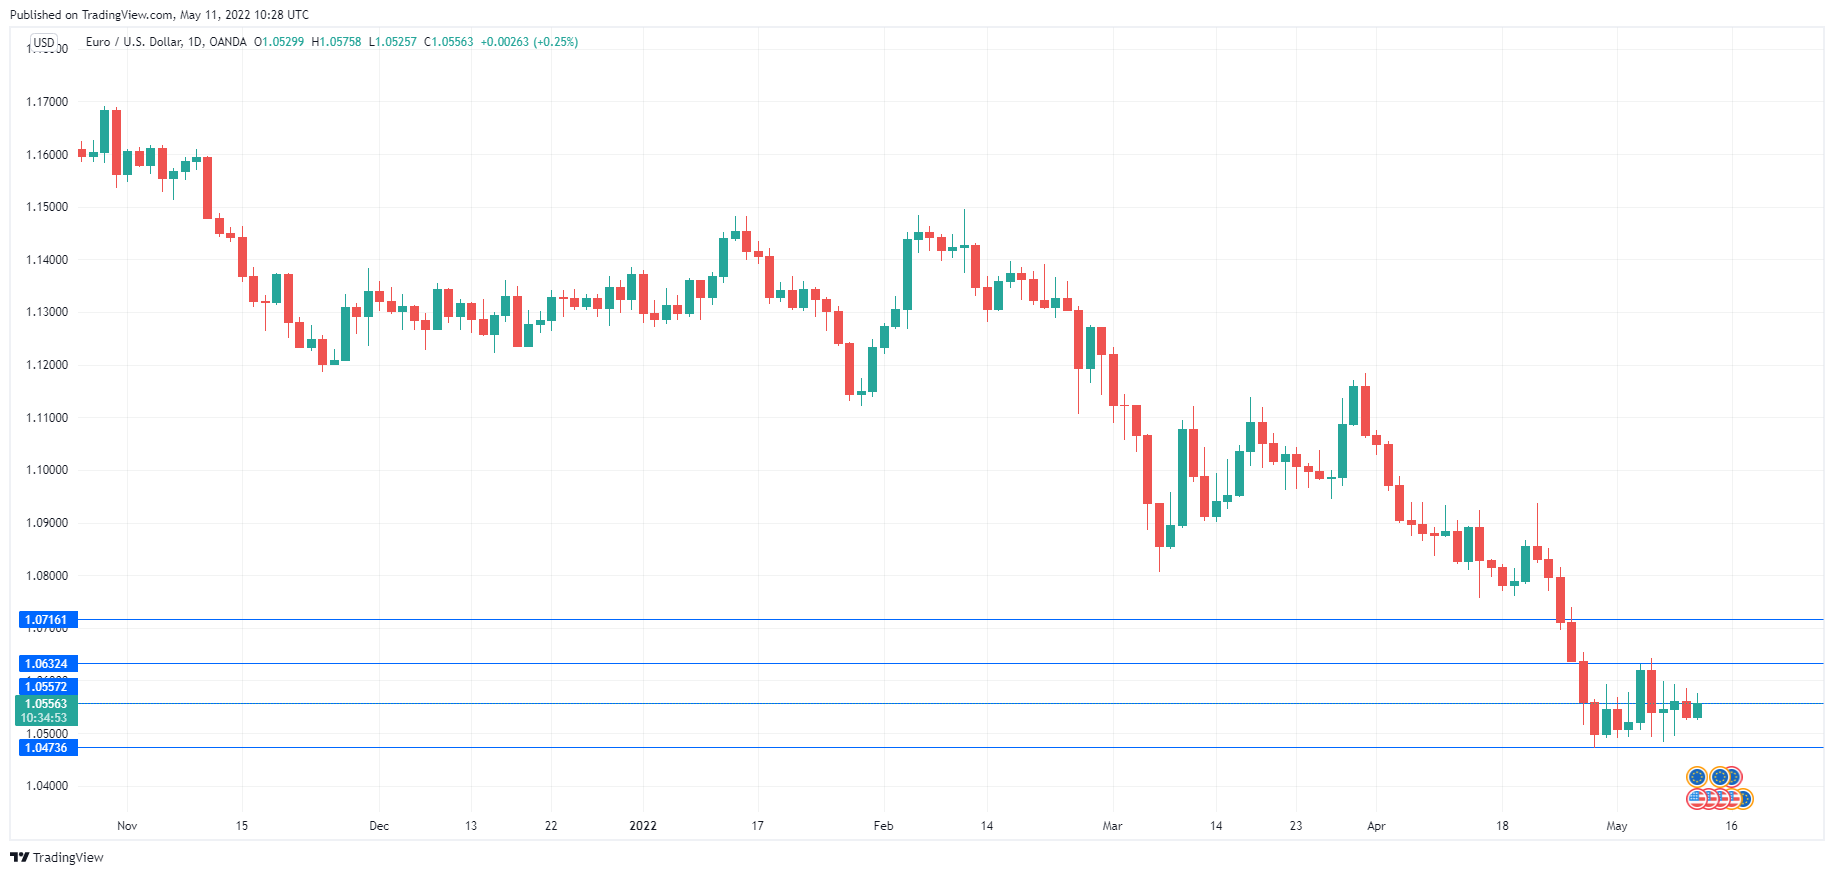
- 1.0557 remains a weak resistance line, followed by resistance at 1.0632
- There is support at 1.0473 and 1.0398
ECB Lagarde: First hike could come only few weeks after early Q3
ECB President Christine Lagarde indicated in a speech that the asset purchases could end "early" in Q3, and interest rate hikes could start "only a few weeks" after that.
"We will end net purchases under the asset purchase programme. Judging by the incoming data, my expectation is that they should be concluded early in the third quarter," she said.
"The first rate hike, informed by the ECB's forward guidance on the interest rates, will take place some time after the end of net asset purchases," she reiterated.
"We have not yet precisely defined the notion of 'some time', but I have been very clear that this could mean a period of only a few weeks. After the first rate hike, the normalisation process will be gradual," she added..
EURGBP Heads Sideways Below the 5-Month High
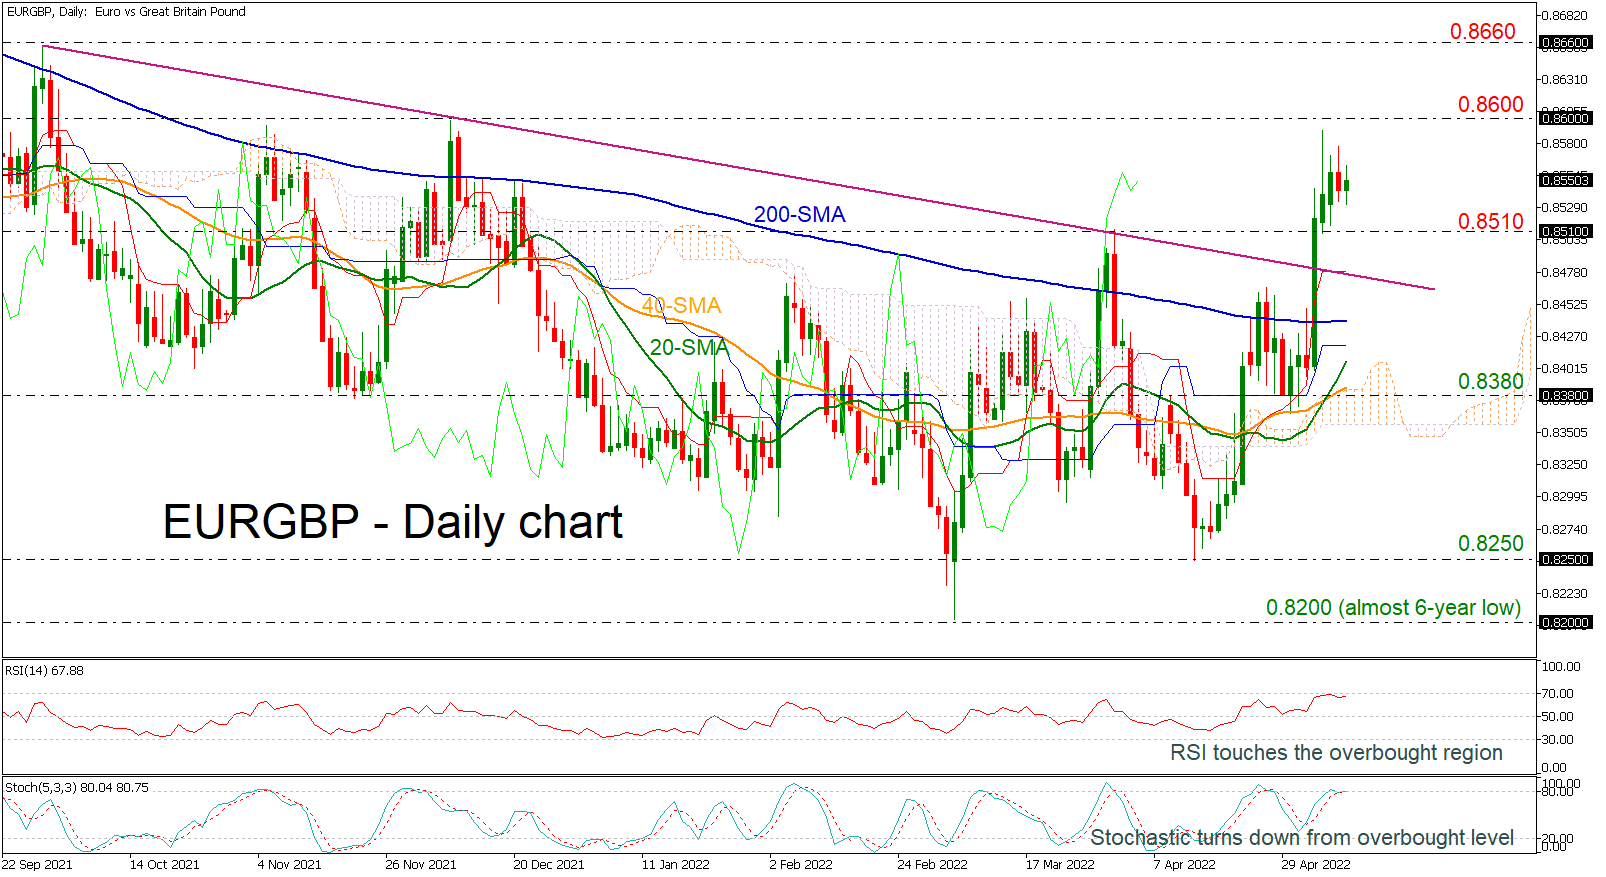
EURGBP is consolidating after a strong upside rally in the preceding sessions, while it is still holding well above the long-term falling trend line. The RSI is losing its positive momentum after the pullback from the overbought region. Also, the stochastic oscillator is ready to create a bearish cross within the %K and %D lines above the 80 level.
A reversal to the downside could find immediate support at the 0.8510 level, while below that, the descending trend line around 0.8480 could act significant barrier for traders. If the latter fails to halt bearish movements, the next target could be the 200-day SMA at 0.8438.
On the upside, the price could attempt to overcome the latest high of 0.8590 ahead of the 0.8600 psychological number. Should traders continue to buy the pair above that peak, bringing the uptrend into play, resistance could then run towards the 0.8660 barrier.
The short-term outlook has been bullish over the past month and only a decisive close below the downtrend line could resume the bearish picture.
USDJPY Ascent Oersists Around 20-Year Highs
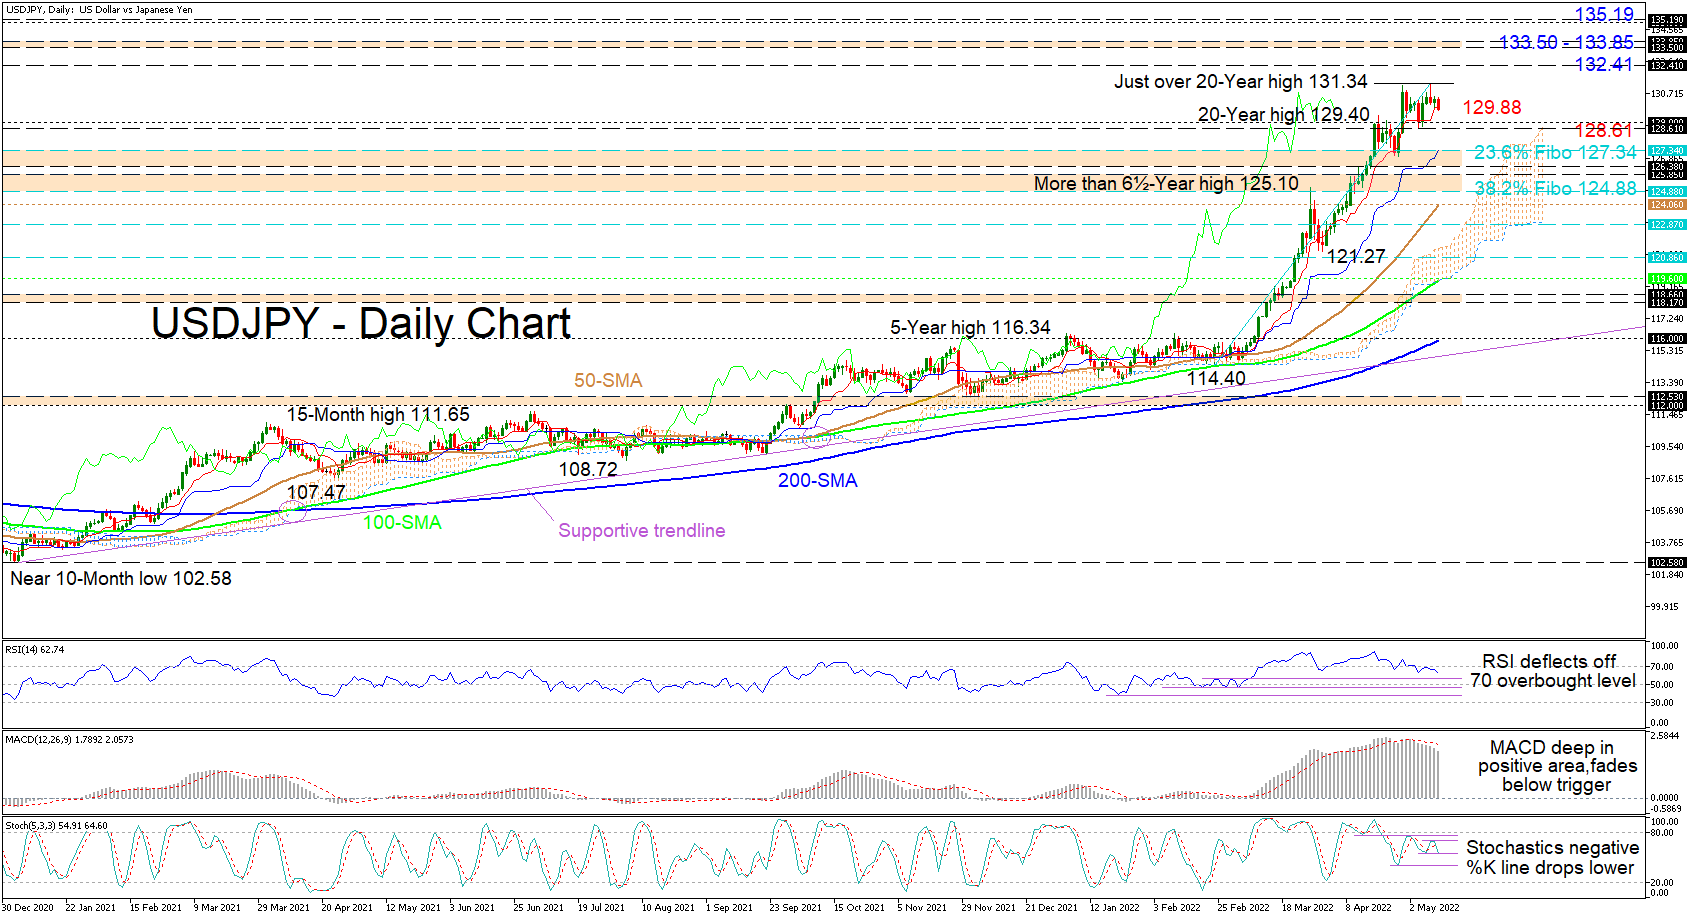
USDJPY continues to defy gravity with its recent two-and-a-half-month rally from 114.40, showing limited signs of slowing down. Reinforcing this viewpoint are the soaring simple moving averages (SMAs).
The Ichimoku lines are indicating that positive forces remain active, while the short-term oscillators are reflecting the latest impulses of downward pressures. The MACD is revealing some easing in positive momentum from the beginning of May, while the RSI is gliding lower in the bullish region. Moreover, the stochastic oscillator has regained its negative charge and is promoting the minor pullback in the price.
In the event sellers drive the price clearly below the red Tenkan-sen line at 129.88, support could commence from the 129.00 handle and the adjacent 128.61 low. Diving deeper past these nearby obstacles, the bears may confront a support region linking the 127.34 level, which is the 23.6% Fibonacci retracement of the up leg from 114.40 until 131.34, with the 126.38 border that stretches back to early March 2002. If selling interest remains heightened, the pair could then weigh on the support section between the June 2015 peak of 125.85 and the 38.2% Fibo of 124.88.
Alternatively, if buyers create traction off the red Tenkan-sen line at 129.88, initial resistance may transpire from the fresh 20-year high of 131.34. Successfully reviving the positive trajectory, the bulls may jump for the mid-April 2002 high of 132.41 before confronting the 133.50-133.85 resistance band, shaped by the highs over the latter part of March until early April 2002 period. Should the climb in the price endure, the 135.00-135.19 zone could provide the next limitations to the upside, which refers to a one-month period of highs spanning from late January until late February 2002.
Summarizing, USDJPY’s bullish structure remains intact above the congested support boundaries, forming a support buffer zone stretching from 124.88 until 127.34. That said, a price dip beneath the 129.00 handle and the 128.61 low may add credence to an evolution of a deeper pullback.
XAU/USD Outlook: Gold Hit Three-Month Low, Bears Await US CPI Data for Fresh Signal
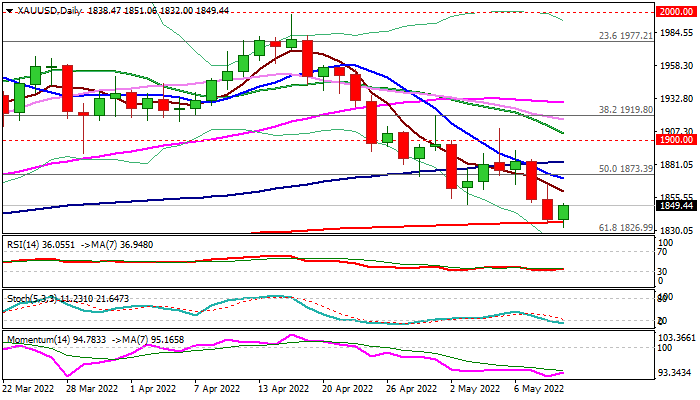
Spot gold is trading near new three-month low ($1832) posted in early Wednesday’s trading, with larger bears pausing here as traders await fresh signals from US inflation data, due later today.
The metal was under increased pressure from robust dollar which hit new 20-year high, driven by expectations of extended aggressive stance of the US central bank in attempts to cool down soaring inflation.
Analysts expect US monthly consumer prices growth to cool to 0.2% in April from 1.2% in March while annualized figure is forecasted to drop to 8.1% after hitting a 40-year peak at 8.5% previous month.
Traders focus more on the CPI’s impact on the Fed rather than gold’s role against inflation, with metal’s price likely to rise if inflation falls below expectations,
Conversely, stronger than expected figure in April would increase pressure on the yellow metal and push the price lower.
Bears cracked the upper boundary of critical support zone between $1835 and $1827, consisting of 200DMA and Fibo 61.8% of $1676/$2070, where the price action is currently facing headwinds.
Bullish scenario on rebound from here would require rise through pivotal barriers at $1895/$1900 to signal reversal and sideline bears, while break of these supports would risk fresh bearish acceleration and expose supports at $1800/$1780 (psychological / Jan 28 trough).
Res: 1860; 1870; 1895; 1900.
Sup: 1835; 1827; 1818; 1800.
Higher US CPI Could Trigger More Market Angst
Given the palpable woes surrounding inflation, markets will be keeping a wary eye on today’s US CPI release. The median forecast expects an 8.1% headline inflation print for April, which is a moderation from the 8.5% year-on-year jump registered in March.
A lower-than-expected CPI print would allow risk assets to breathe a momentary sigh of relief. Still, it wouldn’t imply that the Fed has achieved its inflation goals; far from it. After all, a single print does not a trend make. Headline inflation above 8%, or even 6.6% according to the Fed’s preferred PCE gauge, remains far elevated compared to the central bank’s target of a 2% average.
On the other hand, a higher-than-expected CPI print today is set to ramp up the Fed’s hawkish convictions, potentially helping the dollar index reclaim the 104 handle, while heaping more downward pressure on stocks. If US inflation is shown to be climbing persistently, that could see spot gold break below its 200-day simple moving average and immediate Fibonacci support level around the mid-$1830 region.
In order for risk assets to meaningfully pare losses, markets need to be assured that US inflation has indeed peaked and will continue decelerating, in turn allowing the Fed to ease off from its ultra-hawkish stance. Until then, markets remain at the mercy of policymakers’ battle against the hottest inflation in 40 years, with risk assets living on a prayer as long as the Fed has yet to reach peak hawkishness.
GBP/JPY Daily Outlook
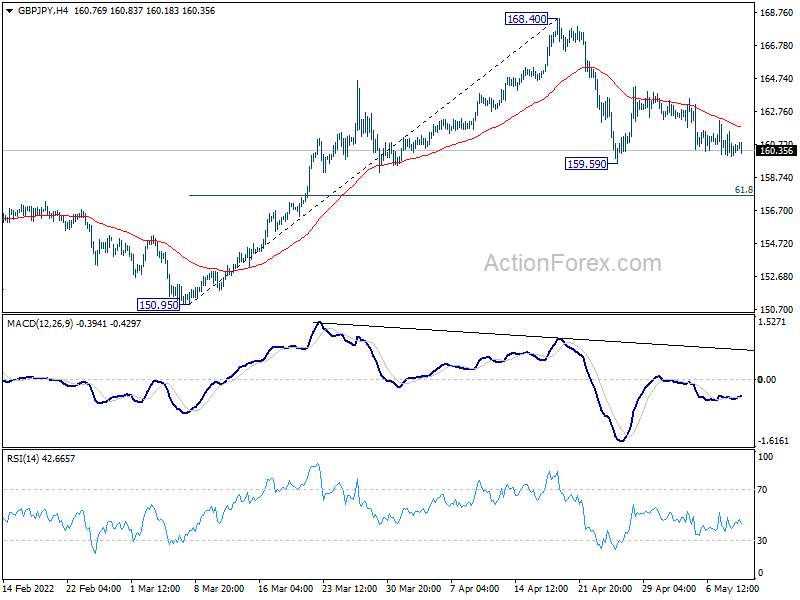
Daily Pivots: (S1) 159.98; (P) 160.75; (R1) 161.45; More...
Outlook in GBP/JPY is unchanged as corrective pattern from 168.40 is extending. Break of 159.59 will extend the correction from 168.40 lower. But downside should be contained by 61.8% retracement of 150.95 to 168.40 at 157.61 to bring rebound. On the upside, firm break of 168.40 will resume larger up trend.
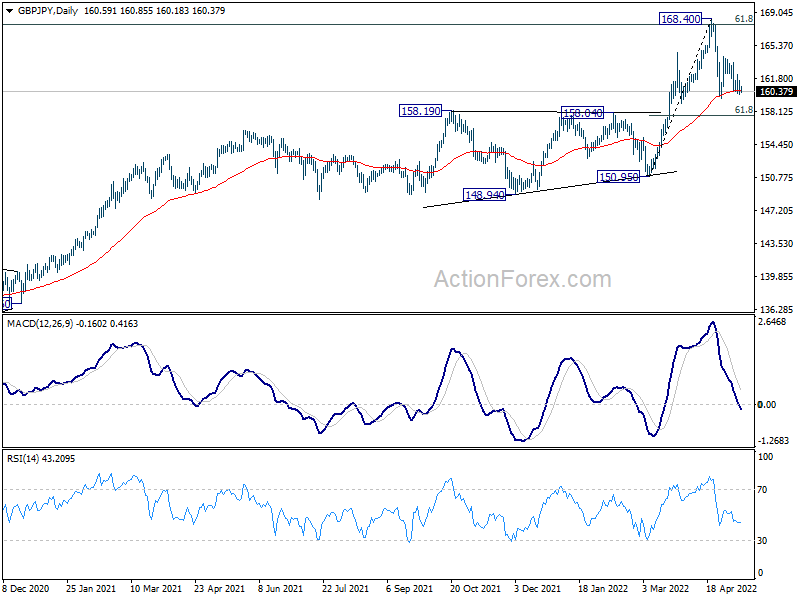
In the bigger picture, up trend from 123.94 (2020 low) is still in progress. Sustained break of 61.8% retracement of 195.86 (2015 high) to 122.75 (2016 low) at 167.93 will be a long term bullish signal, and could pave the way back to 195.86 high. This will now remain the favored case as long as 150.95 support holds, even in case of deep pull back.
EUR/JPY Daily Outlook
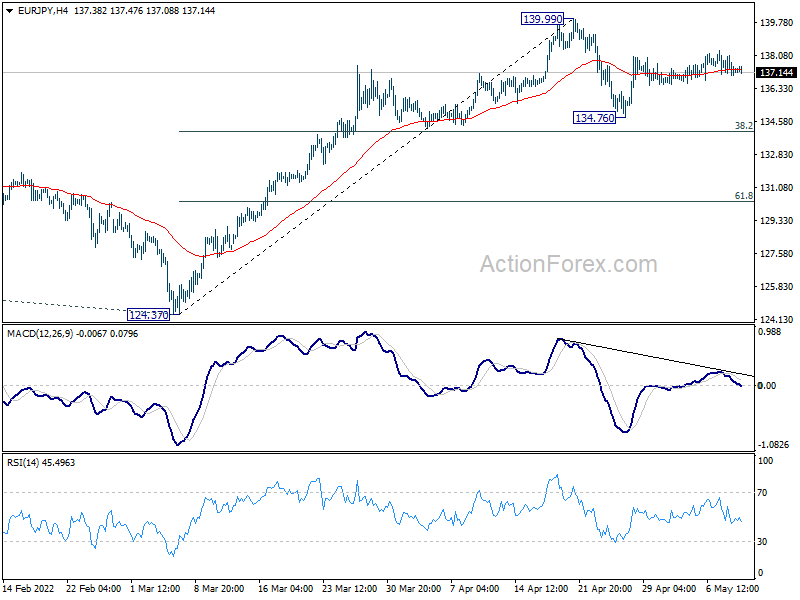
Daily Pivots: (S1) 136.89; (P) 137.49; (R1) 137.93; More....
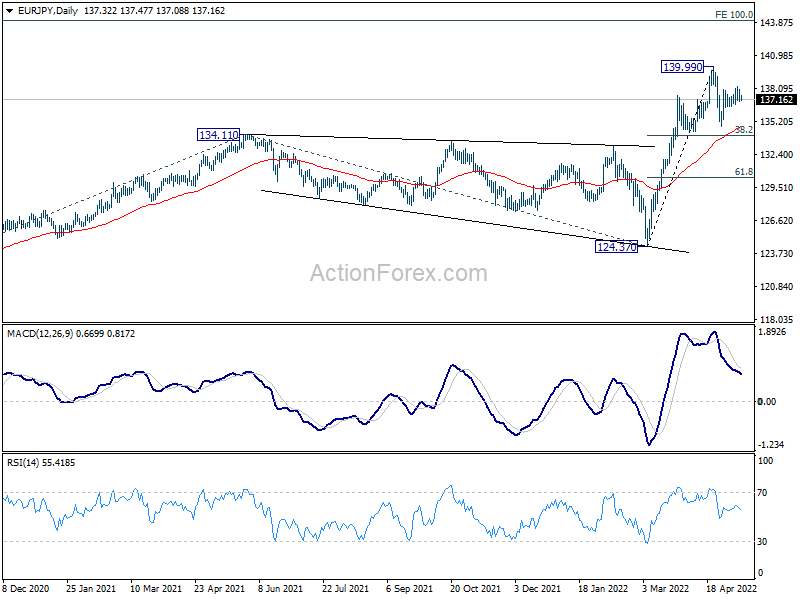
Intraday bias in EUR/JPY remains neutral as consolidation from 139.99 is extending. In case of another decline, downside should be contained by 38.2% retracement of 124.37 to 139.99 at 134.02 to bring rebound. On the upside, firm break of 139.99 will resume larger up trend for 144.06 medium term projection level.
In the bigger picture, up trend from 114.42 (2020 low) is in progress. Such rise is seen as the third leg of the pattern from 109.30 (2016 low). Next target will be 100% projection of 114.42 to 134.11 from 124.37 at 144.06. In any case, outlook will now remain bullish as long as 124.37 support holds, in case of deep pull back.
EUR/GBP Daily Outlook
Daily Pivots: (S1) 0.8529; (P) 0.8554; (R1) 0.8573; More...
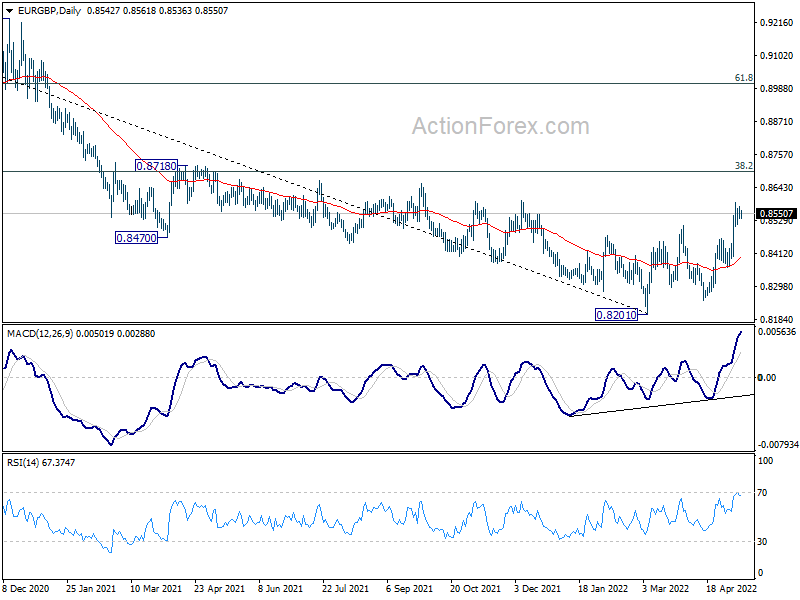
Intraday bias in EUR/GBP remains neutral for consolidation below 0.8590 temporary top. Outlook will stay bullish as long as 0.8465 resistance turned support holds. On the upside, break of 0.8590 will resume the rise from 0.8210 medium term bottom to 0.8697 medium term fibonacci level next.
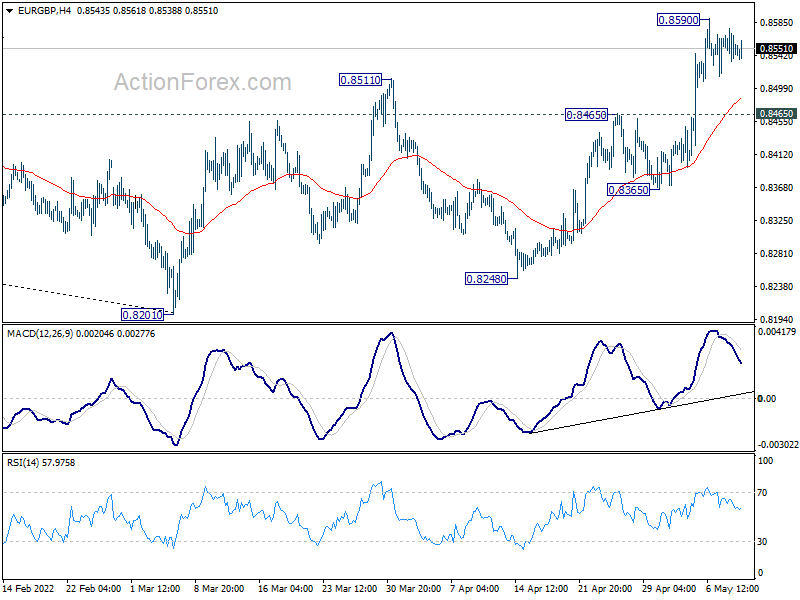
In the bigger picture, a medium term bottom could be in place at 0.8201, on bullish convergence condition in daily and weekly MACD. Rise from there could either be a correction to the down trend from 0.9499 (2020 high), or a medium term up trend itself. In either case, further rise should be seen to 38.2% retracement of 0.9499 to 0.8201 at 0.8697. Sustained break there will target 61.8% retracement at 0.9003.