Sample Category Title
Silver Tests a Make-or-Break Point
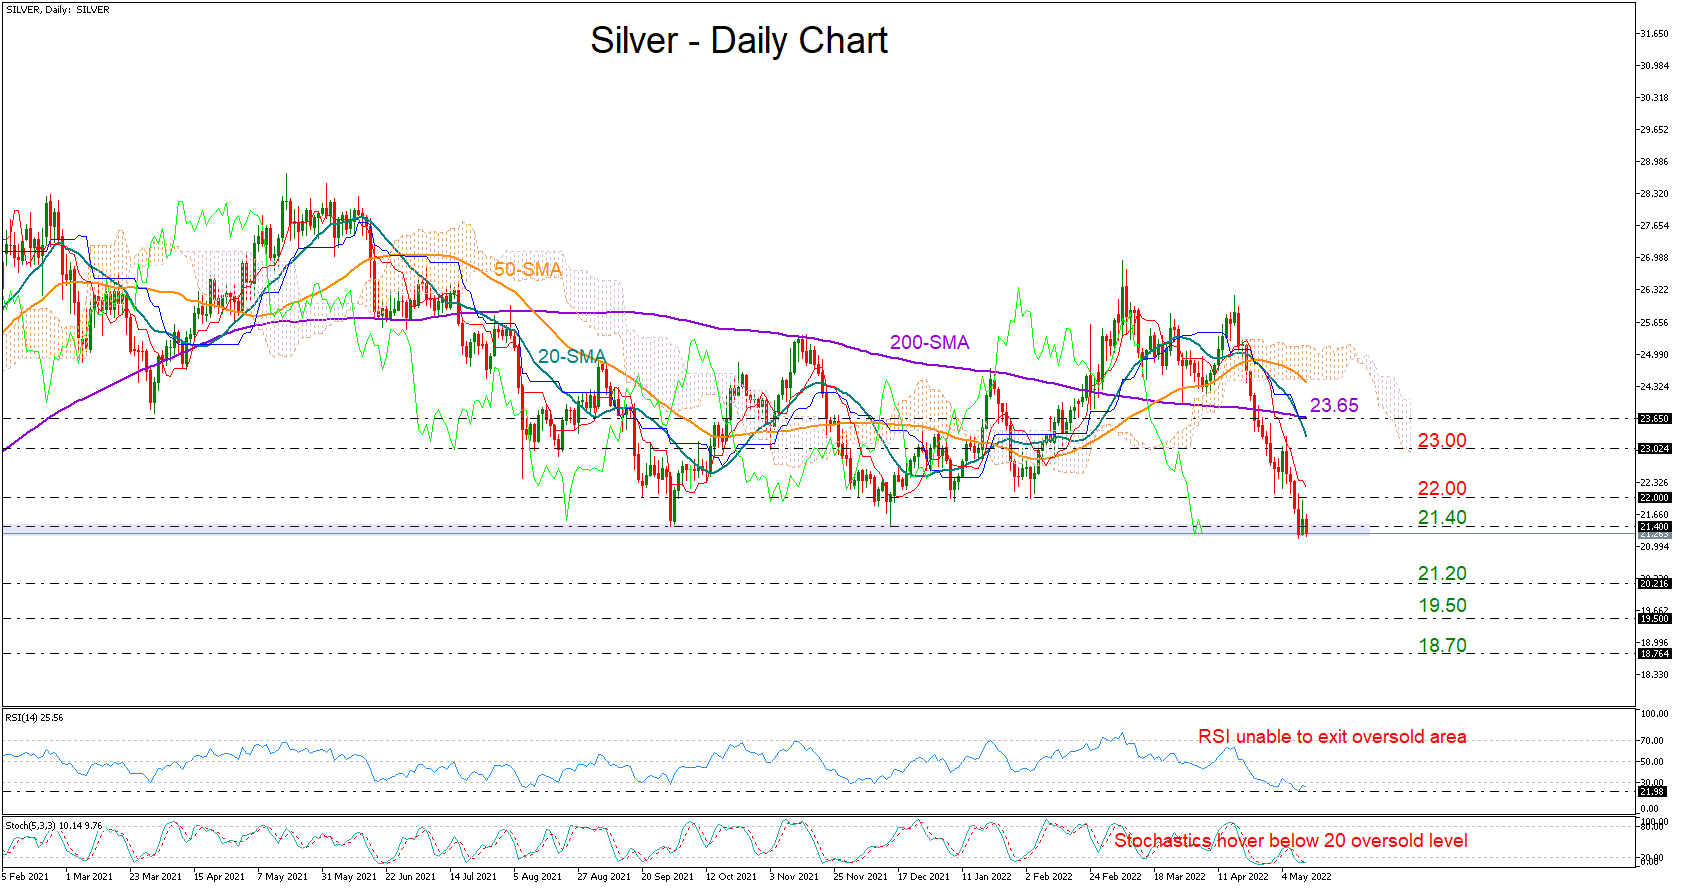
Silver’s long-term neutral outlook is at risk of a downgrade as the bears keep challenging the floor around 21.40 despite yesterday’s poor upturn.
The RSI and the Stochastics reflect oversold conditions, though neither of those indicators seem determined to change direction to the upside. Therefore, the base scenario is for sellers to dominate in the short term, although the case for a rebound will remain on the cards.
A close lower may initiate a sharper decline towards 20.20, where the key 200-weekly simple moving average (SMA) is positioned. The 19.50 level, which blocked the 2019 rally and delayed bullish corrections in mid-2020, may next attempt to save the market from further depreciation. However, if it proves fragile too, the sell-off could exacerbate to 18.70.
The way higher could be a tough job, as several obstacles may ruin any progress. The area around 22.00 will come first into view, whilst the constraining red Tenkan-sen line could add more pressure, preventing an acceleration to May’s resistance of 23.00. Further up, the 200-day simple moving average (SMA) currently at 23.65 could gain exclusive attention.
Overall, silver looks to be trading at a make-or-break point. A clear bounce above 21.40 would allow for more improvement, whereas a decisive close below it could push a group of traders out of the market.
Euro Drops to January 2017 Lows
The euro has fallen close to the 1.04 level, which has held since January 2017. In the European session, EUR/USD is trading at 1.0429, down 0.81% on the day.
ECB hints at a rate hike in Q3
After years of monetary easing which was fueled by low inflation levels, the ECB is slowly but surely switching gears and talking openly about a rate hike. It wasn’t long ago that ECB President Christine Lagarde was dismissing high CPI numbers as “transitory” and saying that the ECB would remain out of sync with the Fed and its tighter policy. Lagarde has been forced to change her tune, however, as eurozone inflation has soared, hitting 7.5%. Germany’s inflation rate, released today, rose to 7.4%, an all-time high for a second successive month (7.3% prior).
Eurozone inflation is being driven by high energy and food prices, both of which are largely due to the war in Ukraine. With no end to the conflict on the horizon, inflation could climb even higher, putting pressure on the ECB to start tightening policy.
Lagarde said on Wednesday that the ECB will end asset purchases in Q3 and follow with a rate hike “some time later”. Other ECB members have been less vague and are calling for a rate hike in July. There is a debate within the ECB whether to raise rates by 0.50%, which would bring the deposit rate to zero, or deliver a modest 0.25% increase. The ECB meeting in June should give the markets a better idea as to whether the July meeting will be live.
US inflation dips, but less than expected
US inflation slowed in April, but still came in stronger than expected. CPI dropped from 8.5% to 8.3%, higher than the consensus of 8.1%. This slowdown was not enough for the markets to price in “peak-US inflation”, and the dollar managed to hold its own against the major currencies. The Fed’s hawkish stance appears justified after the inflation release, as the markets are digesting the fact that if US inflation is easing, it will be at a slow pace.
EUR/USD Technical
- 1.0557 remains a weak resistance line, followed by resistance at 1.0632
- There is support at 1.0473 and 1.0398
BoE Ramsden: I don’t think we’ve gone far enough yet on bank rate
BoE Deputy Governor Governor Dave Ramsden told Bloomberg that stronger than expected job market could push inflation further higher from current 7% to 10% before year end. "Given what we know about the UK labor market, I wouldn't be surprised if it turned out to be a bit tighter," he said. "I think there are upside risks on inflation the medium term."
"Certainly on the basis of my current assessment of prospects, we're not there yet in terms of how far monetary policy has to tighten," he said. "I'm still very, very supportive of the forward guidance that there may well need to be further tightening in the coming months."
June "will be a chance to take stock -- in this extraordinary period we really are learning things everyday," he said. "I don't think we've gone far enough yet on bank rate, but I do think that what we've already done is having an impact."
AUDUSD Six Days in the Red after Deflection off MAs
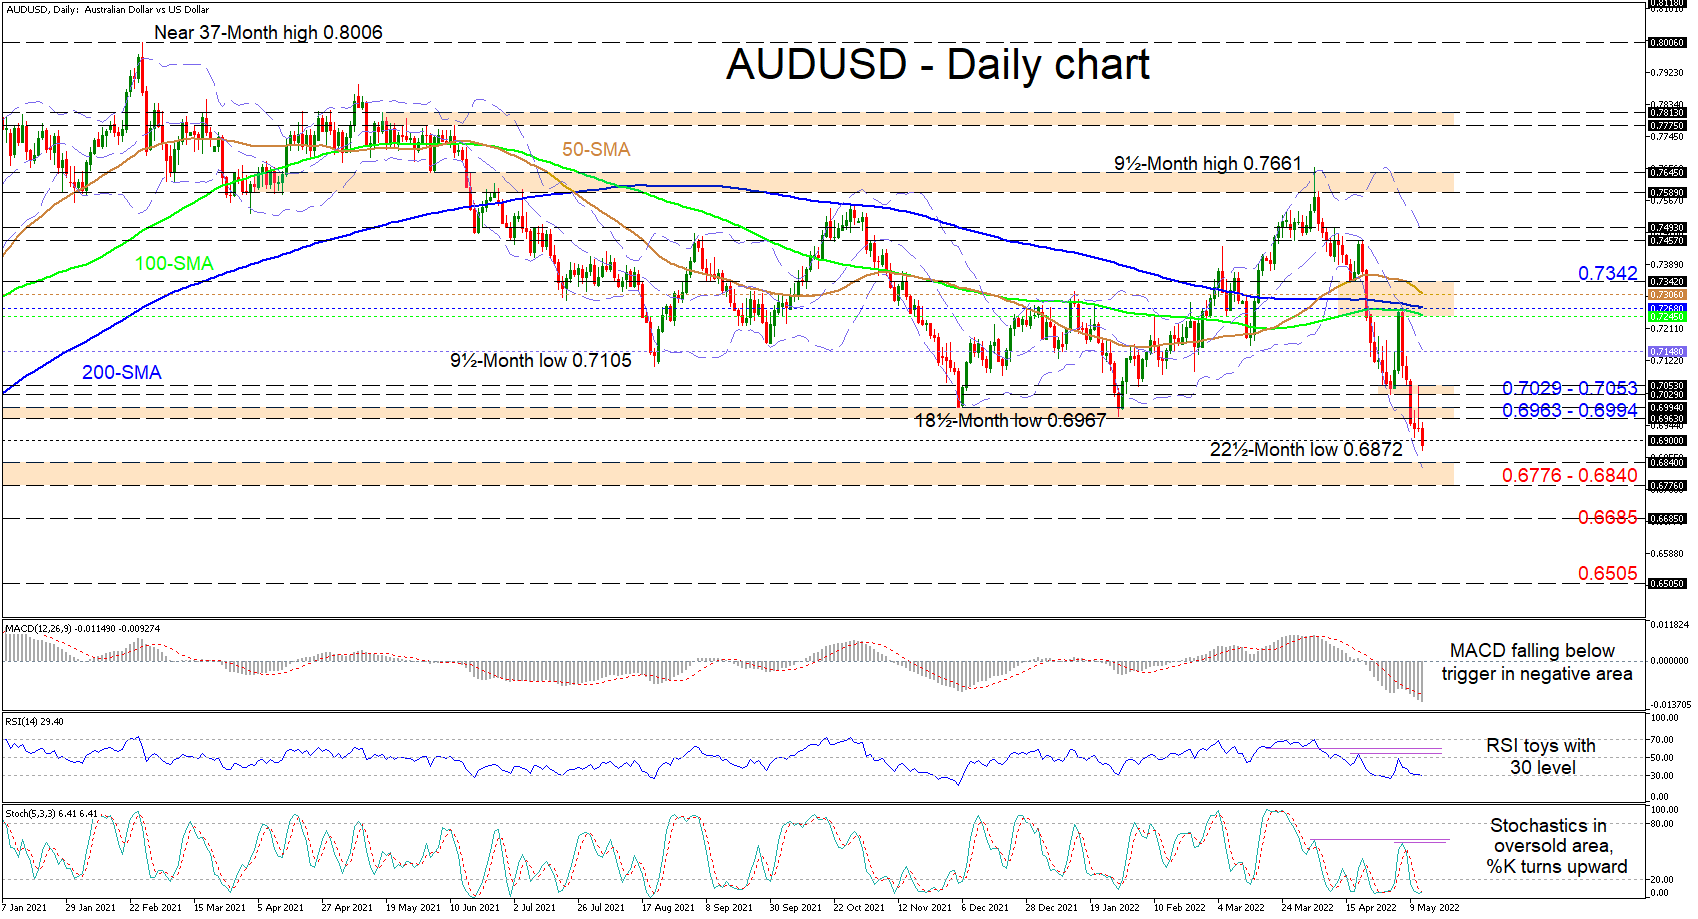
AUDUSD has pierced beneath the 0.6900 border and is eyeing the lower Bollinger band, located within the key 0.6776-0.6840 support boundary that stretches back to mid-June 2020. While the longer-term 100- and 200-day simple moving averages (SMAs) have capped advances, the rolling over of the 50-day SMA is endorsing a continuation of the more than one-month decline from the bullish spike of 0.7661.
Meanwhile, the short-term oscillators are transmitting conflicting messages in directional momentum. The MACD is suggesting additional selling in the pair, while the softer slide in the RSI is implying weakness in bearish impetus. Moreover, the stochastic oscillators’ negative charge is looking dubious as, south of the 20 mark, the upturn in the stochastic %K line has nudged above the %D line.
If the downward trajectory endures, preliminary support could occur around the fortified 0.6776-0.6840 support section shaped by the lows over the second half of June 2020, a zone which also contains the lower Bollinger band. Successfully diving underneath this crucial border may reinforce the negative outlook, with sellers aiming to weigh on the 0.6685 inside swing high recorded in the early stages of March 2020. If sellers retain control, they could then seek out the 0.6505 low around the end of May 2020.
On the flipside, if buyers re-emerge and drive the price back above the 0.6900 hurdle, they may be confronted with nearby upside constraints starting with the tough 0.6963-0.6994 resistance band, shaped by multiple troughs extending back to mid-July 2020. Secondly, not much higher, the 0.7029-0.7053 barrier could then come into focus. Should buyers overrun these congested barricades, they may then tackle the falling mid-Bollinger band at 0.7148 before pursuing a significant section of resistance existing from the 100-day SMA at 0.7245 until the 0.7342 inside swing low.
Summarizing, AUDUSD is sustaining a broader bearish bias below the 0.6963-0.6994 support foundation and the 0.7245-0.7342 resistance region, which includes the May high. That said, for optimism to begin to grow, the bulls would need to propel the price north of the 0.7029-0.7053 obstacle.
NZDUSD Sinks to Fresh 2-Year Low; Bearish Bias Intact
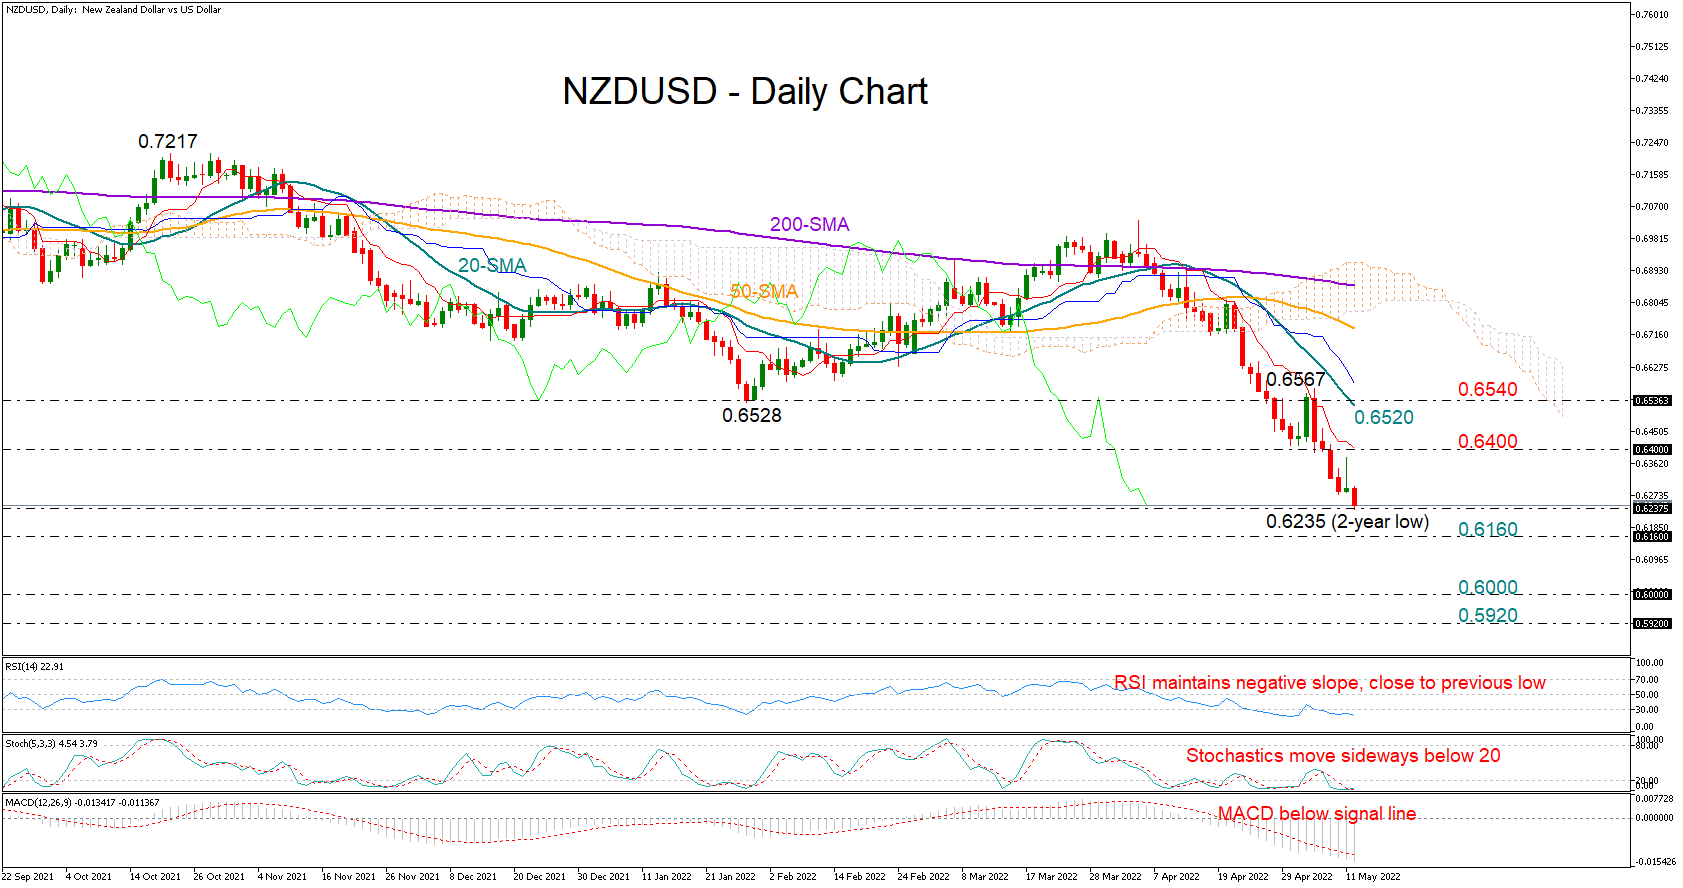
NZDUSD switched to a bearish mood again on Thursday after a neutral session, stretching its downtrend to a fresh two-year low of 0.6235.
In technical indicators, the MACD remains negatively charged below its red signal line, while the RSI and the Stochastics have no intention of exiting the oversold territory, though they keep a foothold around their previous lows, signaling a cautiously bearish bias.
The next opportunity for a rebound could be nearby at 0.6160. This is where market actions faced limitations during the first half of 2020; therefore any step lower may see a continuation towards the 0.6000 psychological mark. Marginally lower, the support of 0.5920 will be on the radar as well. However, if the bears dominate below 0.5842 too, the way will clear towards the important barrier of 0.5658 from March 2020.
On the upside, traders will keep a close eye on the red Tenkan-sen line at 0.6400, which has been rejecting bullish attempts since the start of April. A successful close above that line could give the green light to the 20-day simple moving average (SMA), and more importantly, bring the 0.6540 monthly bar into scope. Additional gains from here would raise confidence that the bullish wave might be something more than temporary.
Summarizing, the bearish outlook continues to worsen in the NZDUSD market, with the focus turning now to the 0.6160 barricade. In case the bulls come into play, traders will look for immediate resistance around 0.6400.
BTCUSD Falls Without a Parachute
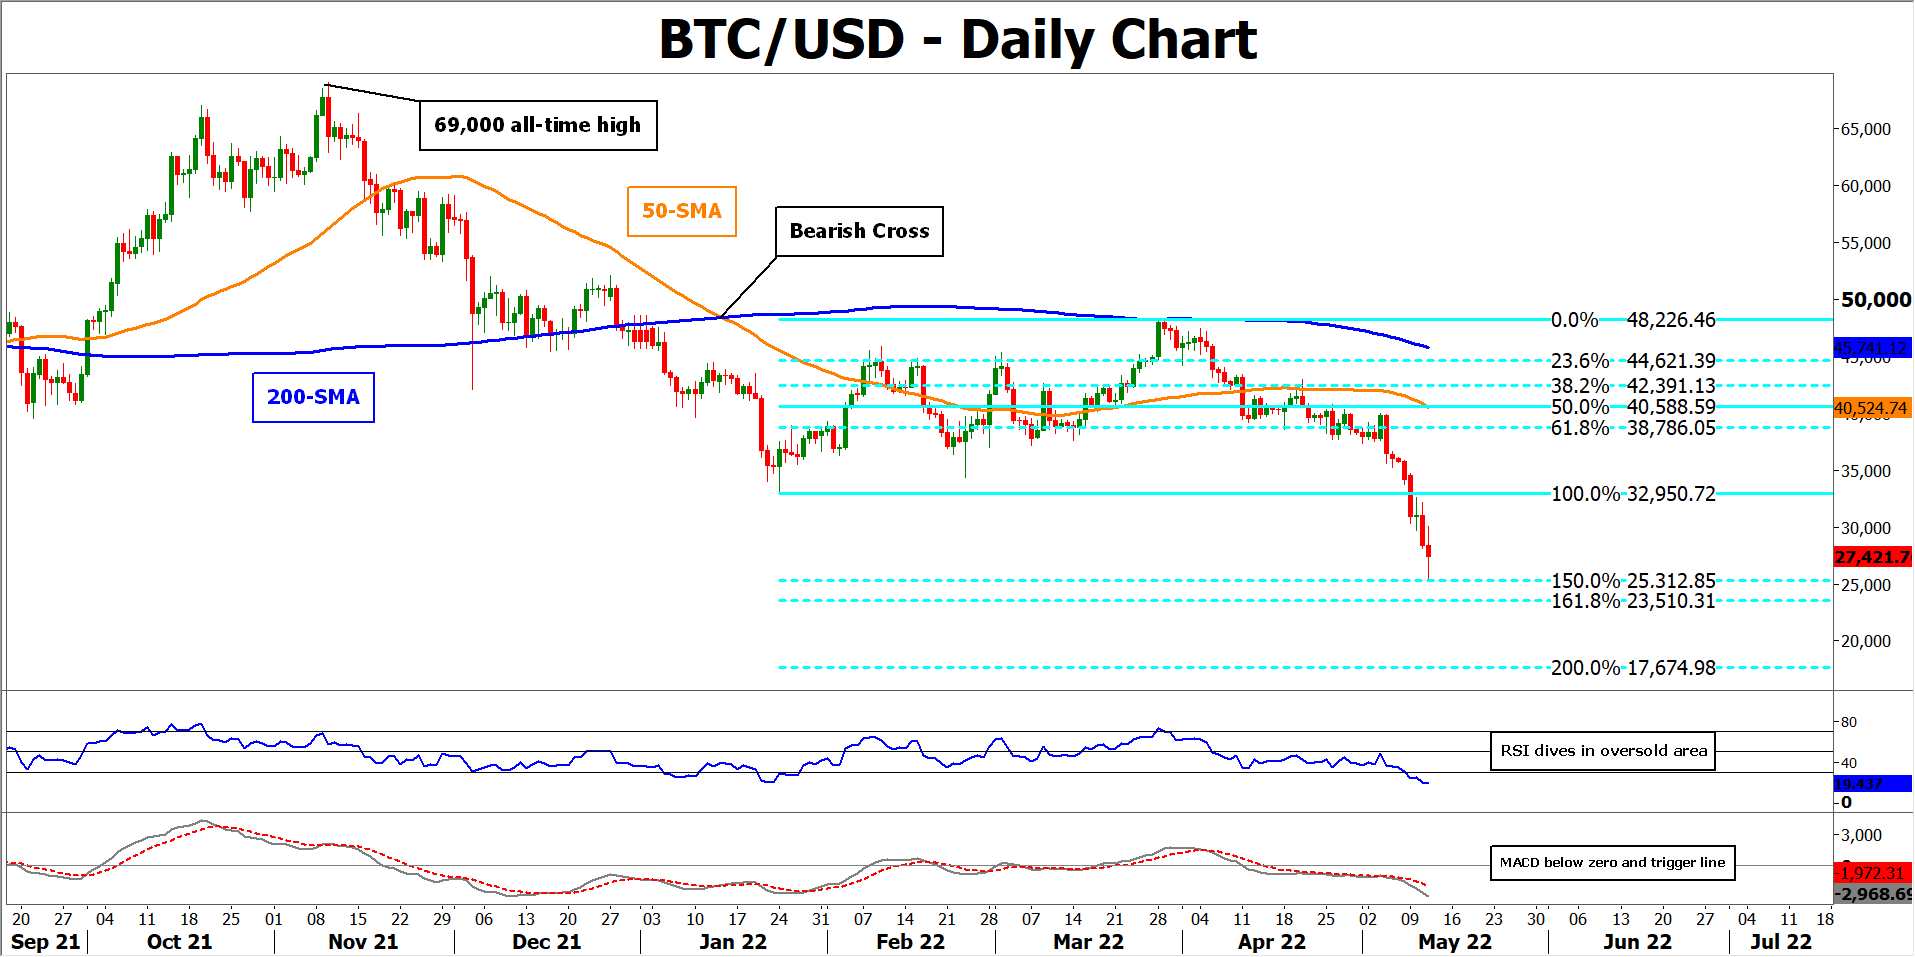
BTCUSD has come under tremendous selling pressure in the past few daily sessions, generating a fresh 16-month low. Overall, the technical picture has started to deteriorate, with a series of lower lows and lower highs forming on the daily chart.
The momentum indicators further confirm the bearish near-term bias. The RSI is dipping downwards in the oversold area, while the MACD histogram is currently beneath both zero and its red signal line.
Should negative momentum intensify, the price could generate fresh 2022 lows and might halt its decline at the 25,312 level, which is the 150% Fibonacci extension of the 32,950-48,226 up leg. Diving beneath that region, the 161.8% Fibo of 23,510 may act as the next line of defence. A violation of the latter zone could then turn the spotlight to the 200% Fibo of 17,674.
On the flipside, if the bulls re-emerge and push the price higher, initial resistance could be encountered at the 32,950 barrier. Piercing through this ceiling, the 61.8% Fibo of 38,786 may prove a tough obstacle before the attention shifts to 50% Fibo of 40,588, which overlaps with the 50-day simple moving average. Higher up, further advances could then stall at the 38.2% Fibo of 42,391.
Overall, BTCUSD remains in a sharp downtrend, while its technical picture is becoming increasingly worrisome. For that bearish tone to reverse, the price must initially jump above the 32,950 ceiling.
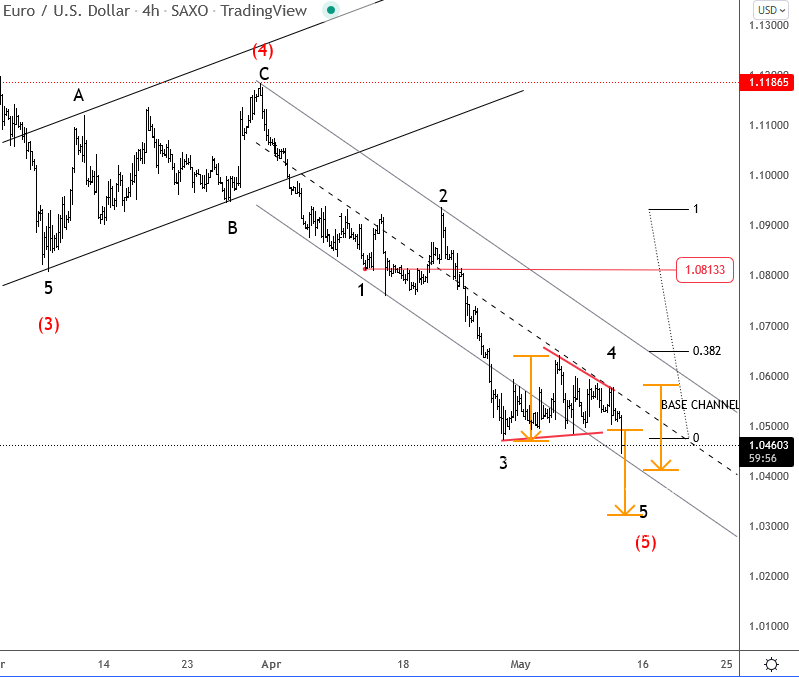
Elliott Wave analysis: EUR/USD breaking down from a triangle
Stocks are trading down sharply, after the US CPI data yesterday when numbers above expectations were enough for speculators to sell stocks and buy the USD on hawkish FED projections, with even a 75bp hike in view in the next meeting.
Finally, the EURUSD is breaking down, and ECB cannot stop the bears with their comments, we need real policy actions from the ECB for a change in trend. Pair broke below 1.05 level which was a key spot for a continuation down into a fifth wave. So as long as this price holds, trend is down, but keep in mind that drop is coming out of a triangle, so it's final stages of a higher degree trend, therefore be aware of a reversal. Why? Because, firstly everyone just watches or will give up on the direction of the pair, when it's in a chop in a triangle range, but then, after a breakdown, everyone wants to catch the move, most of them too late and action is overcrowded, thus the opposite may follow. Fifth wave projection is at 1.03 and 1.04.
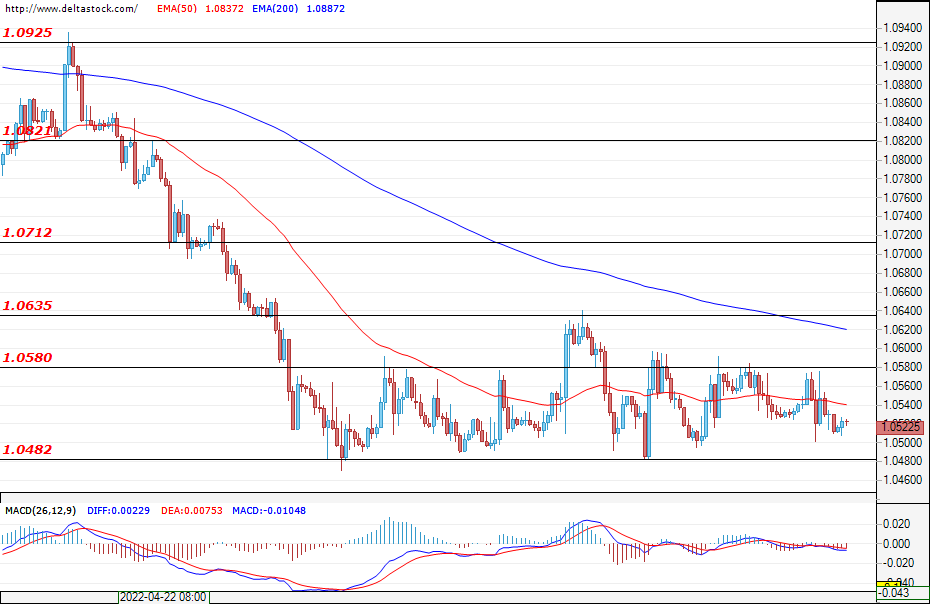
Daily Technical Analysis
EUR/USD
The pair continues to trade between the support at 1.0482 and the resistance at 1.0580. The range has been going on for two weeks now, with neither side taking the initiative. The market needs a catalyst in order to find a clear direction, and so far the rise in the U.S. interest rates and inflation data have failed to provide this initial jolt. There is accumulated liquidity around both the support and the resistance levels and it is likely that the first breach of the range will be fake and the market will move in the opposite direction. The market is likely to remain in "standby" mode, and more activity can be expected in case of a confirmed breach in one of the support and resistance areas. Today, increased volatility can be expected around the announcement of the PPI data for the United States at 13:30 GMT.
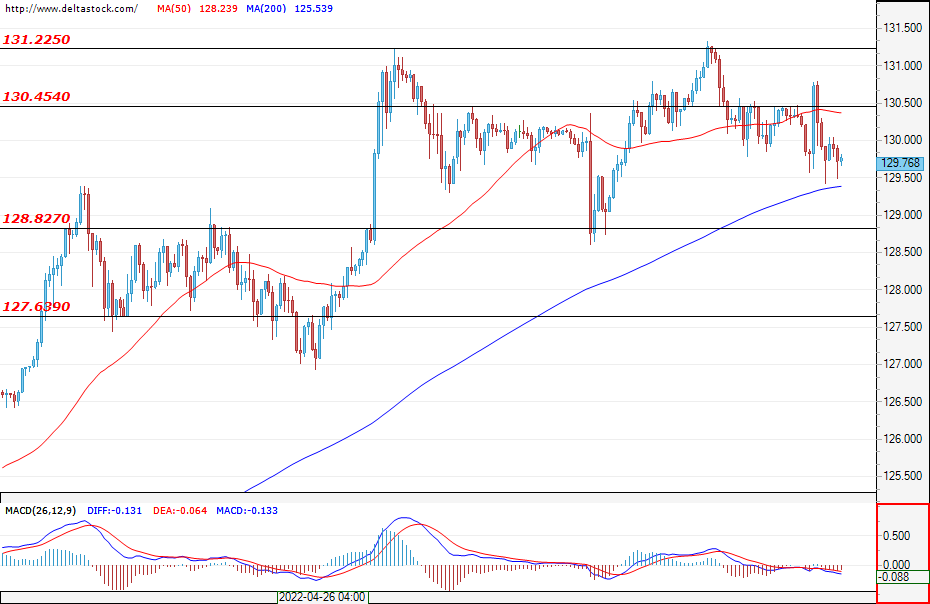
USD/JPY
The dollar retreated from the highs against the yen. The market is currently entering a range phase, with the main support being 128.82. First resistance zones for the bulls are 130.45 and 131.22. It is expected that the uptrend will continue again as a breach of 131.22 would pave the road towards 133.00. Before that, however, it is possible for the bulls to retreat and look for better opportunities to enter under the support of 128.82.
GBP/USD
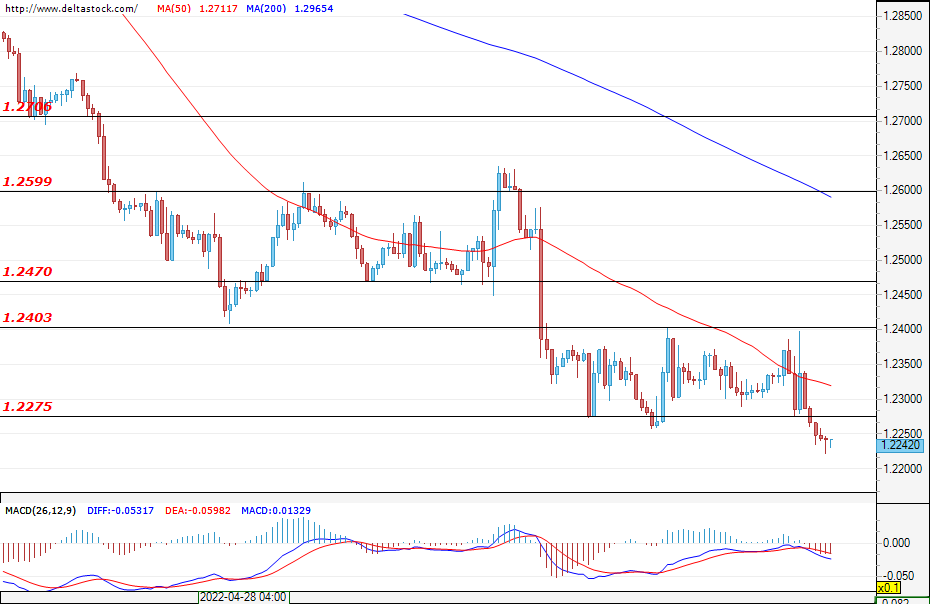
The Cable breached the support at 1.2275 at the end of the trading session. In the early hours of today, there isn't much activity, but with the opening of the European markets, a test of the breach at 1.2275 is possible. If it turns out to be fake and prices stay above the support, then attacks on the resistance zones at 1.2403 and 1.2470 can be expected. On the higher time frames, the declines seem quite stretched and a deeper pullback from the current levels is possible. If, however, the bearish pressure continues, then the declines could deepen towards 1.2060. This area has been a crucial support level for the market since 2016, and so if it is cleared, then the sterling could have a very bumpy road ahead of it.
EUGERMANY40
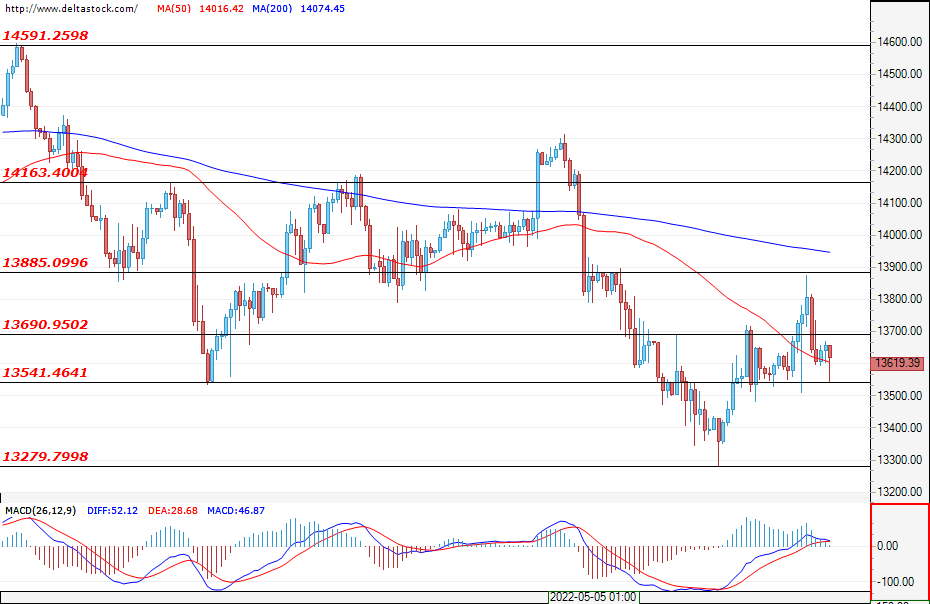
Yesterday, the German index managed to solidify the support at around 13540 and the bulls tested the resistance at 13885. Most of the gains for the day were erased due to downturns in the U.S. stock markets, but the session ended in the green. The trade is expected to continue in the wide range between the support at 13540 and the resistance at 14160. The first resistance of the day is the area at around 13690.
US30
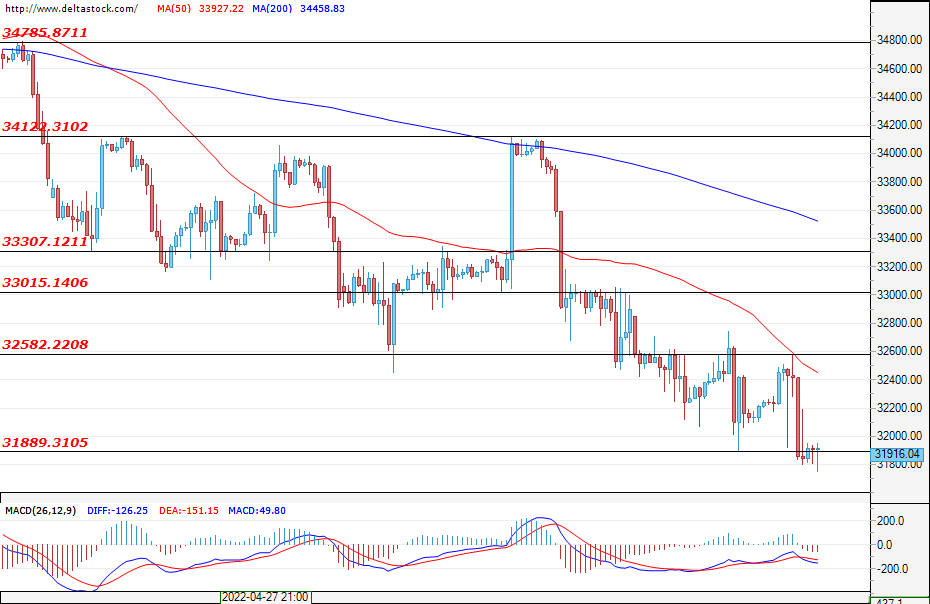
The U.S. blue chips are about to realise a fifth consecutive week of losses. Such a phenomenon is rare and so the sentiment is already extremely negative. However, a relief rally towards the resistance at around 33,000 can be expected soon. The support at 31890 was briefly disrupted and the coming days will show whether yesterday's downturns signalled the capitulation of the bulls. The first resistance for the bulls is 32580, while difficulties can be also encountered at around 32200. Given that the collapse continues, a breach of 31890 and a decline towards 31670 can be expected.
US Oil Bounces Higher
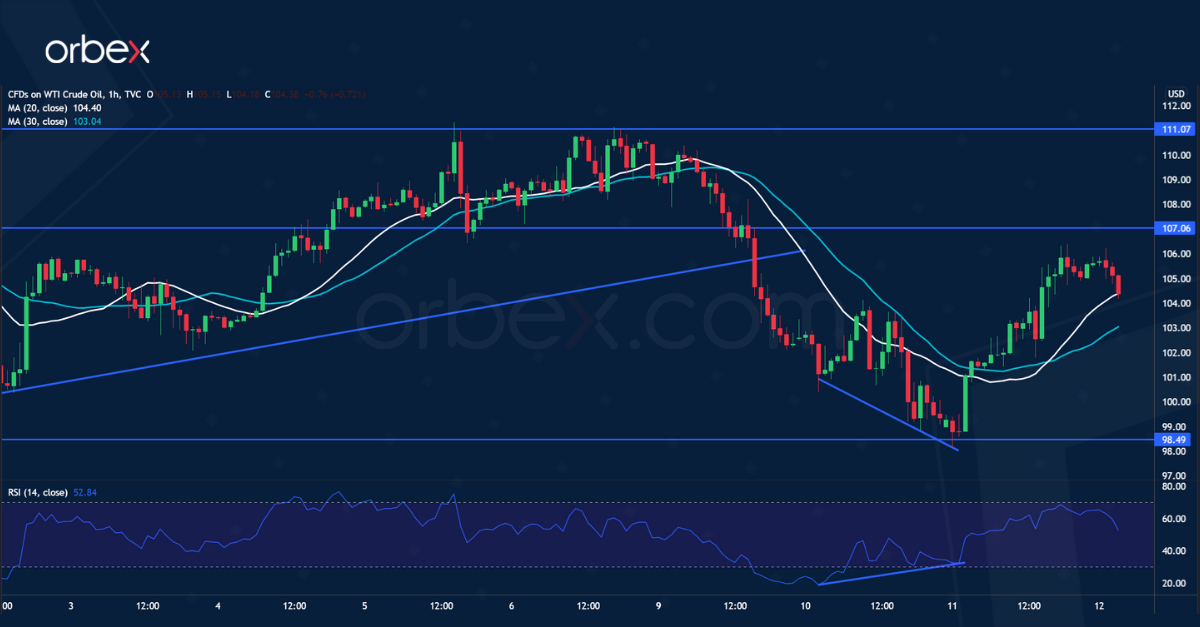
WTI crude rallies as Russia retaliates by sanctioning European gas companies. A fall below the rising trendline near 106.00 has put the bulls on the defensive. The price has met bids at 98.50 and in conjunction with a bullish RSI divergence could attract more buying interest. Optimism may gain traction if buyers succeed in holding above this demand zone. A close above support-turned-resistance at 107.00 would put the bulls back in the game. Then a break above 111.00 could trigger an extended rally above 117.00.
XAU/USD Tests Demand Area
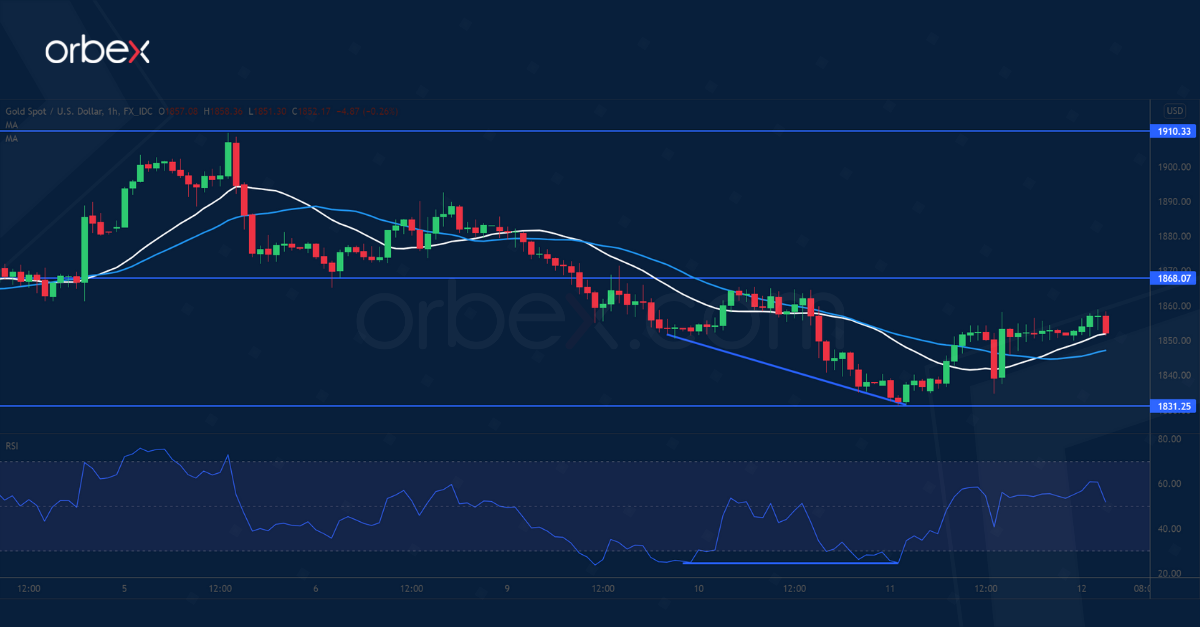
Bullion steadied after the US CPI receded in April. The price action has found some support at the base of the February bullish breakout. A bullish RSI divergence indicates a slowdown in the downward momentum, a prerequisite for a reversal. 1868 is a key resistance and a breakout would confirm the demand zone and prompt sellers to cover their bets. Then 1910 is the last hurdle before sentiment would turn around. On the downside, a break below 1831 would send the precious metal to the psychological level of 1800.