Sample Category Title
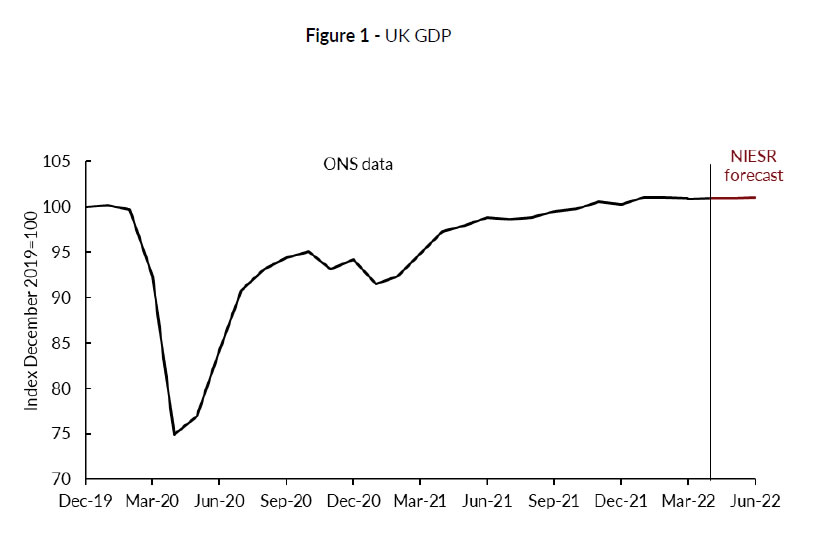
NIESR: UK growth to be largely flat in Apr, close to flatlining in Q2
NIESR expects UK economic growth to be "largely flat" in April, and "close to flatlining" in Q2 overall. it
Rory Macqueen Principal Economist, NIESR, said:
"March's deterioration in consumer confidence translated into a sharp fall in retail and wholesale, which was exacerbated by continuing supply-chain problems in the motor industry. Offsetting this, the continuing normalisation of GP and hospital activities cancelled out falling Covid-related activity to mean that the health sector returned to month-on-month growth. Falling business investment in the first estimate for the first quarter is a concern: with the government's tax 'super-deduction' expiring in under a year we still see little sign of a recovery from the Covid shock."
Dollar Index: Dollar rises to 20-year high on growing safe-haven demand
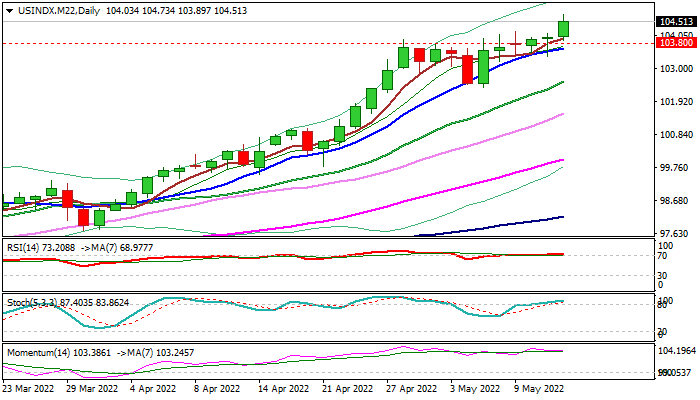
The dollar index rose to a fresh twenty-year high on Thursday, as concerns that tightening monetary policies in attempts to put raging inflation under control would impact global economy, accelerated migration into safety that further lifted the greenback.
The data on Wednesday showed that inflation eased in April but is likely to stay high in coming months, adding to expectations that the US central bank may take more aggressive steps in coming policy meetings this year.
Fresh acceleration higher this week, broke above critical resistance at 103.80 (peaks of 2017/2020) and is on track to eventually register a weekly close above this barrier that would add to strong bullish signals.
Firm break of 103.80 pivot would open way for attack at Dec 2002 high (107.40), with stronger acceleration to challenge Fibo 138.2% projection (109.39) and psychological 110 level.
Overbought conditions on daily and weekly chart studies were so far ignored, as extremely supportive fundamentals continue to lift the dollar, however some price adjustment can be expected in coming sessions, with dips to offer better buying opportunities.
Former critical resistance at 103.80 reverted to solid support, reinforced by rising 10DMA (103.62).
Res: 104.73; 105.00; 105.50; 107.40
Sup: 103.80; 103.62; 103.38; 102.55
Sunset Market Commentary
Markets
It’s just one of these days when you don’t know where to look first on markets. We’ll start with the most obvious one this year: fixed income. Ever since Monday’s early push for new recovery highs failed, yields are in decline. Bar the early stages on the Russian invasion in Ukraine, it’s only the first meaningful correction since the upleg accelerated around the turn of the year. A drop in inflation expectations is the main culprit. Given that it is accompanied by lower instead of higher real rates (especially in the US), it suggests doubt on the growth outlook rather a real downscaling of tightening expectations by central banks. European (real) rates even tend to increase somewhat (off low levels) given that the ECB finally wants to pursue an inflation-fighting strategy even as it comes with an economic cost. US yields lose 6.7 bps (30-yr) to 10 bps (5-yr) today with the belly of the curve outperforming the wings. German Bunds outperform US Treasuries with German yields sliding by 10.4 bps (2-yr) to 14.2 bps (5-yr). 10-yr yield spreads narrow by up to 2 bps for the semi-core and by 5 to 9 bps for the periphery (Italy outperforming).
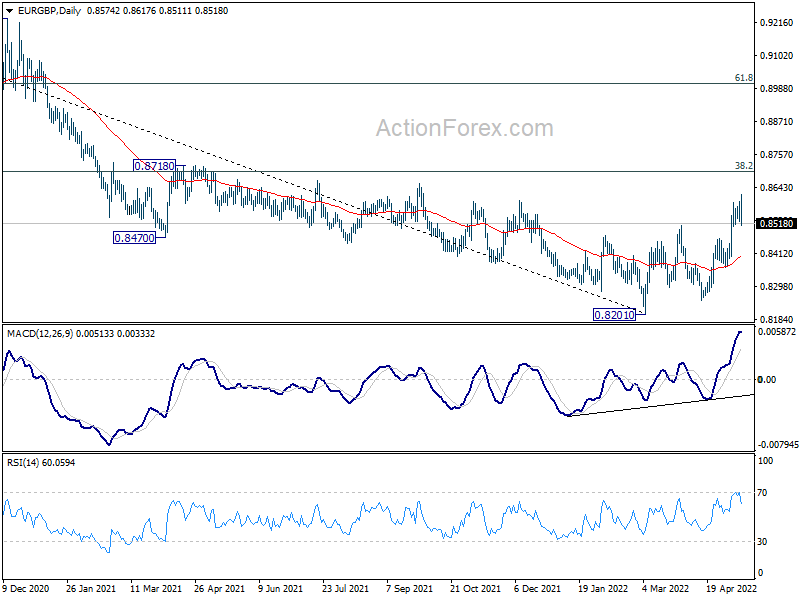
European stock markets shed 1.5% to 2.5% today, allowing us to label yesterday’s action a dead cat bounce. Main US equity gauges open 1% to 2% softer. The podium in FX space goes to the Japanese yen (1), US dollar (2) and Swiss franc (3). USD/JPY finally leaves the 130-zone behind to firmly correct towards the low 128-area. Against all other currencies, the greenback shows its strength. Resistance zone all of sudden give away like nothing. The trade-weighted dollar moves beyond 103.82 resistance (2017 top) to change hands around 104.40, its best level since 2002. EUR/USD drops through the 1.05 floor and temporarily even through 1.04 with the 2017 bottom of 1.0341 only inches away. It proves our fear that it will take more than a rate lift-off by the ECB to restore credibility in its institution and its single currency. USD/CNY pushes from 6.7 to 6.8, the highest level since September 2020 with CNY-weakness adding to the picture (lockdown and easing related). EUR/GBP seems to be the odd one out today. Failure to take out KEY resistance at 0.86 this morning triggered significant return action lower (0.852). We acknowledge hawkish comments by BoE Ramsden, but these don’t weigh against today’s risk-off market climate.
News Headlines
The Czechs get a lot of market attention this week. The Czech National Bank (CNB) held an extraordinary meeting today. It announced it intervened on FX markets in a reaction “to the sizeable depreciation of the koruna in recent days”. The CNB made the goal pretty clear: preventing a longer-term weakening of the currency at a time of skyrocketing inflation. Rumours last week and then the actual confirmation yesterday of monetary dove Michl as the next CNB president delivered a one-two punch to the koruna. EUR/CZK jumped almost a full big figure from 24.5 to 25.5, nearing levels seen in the wake of the Russian invasion. Back then, the CNB intervened too. EUR/CZK retreats to below 25 following the CNB’s actions today.
Swedish April inflation topped estimates on all accounts. Headline inflation rose 0.6% m/m to 6.4% y/y. That’s up from 6% in March and more than the 6.2% expected. The gauge using a fixed interest rate (CPIF, watched closely by the Riksbank) printed exactly the same. Core CPIF (ex. energy) soared 0.9% m/m to be 4.5% higher compared to the same month last year. The Riksbank last month embarked on a tightening cycle, raising rates to 0.25% and announcing two or three more hikes this year. Governor Ingves on Tuesday said there will be “a super focus” on the April reading. He added there are no technical limitations to a 50 bps hike but it wasn’t something to “in front of [them] at the moment”. But with April inflation already surpassing the bank’s projections, this might have just changed. The Swedish crown outperforms Scandinavian peers today. EUR/SEK weakens to 10.55.
GBP/JPY Mid-Day Outlook
Daily Pivots: (S1) 158.25; (P) 159.79; (R1) 160.73; More...
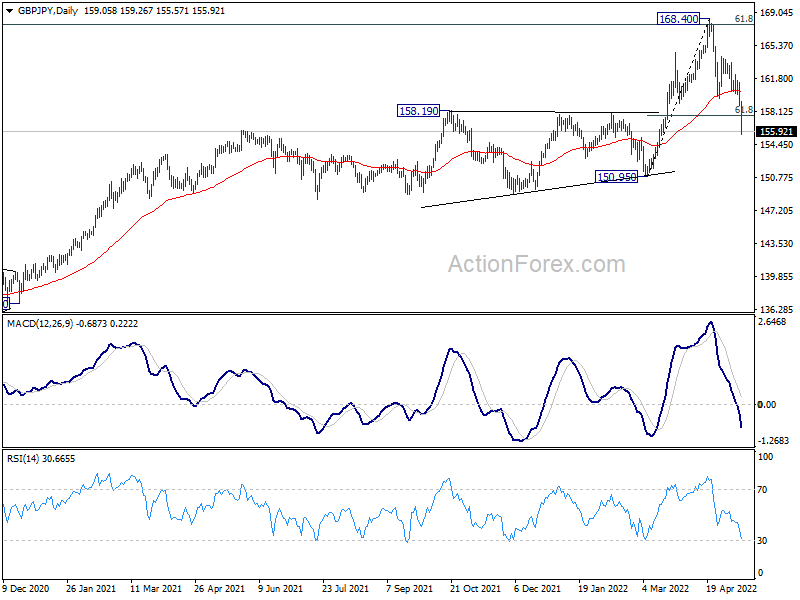
GBP/JPY's fall accelerates to as low as 155.57 so far, powering through 61.8% retracement of 150.95 to 168.40 at 157.61. There is no sign of bottoming and intraday bias stays on the downside for 150.95 key structural support next. For now, risk will stay on the downside as long as 161.28 resistance holds in case of recovery.
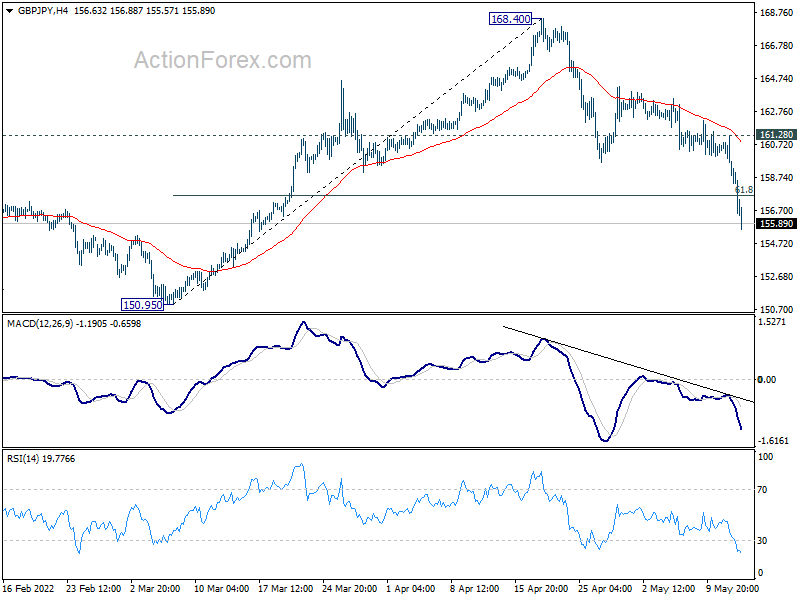
In the bigger picture, up trend from 123.94 (2020 low) is still in progress. Sustained break of 61.8% retracement of 195.86 (2015 high) to 122.75 (2016 low) at 167.93 will be a long term bullish signal, and could pave the way back to 195.86 high. This will now remain the favored case as long as 150.95 support holds, even in case of deep pull back. However, firm break of 150.95 will indicate rejection by 167.93, and bearish trend reversal.
EUR/JPY Mid-Day Outlook
Daily Pivots: (S1) 136.00; (P) 136.85; (R1) 137.53; More....
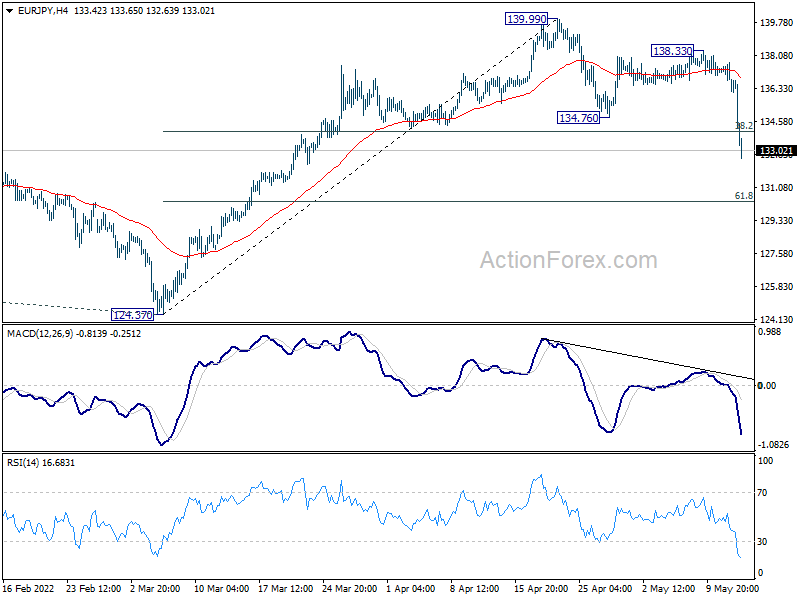
EUR/JPY's corrective fall from 139.99 resumes today, by powering through 134.76 support, as well as 38.2% retracement of 124.37 to 139.99 at 134.02. Intraday bias is back on the downside. Deeper fall could be seen to 61.8% retracement at 130.33. For now, risk will stay on the downside as long as 138.33 resistance holds, in case of recovery.
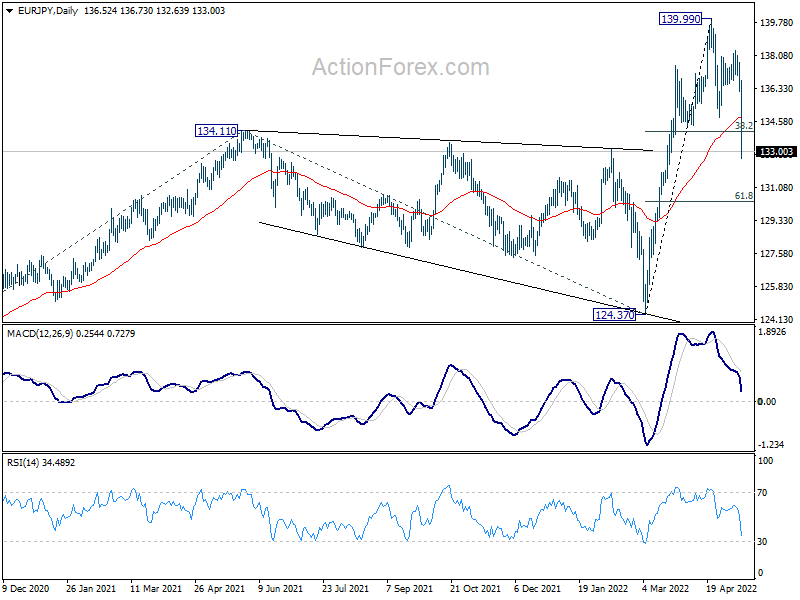
In the bigger picture, up trend from 114.42 (2020 low) is in progress. Such rise is seen as the third leg of the pattern from 109.30 (2016 low). Next target will be 100% projection of 114.42 to 134.11 from 124.37 at 144.06. In any case, outlook will now remain bullish as long as 124.37 support holds, in case of deep pull back.
EUR/GBP Mid-Day Outlook
Daily Pivots: (S1) 0.8542; (P) 0.8568; (R1) 0.8611; More...
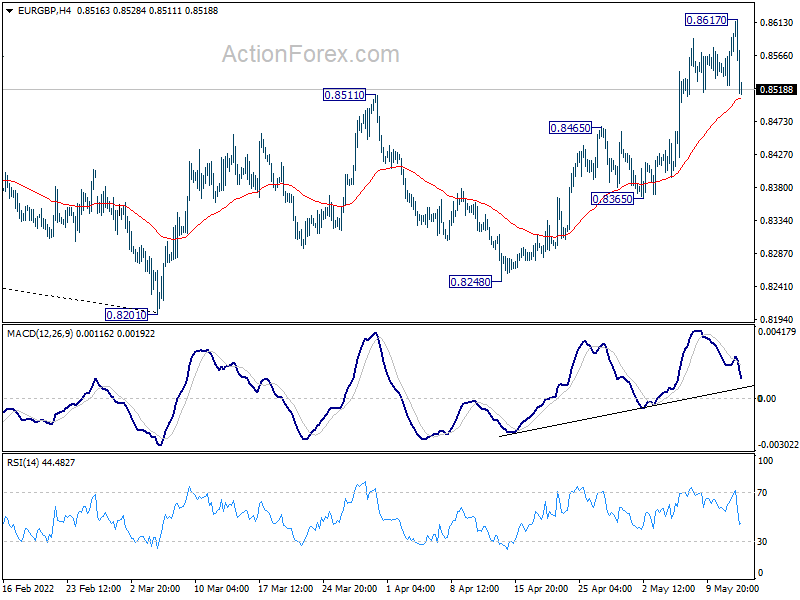
A short term top could be in place at 0.8617 with current retreat. Intraday bias is mildly on the downside for deeper pull back to 0.8465 support turned resistance. But overall, rise from 0.8201 is still in favor to continue as long as 0.8365 support holds. Break of 0.8617 will resume such rise to 0.8697 medium term fibonacci level.
In the bigger picture, a medium term bottom could be in place at 0.8201, on bullish convergence condition in daily and weekly MACD. Rise from there could either be a correction to the down trend from 0.9499 (2020 high), or a medium term up trend itself. In either case, further rise should be seen to 38.2% retracement of 0.9499 to 0.8201 at 0.8697. Sustained break there will target 61.8% retracement at 0.9003.
The Crypto Market’s House of Cards
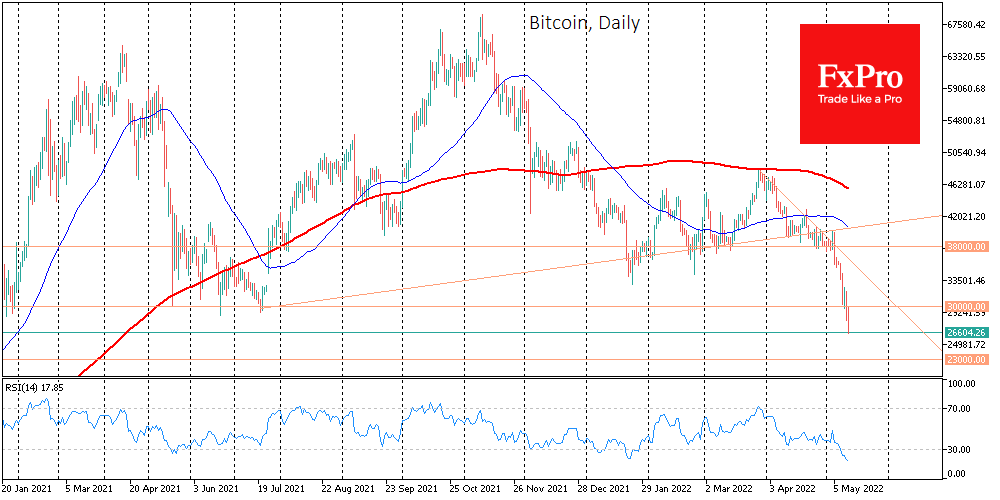
Bitcoin collapsed 8.4% on Wednesday, ending the day at around $28.4K. Thursday’s fall continued, sending the first cryptocurrency down 5% to $27K. Ethereum is down 24% in the last 24 hours, having rolled back to $1815. Other leading altcoins in the top 10 have fallen in price from 6% (Tron) to 37% (Solana).
Total crypto market capitalisation, according to CoinMarketCap, fell 19.4% overnight to $1.14 trillion. Bitcoin’s dominance index jumped 2.5 percentage points to 44.7% due to the altcoin sell-off.
Bitcoin resumed its decline on Wednesday, but it outperformed the stock market with considerable amplitude this time. Perhaps even pulling it down. BTC broke through last July’s lows and tested lows in late December 2020, just above $26.5K.
Altcoin fell sharply on the back of Terra (LUNA), losing 96% in just one day on UST’s (project’s stable coin) drawdown. Despite its declared peg to the US dollar, the Terra ecosystem’s algorithmic stablecoin, UST itself, continued to lose value on Wednesday. Worth $1 as recently as the beginning of the week, UST fell to $0.30. According to The Block, Luna Foundation Guard’s (LFG) attempts to stabilise the UST stablecoin have failed.
Now the attention of crypto market participants and confidence in stable coins. Tether is the most traded stablecoin with a daily turnover double that of Bitcoin – 2% below the dollar as capital outflows continue to push it in one direction.
Stablecoin’s volatility is a new reality for the crypto market. Previously, investors preferred to park capital in stable currencies, exiting altcoins and withdrawing it from cryptocurrencies. We see a full-fledged exodus from the sector, and the entire crypto market is crumbling like a house of cards.
Adding fuel to the fire, the US Federal Reserve has published its semi-annual Financial Stability Report, highlighting the risks of using stable coins. Democrats on the US Senate Banking Committee have proposed increased oversight of cryptocurrencies, including stable coins.
According to CryptoQuant, hodlers have sold some of their bitcoins. Investors holding BTC for more than a year have been taking it to exchanges to sell over the past month.
The CEO of cryptocurrency exchange Kraken, Jesse Powell, said he would like to see bitcoin fall to $20,000. He would allocate the lion’s share of his capital to buying BTC in this case.
Oil Falls Out of Uptrend
Crude oil must balance between a strengthening dollar and stock market pressure on the one hand and the problematic energy supply situation on the world markets on the other. In our opinion, this delicate equilibrium has the potential to break in the coming days, and downside risks prevail in this case.
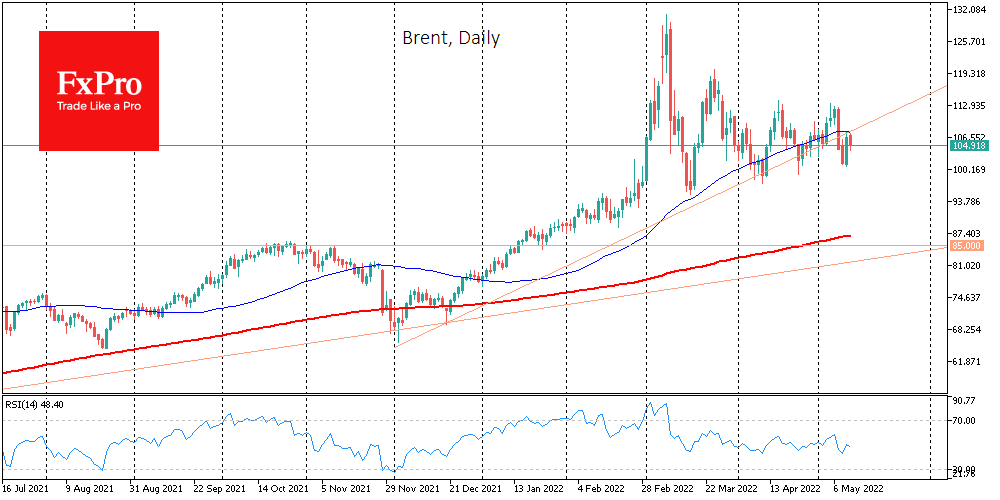
The dollar rally squeezes capital from other assets, from developed currencies and equities to cryptocurrencies. Crude oil, meanwhile, has been trading in a roughly 20% range for the past nine weeks, although historically, it has played out with great amplitude on lower demand for risky assets and traction in the dollar.
Last week’s increase in US commercial stocks outweighed the decline in the Strategic Petroleum Reserve. This trend could continue in the near term as demand growth has slowed recently.
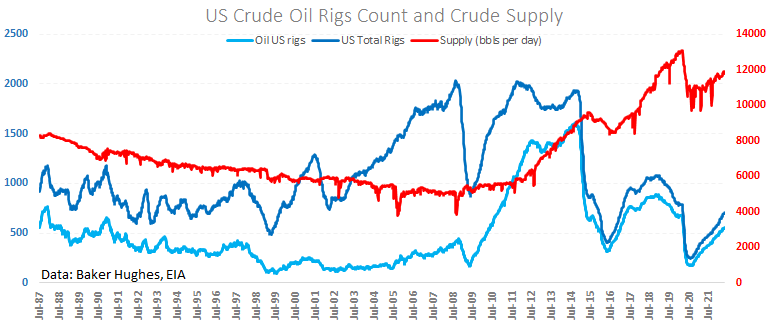
Although US oil producers reduced production to 11.8m BPD from 11.9m BPD last week, they continue to ramp up drilling activity, which promises more oil in the second half of the year. This desire to postpone production “for tomorrow” is easily explained by Biden’s announcement that the government will top up reserves from August.
OPEC countries have also failed to keep up with the quota increases, meeting the deal at 162% of their allotted quotas and increasing the backlog of potentially permissible levels.
The price chart clearly shows that we are now seeing a desperate attempt to cling to former uptrend support and return to levels above the 50-day average. Locally, the bears are showing their strength by reversing the oil down from those levels on Thursday before the start of active trading in the US. This seller’s attack should largely be attributed to the dollar updating its highs against its main competitors and a full-blown risk-off in the markets.
However, having fallen out of the recent uptrend, the oil may never return to it in the foreseeable future.
USD/JPY Mid-Day Outlook
Daily Pivots: (S1) 129.35; (P) 130.08; (R1) 130.71; More...
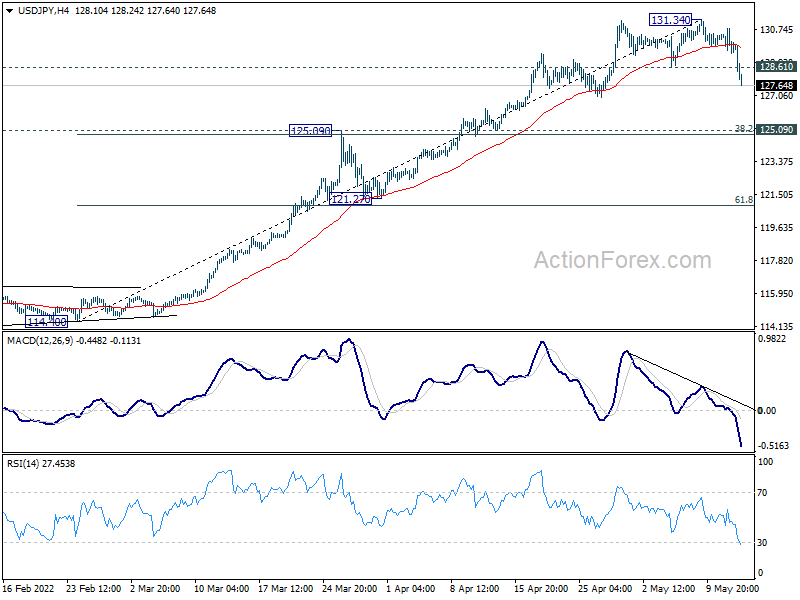
USD/JPY's break of 128.61 support confirms that a short term top is at least formed at 131.34. Intraday bias is back on the downside to 125.09 cluster support (38.2% retracement of 114.40 to 131.34 at 124.86), as correction to rise from 114.40. For now, risk will stay mildly on the downside as long as 131.34 resistance holds, in case of recovery.
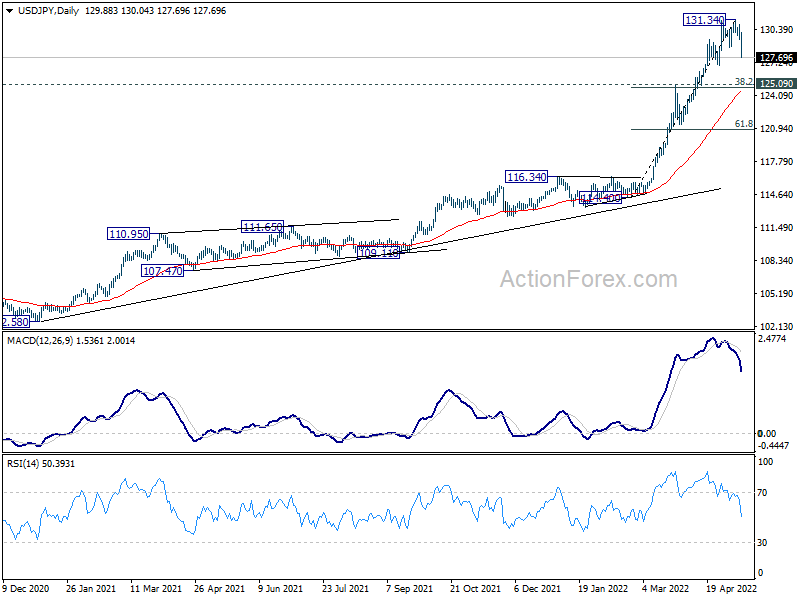
In the bigger picture, current rally is seen as part of the long term up trend form 75.56 (2011 low). Sustained trading above 61.8% projection of 75.56 (2011 low) to 125.85 (2015 high) from 98.97 at 130.04 will pave the way to 100% projection at 149.26, which is close to 147.68 (1998 high). For now, this will remain the favored case as long as 121.27 support holds.
USD/CHF Mid-Day Outlook
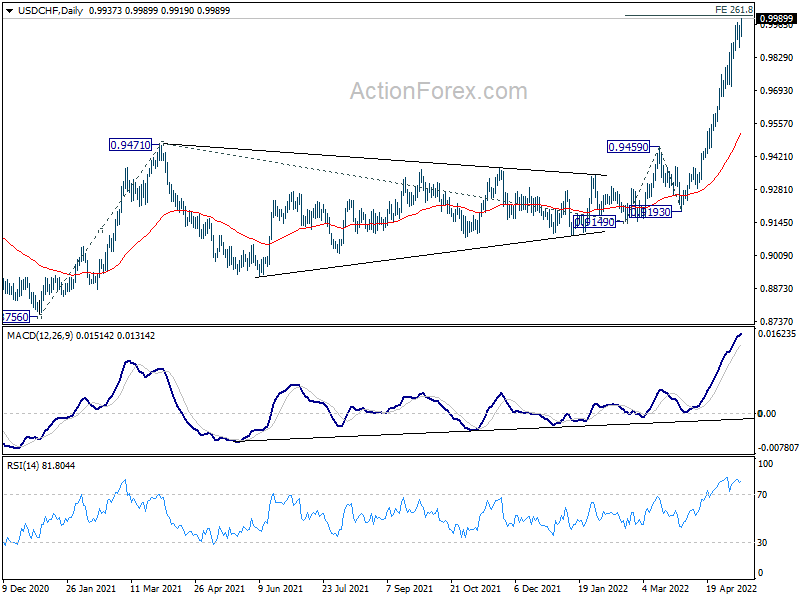
Daily Pivots: (S1) 0.9887; (P) 0.9925; (R1) 0.9979; More....
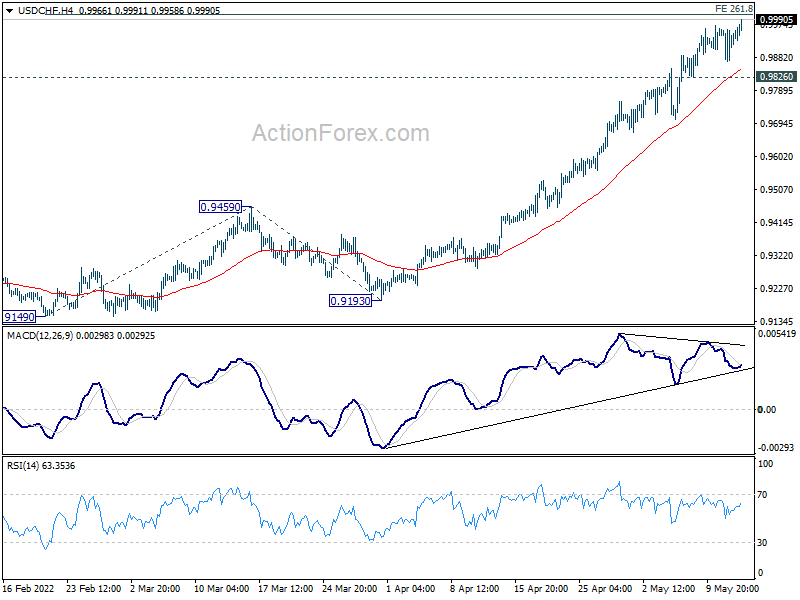
USD/CHF's rally is still in progress for 261.8% projection of 0.9149 to 0.9459 from 0.9193 at 1.0005. Considering bearish divergence condition in 4 hour MACD, upside could be limited there to bring correction. On the downside, break of 0.9826 will indicate short term topping, and turn bias to the downside for pull back. However, sustained break of 1.0005 will pave the way to next medium term projection level at 1.0306.
In the bigger picture, down trend from 1.0342 (2016 high) should have completed with three waves down to 0.8756 (2021 low) already. Rise from 0.8756 is likely a medium term up trend of its own. Next target is 161.8% projection of 0.8756 to 0.9471 from 0.9149 at 1.0306, which is close to 1.0342 (2016 high). This will remain the favored case as long as 0.9459 resistance turned support holds.