Sample Category Title
Technical Outlook and Review
DXY:
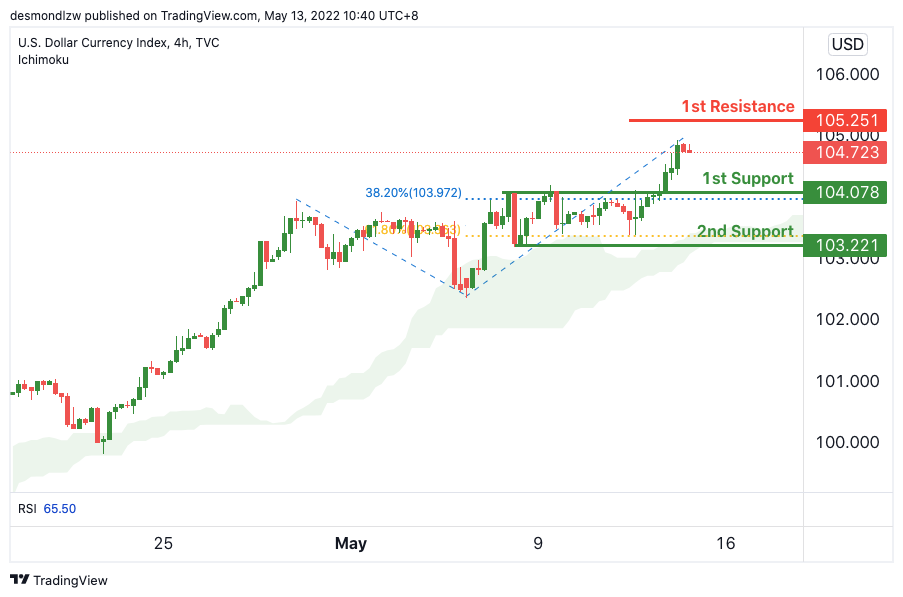
On the H4, with price expected to reverse off the stochastics indicator, we have a bearish bias that price will drop from our 1st resistance in line with the swing high resistance to our 1st support where the swing low support is. Alternatively, price may break 1st resistance structure and head for 2nd resistance where the 127.2% Fibonacci extension is.
Areas of consideration:
- H4 time frame, 1st resistance at 103.989
- H4 time frame, 1st support at 103.221
XAU/USD (GOLD):
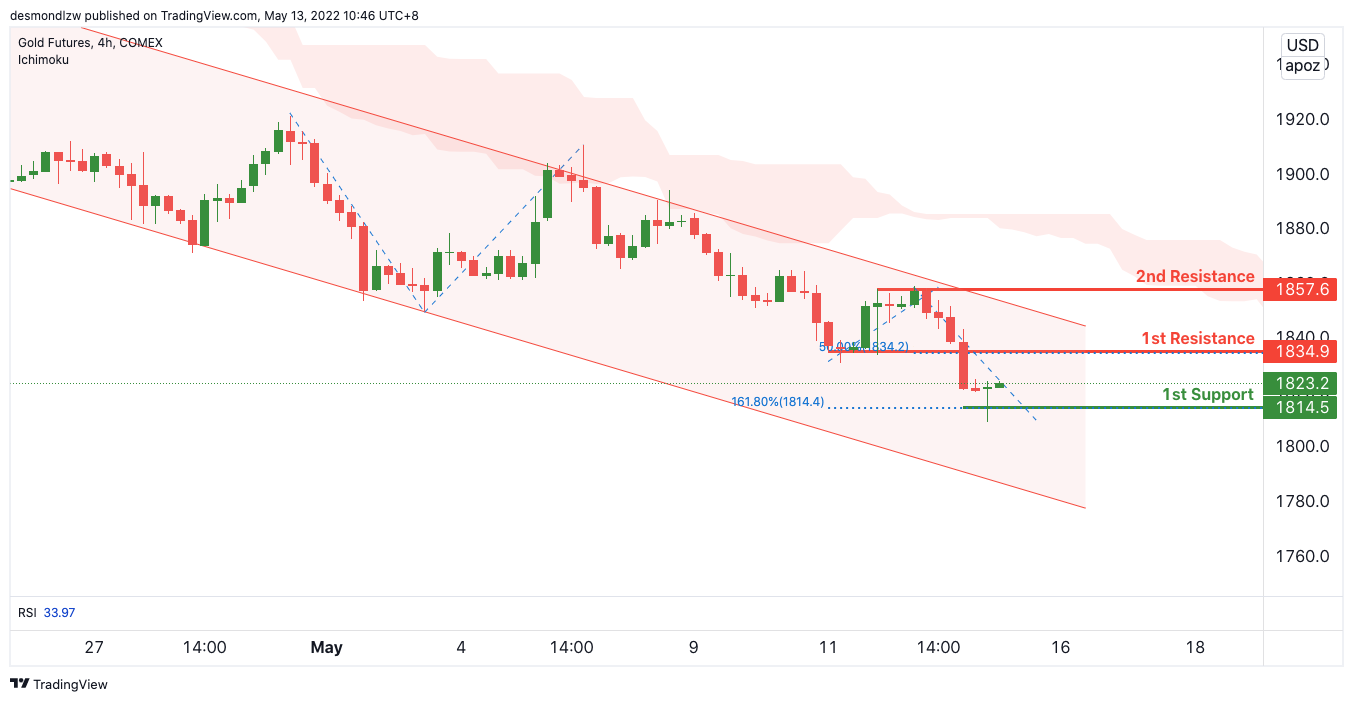
On the H4, with price moving below the ichimoku, we have a bearish bias that price will drop from our 1st resistance at 1869 where the horizontal pullback resistance is to our 1st support at 1834 in line with the swing low support. Alternatively, price may break 1st resistance structure and head for 2nd resistance where the horizontal pullback resistance is.
Areas of consideration:
- H4 time frame, 1st Resistance at 1869
- H4 time frame, 1st Support at 1834
GBP/USD:
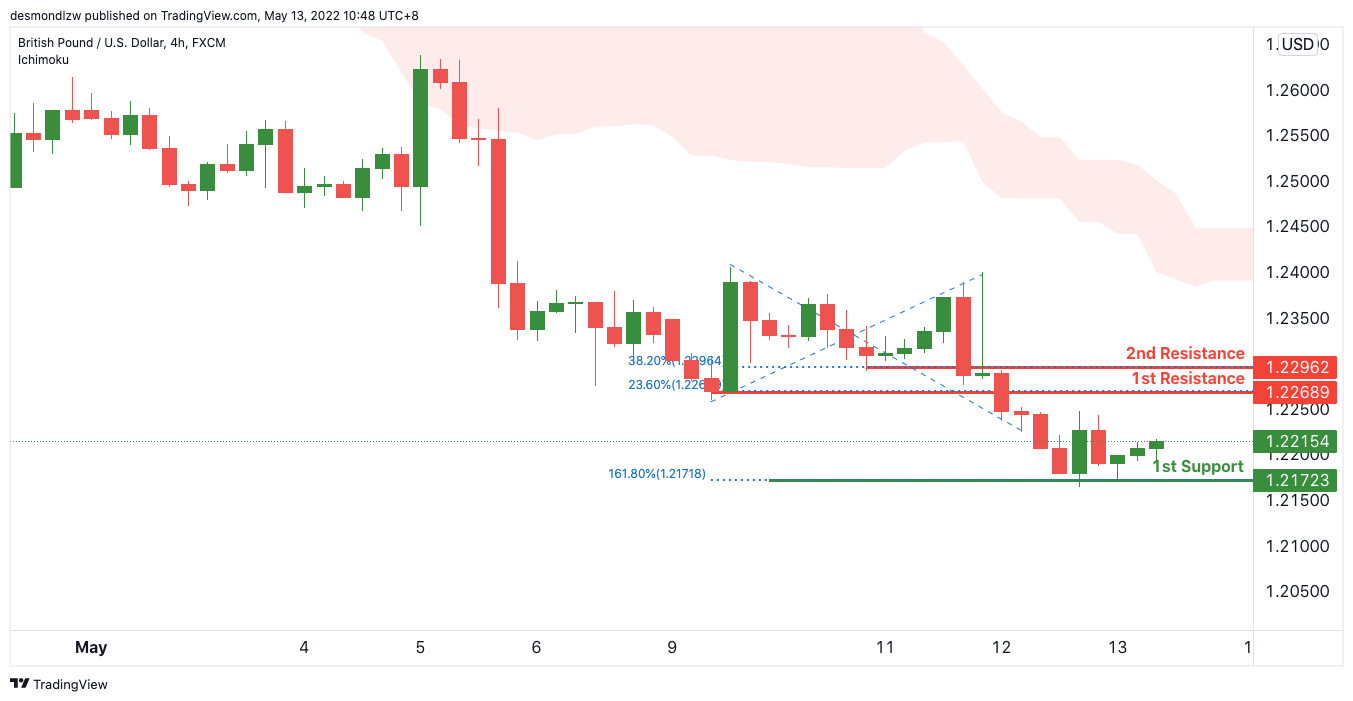
On the H4, with price moving below the ichimoku, we have a bearish bias that price will drop from our 1st resistance at 1.22689 where the 23.6% Fibonacci retracement and pullback resistance is to our 1st support at 1.21723 in line with the 161.8% Fibonacci extension. Alternatively, price may break 1st resistance structure and head for 2nd resistance where the horizontal pullback resistance is.
Areas of consideration:
- H4 1st resistance at 1.22689
- H4 1st support at 1.21723
USD/CHF:
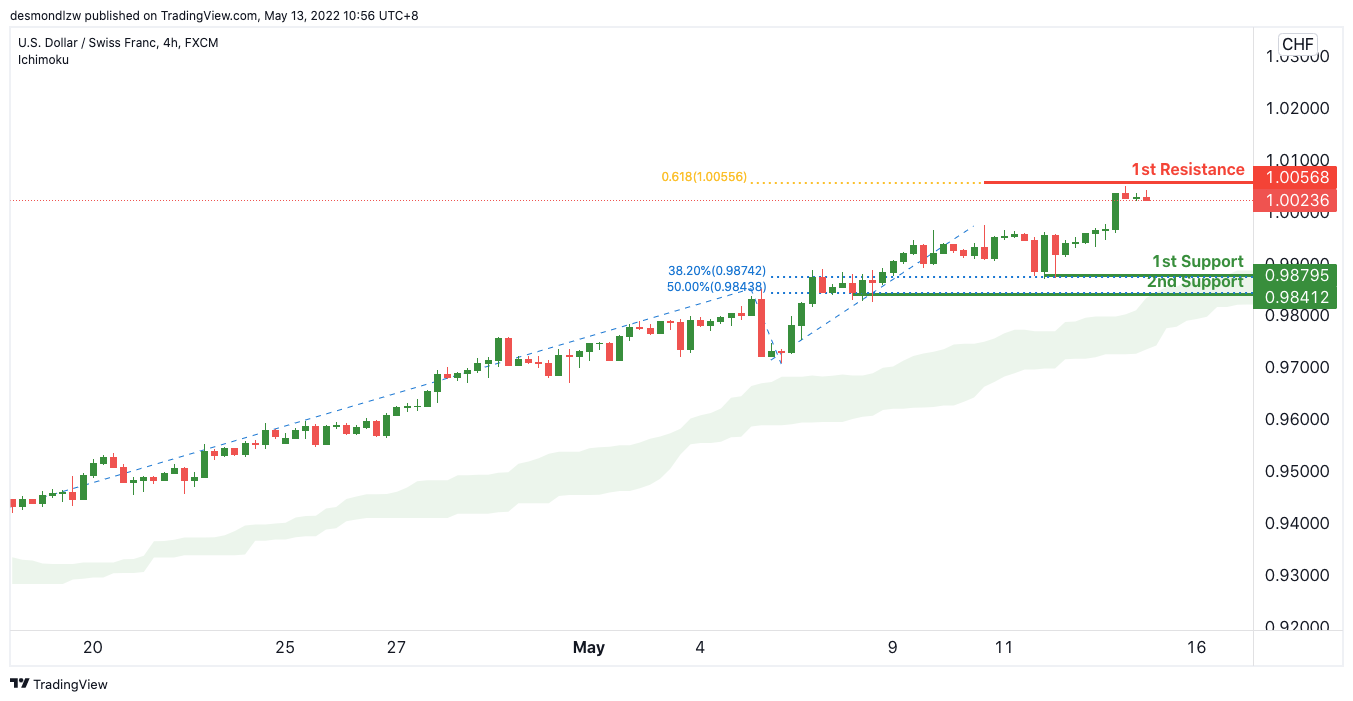
On the H4, with price moving above the ichimoku cloud, we have a bullish bias that price will rise to our 1st resistance at 1.00568 where the61.8% Fibonacci projection is from our 1st support at 0.98412 in line with the horizontal swing low support. Alternatively, price may break 1st support structure and head for 2nd support where the horizontal swing low support is.
Areas of consideration
- 1st support level at 0.98412
- 1st resistance level at 1.00568
EUR/USD :
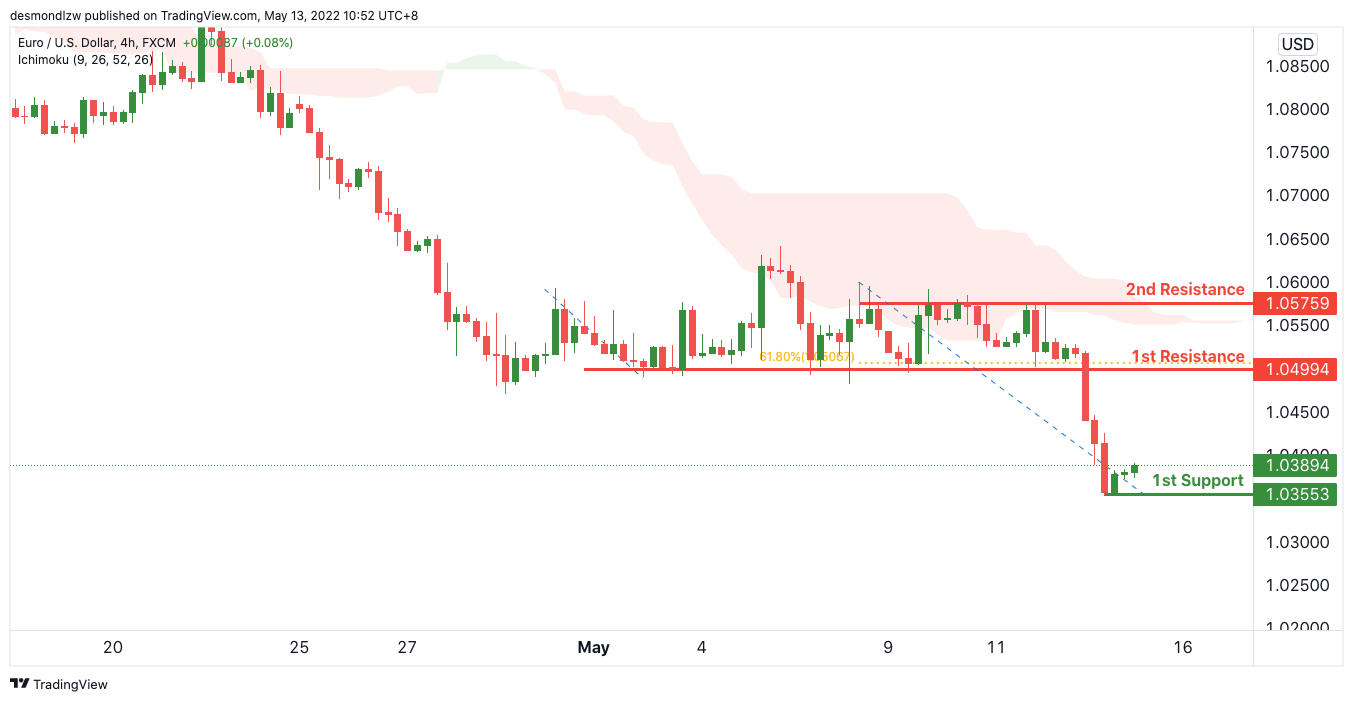
On the H4, with price expected to bounce off the stochastics indicator, we have a bullish bias that price will rise to our 1st resistance at 1.05791 where the swing high resistance is from our 1st support at 1.04994 in line with the horizontal swing low support. Alternatively, price may break 1st support structure and head for 2nd support where the 127.2% Fibonacci extension is.
Areas of consideration :
- H4 1st resistance at 1.05791
- H4 1st support at 1.04994
USD/JPY:
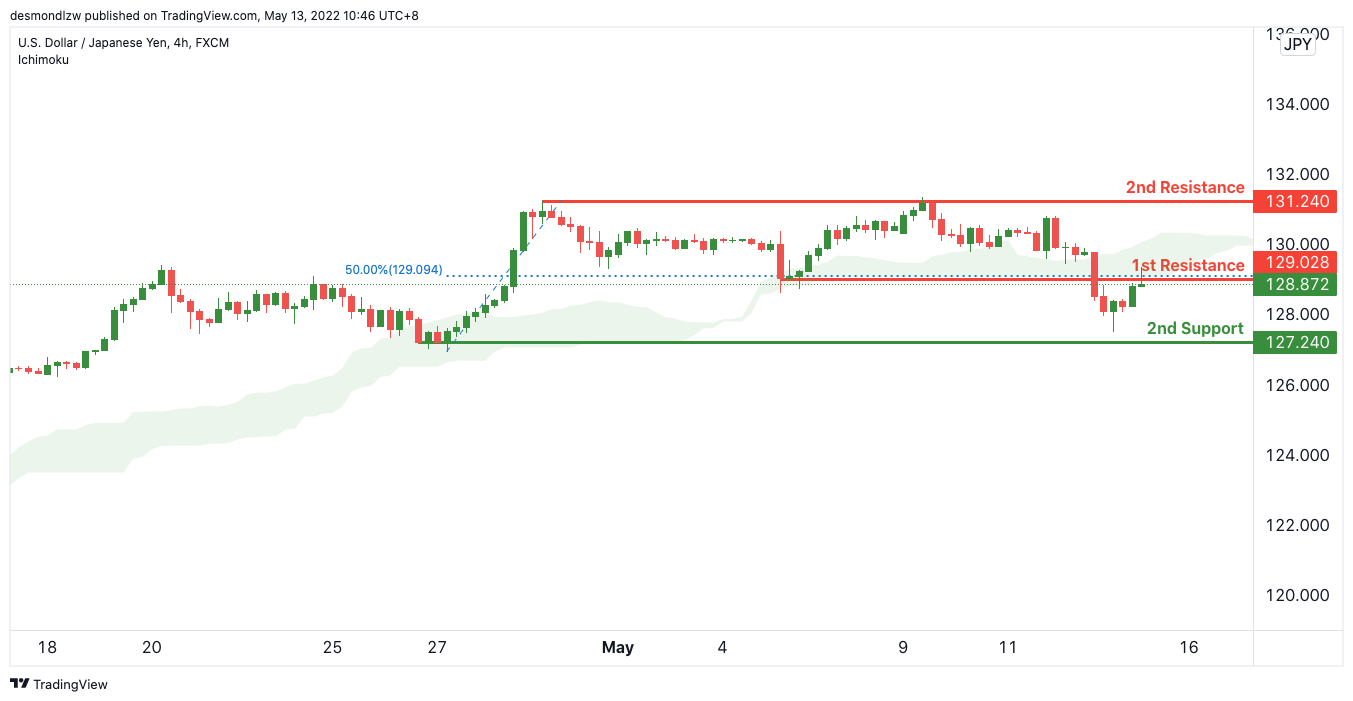
On the H4, with price moving above the ichimoku cloud, we have a bullish bias that price will rise to our 1st resistance at 131.240 where the swing high resistance is from our 1st support at 129.028 in line with the horizontal swing low support. Alternatively, price may break 1st support structure and head for 2nd support where the horizontal swing low support is.
Areas of consideration:
- H4 time frame, 1st resistance at 131.240
- H4 time frame, 1st support at 129.028
AUD/USD:
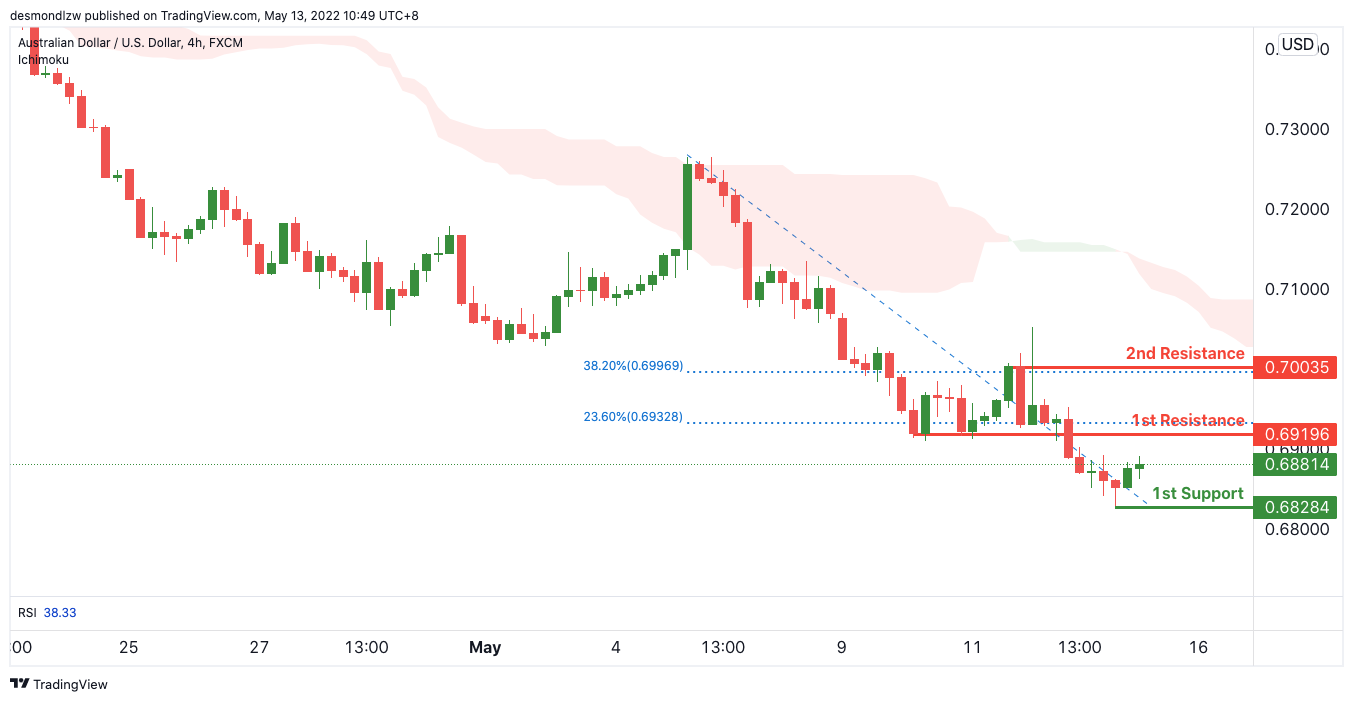
On the H4, with price moving below the ichimoku, we have a bearish bias that price will drop from our 1st resistance at 0.70354 where the pullback resistance is to our 1st support at 0.68805 in line with the 61.8% Fibonacci projection and 161.8% Fibonacci extension. Alternatively, price may break 1st resistance structure and head for 2nd resistance where the horizontal pullback resistance is.
Areas of consideration
- H4 1st resistance at 0.70354
- H4 1st support at 0.68805
NZD/USD:
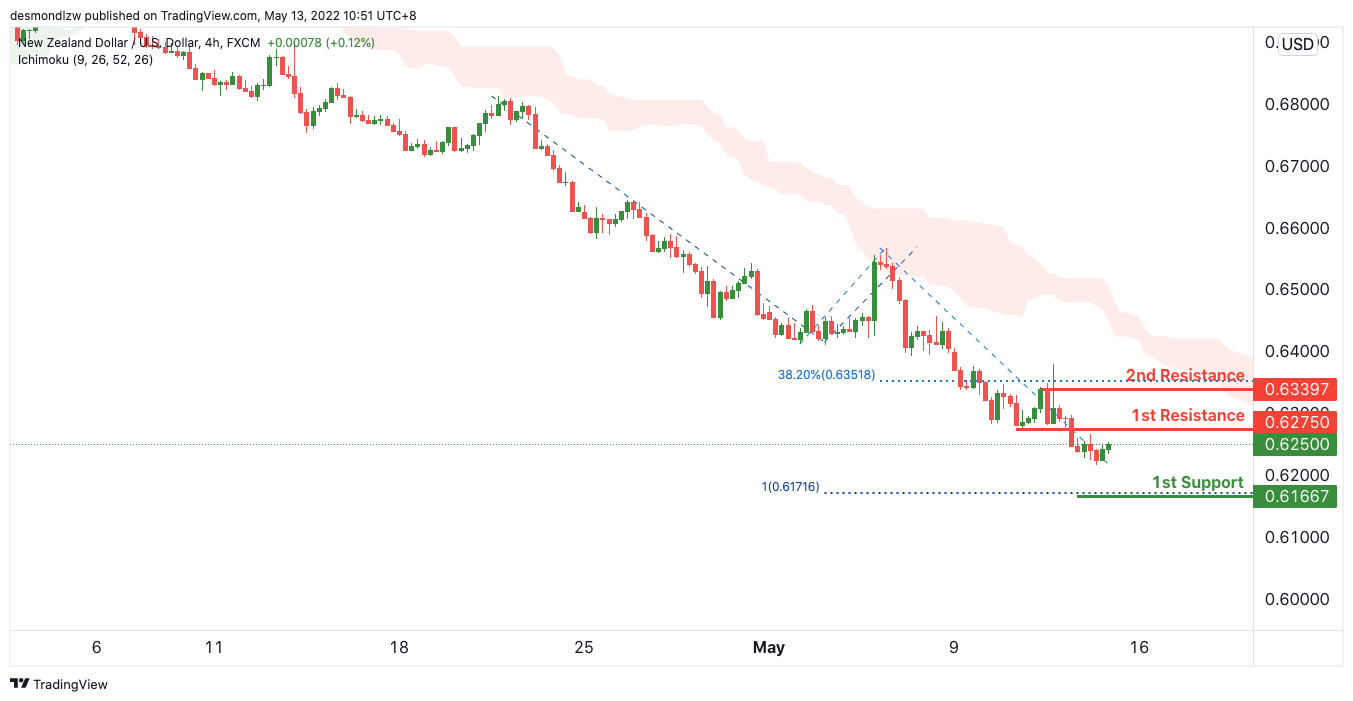
On the H4, with price moving below the ichimoku cloud, we have a bearish bias that price will drop from our 1st resistance at 0.63986 where the 23.6% Fibonacci retracement is to our 1st support at 0.62579 in line with the 200% Fibonacci projection. Alternatively, price may break 1st resistance structure and head for 2nd resistance.
Areas of consideration:
- H4 time frame, 1st support at 0.62579
- H4 time frame, 1st resistance at 0.63986
USD/CAD:
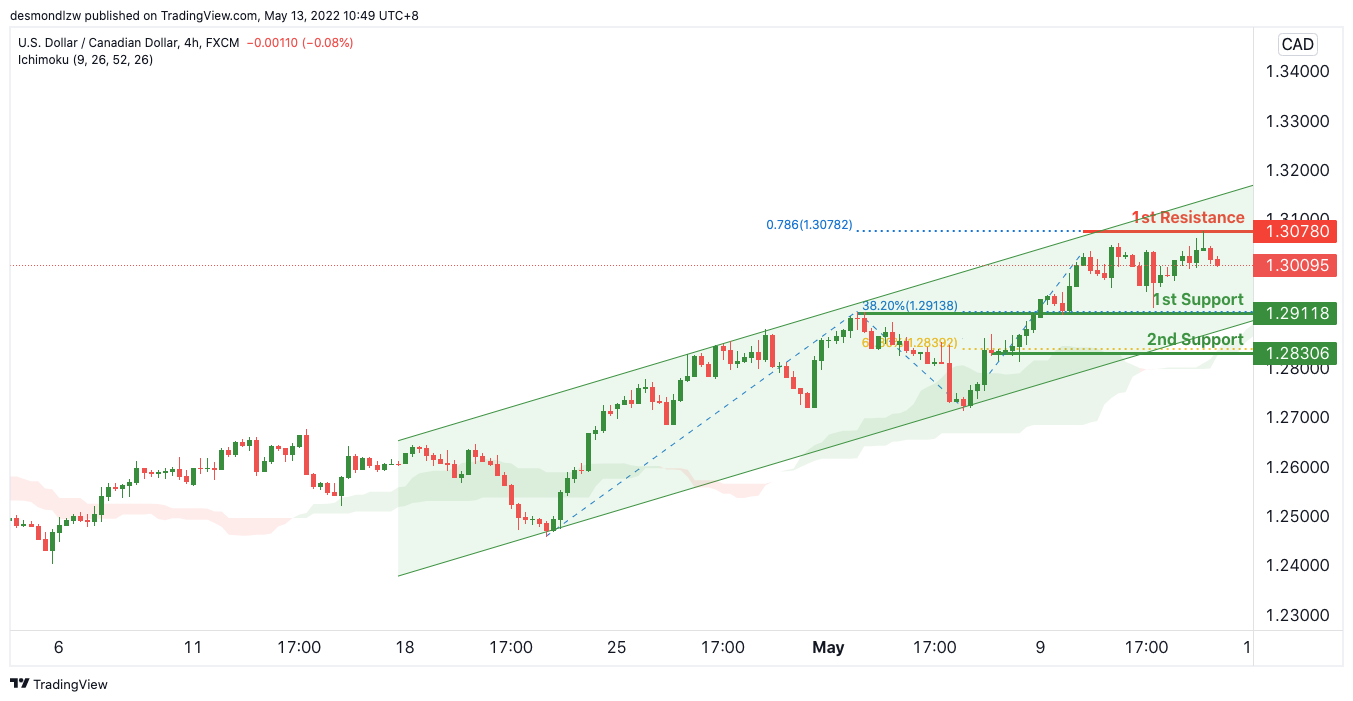
On the H4, with price moving above the ichimoku cloud, we have a bullish bias that price will rise to our 1st resistance at 1.30780 where the 78.6% Fibonacci projection is from our 1st support at 1.29118 in line with the horizontal pullback support. Alternatively, price may break 1st support structure and head for 2nd support where the horizontal pullback support is.
Areas of consideration:
- H4 time frame, 1st resistance at 1.30780
- H4 time frame, 1st support at 1.29118
OIL:
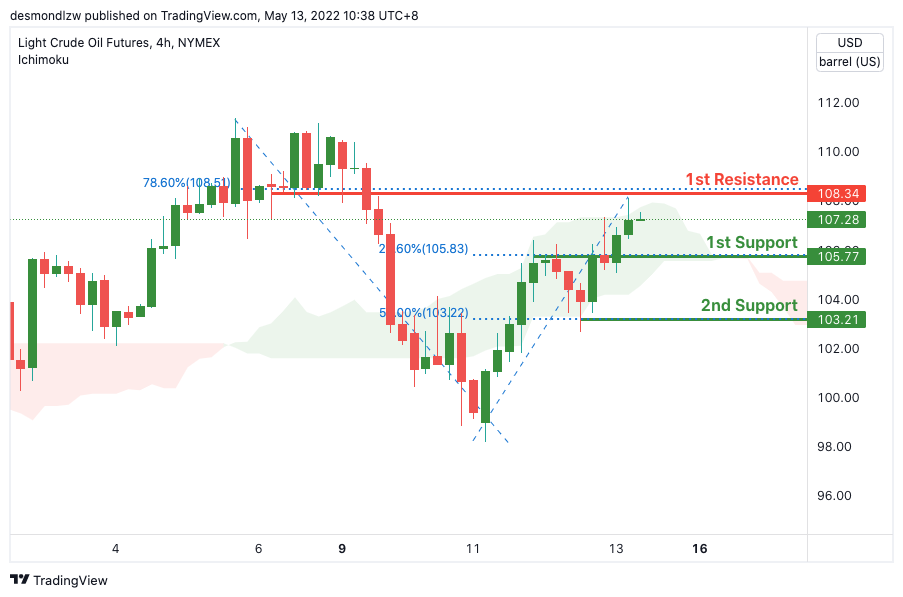
On the H4, with price expected to reverse off the ichimoku cloud, we have a bearish bias that price will drop from our 1st resistance at 105.86 where the 61.8% Fibonacci retracement is to our 1st support at 103.01 in line with the 38.2% Fibonacci retracement. Alternatively, price may break 1st resistance structure and head for 2nd resistance where the horizontal pullback resistance.
Areas of consideration:
- H4 time frame, 1st resistance of 105.86
- H4 time frame, 1st support of 103.01
Dow Jones Industrial Average:
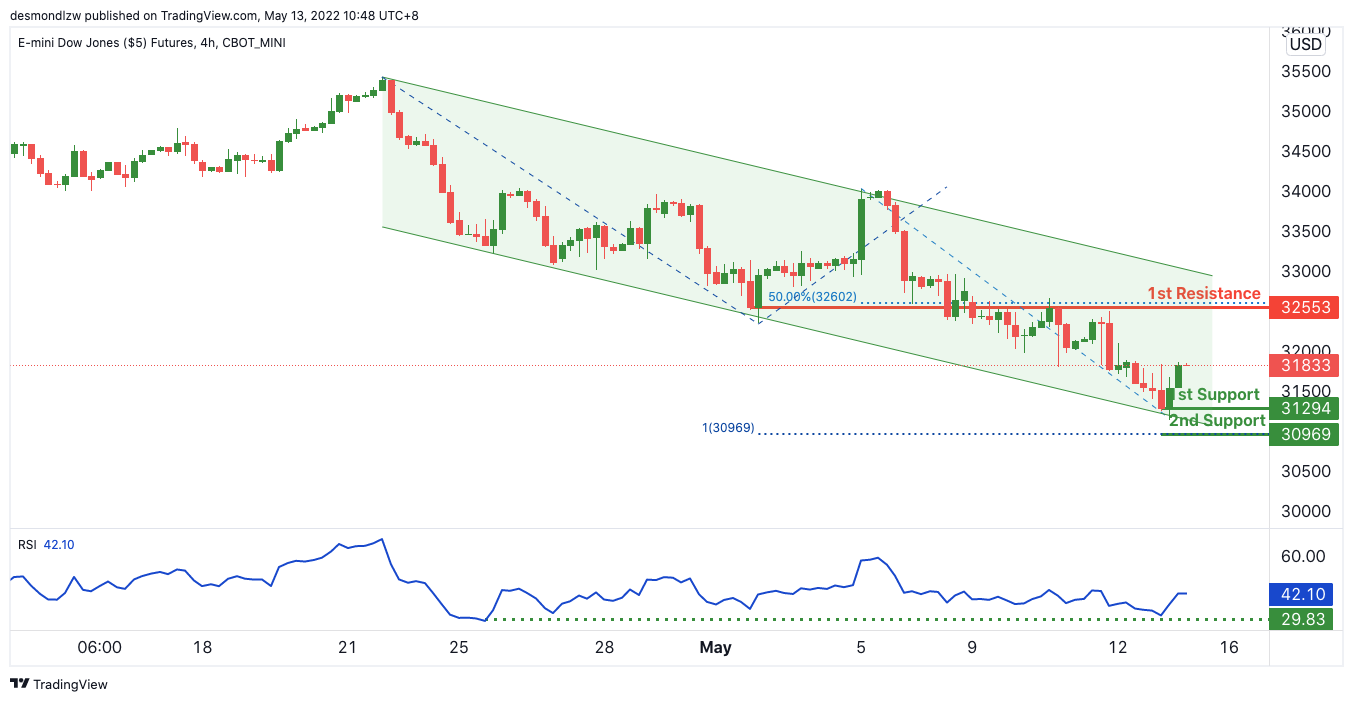
On the H4, with price expected to bounce off the stochastics indicator, we have a bullish bias that price will rise to our 1st resistance at 32553 where the swing high resistance is from our 1st support at 31753 in line with the horizontal swing low support. Alternatively, price may break 1st support structure and head for 2nd support where the 161.8% Fibonacci extension is.
Areas of consideration :
- H4 time frame, 1st resistance at 32553
- H4 time frame, 1st support at 31753
Fed Powell: Appropriate for 50bps increases at the next two meetings
Fed Chair Jerome Powell said in an interview that "what we were actively considering, and this is just a factual recitation of what happened at the meeting, was a 50-basis point increase... if the economy performs about as expected, that it would be appropriate for there to be additional 50-basis point increases at the next two meetings".
Powell also said that a "soft landing", getting back to 2% inflation while keeping the labor market strong, is "quite challenging to accomplish that right now". Unemployment is "very, very low", the labor market's "extremely tight", and inflation is "very high".
"What we can control is demand, we can't really affect supply with our policies. And supply is a big part of the story, here. But more than that, there are huge events, geopolitical events going on around the world, that are going to play a very important role in the economy in the next year or so. So the question whether we can execute a soft landing or not, it may actually depend on factors that we don't control," he explained.
Fed Daly: Going up in 50bps increments makes quite a bit of sense
San Francisco Federal Reserve President Mary Daly said yesterday she'd like to Would like to see continued tightening of financial conditions to help bring down inflation. Yet, 75bps rate hike is "not a primary consideration".
"Going up in 50-basis-point increments to me makes quite a bit of sense and there's no reason right now that I see in the economy to pause on doing that in the next couple of meetings," she added.
BoC Gravelle: We need higher interest rates, the economy can handle it
BoC Deputy Governor Toni Gravelle said yesterday, "our policy rate, at 1%, is too stimulative, especially when inflation is running significantly above the top of our control range. We need our policy rate to be at more neutral levels."
"Simply put, with demand running ahead of the economy's capacity, we need higher interest rates to cool domestic inflation. And as we've said before, the economy can handle it," he said.
Still he noted that outlook remained unusually uncertain and therefore it's not easy to hike by 75bps in one go.
Cliff Notes: Battling Uncertainty the World Over
Key insights from the week that was.
Confidence in the economy (and financial instruments) has been a key talking point for markets this week.
For Australia’s business sector, NAB’s April survey showed a decline in confidence in the month despite a further pick up in conditions to a level materially above average. This confidence measure is still best considered consistent with a generally positive mood amongst business however, despite global risks – which escalated in May – and the additional uncertainty created by a Federal election.
From the conditions detail, the re-opening of Australia’s economy is clearly a big positive and is expected to remain that way with forward orders continuing to show strength. However, of concern is that upstream price pressures and labour costs hit new record highs in the month, highlighting the lasting consequence of the pandemic on global goods supply and migration to Australia – for an update on the latter, see below.
Rolling forward a month and across to the household sector, our May Westpac-MI consumer sentiment report made for sombre reading, a 5.6% fall in the month leaving the index at just 90.4. This is the lowest reading since August 2020, when households were concerned over Victoria’s second-wave lockdown, and is also 8.4% below the average of 2019, when consumer spending was essentially flat over the year.
This pronounced deterioration in sentiment stems from the dramatic rise in Australian inflation to March 2022 and the RBA’s response to this development – May’s 25bp rate hike. Consumers are anticipating both of these headwinds will have a lasting effect on their finances, with views on family finances for the year ahead down 11% in the month to be 13% below average. Also note, ‘time to buy a major household item’ is now 27% below average, having falling 6% in May.
As detailed by Chief Economist Bill Evans in his video update, some of the biggest moves seen recently in the survey relate to housing. ‘Time to buy a dwelling’ is 25% lower than a year ago and 34% below average. House price expectations are similarly 26% lower than a year ago, albeit only 4% below average. Westpac continues to expect a 13% decline in capital city house prices from mid-2022 to mid-2024; a full discussion of the sector’s outlook was included in the team’s latest Market Outlook in conversation podcast.
April’s arrivals and departures meanwhile reported an acceleration (+200.9k and +275.8k respectively), pointing to strong momentum in the recovery of overseas travel. The component detail for March showed a doubling of short-term visitor arrivals over the month to 162k. On departures, Australian residents leaving on a long-term basis reached a series high at nearly 61k – reflecting the pent-up demand for overseas travel/work, likely among young Australians. Given that New Zealand represents the largest source of monthly foreign arrivals, New Zealand’s full reopening by end-July is a welcome sign that Australia-NZ travel should return to normal operations quickly.
Offshore, the primary data release of the week was April’s US CPI. The headline inflation result was more or less in keeping with expectations, the monthly pulse falling from 1.2% to 0.3%. However, the core CPI (excludes food and energy) was materially above expectations at 0.6% (consensus 0.3%), supporting fears of persistently high inflation.
Nonetheless, it is clear US inflation is slowing. Taken together, March and April imply an annualised inflation pulse of 5.5%, down from 7.0% in the five months to February, and 10% at this time a year ago. Further, looking at the component detail of the CPI basket, it is evident the imbalances caused by the pandemic are abating, with fiscal support for demand long past and the supply-side recovering.
With annualised core inflation still a multiple of the FOMC’s 2.0%yr target however, there is a long way to go in resolving the US’ inflation concerns. A wealth effect is unlikely to slow demand and inflation hence, but the hit to real incomes from inflation should. In our view, it is likely to take until late-2023 for real incomes to recover the losses of the past year. By that time, remaining supply-side concerns related the pandemic and Russia’s invasion of Ukraine should have abated, while 2022’s abrupt tightening of financial conditions will, by then, have had a year to impact. With inflation risks having subsided, the FOMC will be able to cut the fed funds rate back to 2.125% in 2024 to maintain growth near potential and a robust labour market into the medium-term.
The most significant risks to this view are a further escalation of global tensions which feed into inflation and wage expectations. And/or a doubling down by the FOMC or market on the outlook for rates, tightening financial conditions to an outright contractionary level. The possibility of the latter was flagged this week by the US 10yr falling back to 2.85% having run up to 3.20% following the FOMC and Bank of England meetings last week.
Increasingly it seems the risks the US faces may become the baseline expectation for the UK and Europe, with both central banks increasingly intent on raising interest rates despite growth looking as though it has stalled and will remain weak for an extended period. While UK GDP growth in Q1 overall was robust at 0.8%, the monthly data shows an abrupt change in the economy over the period, a 0.7% gain in January followed by no growth in February and a 0.1% decline in March.
This deterioration makes the uncertainty highlighted last week by the Bank of England for late-2022 and 2023 immediate, and also emphasises how skewed to the downside the risks have become. Like the US, real incomes in the UK have been hit hard; unlike the US, there is another wave of pain to come as higher wholesale energy prices feed through to the consumer and the labour market deteriorates.
The data flow for Europe has been very light this week, but a number of regional monetary policy officials including ECB President Lagarde have continued to raise concerns over inflation and the appropriateness of the ECB’s policy stance. Consensus at the ECB is often difficult to gauge, particularly in periods of heightened uncertainty; but an end of asset purchases in June now seems highly probable. It also seems a growing group of Governing Council members want rate hikes to follow quickly.
Arguably, the initial step of returning the deposit rate to zero from -0.50% could prove neutral (or even positive) for the economy as long as a succession of additional refi rate hikes are not expected immediately after. So, absent a clear decline in activity in Q2 data, we now look for the ECB to move the deposit rate back to zero in Q3. We still believe best policy would be to leave refi rate hikes to 2023, but the intent of the Council looks instead to be a move to 0.25% at the December meeting assuming contraction is avoided in Q3.
With inflation coming down quickly through 2023, additional rate hikes are likely to be limited to another 50bps, allowing activity growth to recover quickly. For the Bank of England, we believe it would be best to similarly limit their response to inflation to minimise the cumulative impact on activity and the labour market. A peak in the Bank Rate of 1.75% continues to be forecast.
These developments and the risks have weighed heavily on Euro and Sterling in recent weeks, seeing spot trade at USD1.04 and USD1.22 respectively overnight. However, we continue to see a move higher to year end for both currencies as risks abate with respect to inflation and the policy response as well as the conflict itself. A slowing US economy with reduced inflation risk should further support this trend. Full detail on our long-term forecasts can be found on Westpac IQ.
Oil Report: Can We Afford to Exclude Russia from the Oil Game?
WTI prices continued to move in a rather tight range for the past several weeks, indirectly displaying some uncertainty in the Oil market. Traders have a lot of information to consider at this point, with a number of geopolitical and technical subjects moving prices and making things interesting for market participants. In this report, we will explain the main subjects driving Oil prices currently and provide our personal views on how the market could react to them. We intent to close this outlook with a technical analysis displaying levels and trends that could prove useful.
The Oil market’s sensitive nature towards geopolitical tensions is currently exposed with the ongoing Russian war in Ukraine. Energy prices in general have headed higher since the war has started more than 2 months ago. Yet in the past days the situation may have escalated with Russia and the EU imposing sanctions on each other for countries buying Oil and Gas. Some commodity traders will be banning their purchases of Russian Oil by May the 15th. As the war continues, we could see more European nations moving away from Russian Oil and subsequently creating some worries in the market. Russia on the other hand may find it more suitable to push further Oil into Asia. However, the International Energy Agency (IEA) through its Oil market report for May, stated it did not see Oil supply levels being impacted by sanctions on Russia. The constant rise in output by both the US and the OPEC plus group in the coming months could compensate for the loss, while the lower demand from China as a result of the ongoing lockdowns imposed in some provinces may defend the situation as well.
Moreover, excluding Russia from global Oil supply could put further pressure on other Oil producers like Saudi Arabia and the US, requiring them to be even more consistent with output. In the scenario of any other Oil supply disruptions from other major Oil producers, we could see Oil prices being lifted further.
On Wednesday the 11th of May the important Energy Information Administration’s (EIA) Crude Oil Inventories weekly release displayed the large 8.5m barrel surplus. This is the second highest surplus in the current year for the EIA and WTI dropped approximately $0.50 upon release. WTI’s price reaction could be implying that trader’s attention for now remains on the subjects we mentioned above and not the weekly releases. As we are referring to the US Oil production, we must note that Oil analysts expect countries maneuvering Russian Oil to be turned towards West Texas Intermediate possibly favoring US Oil companies like Exxon Mobil (#XOM) and Chevron (CVX). The stocks of these companies have managed to gain on a year to date basis, as the ongoing circumstances driving the Oil industry are working towards their advantage.
On a separate note, we would suggest traders to constantly monitor developments in China as they could prove crucial for predicting future price action. China’s virus lockdowns could impact global demand and subsequently move Oil prices. In our opinion, if further lockdowns are announced or even prolonged, we could see Oil prices moving lower as China remains the largest Oil consumer internationally.
Technical Analysis
WTICash H4
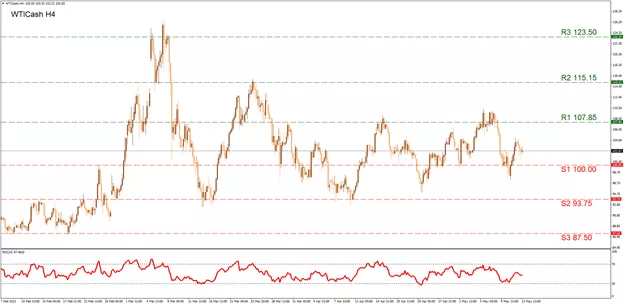
WTI continues to trade in a large sideways motion between our currently noted (R1) 107.85 resistance and the (S2) 93.75 support level. This range is currently highlighted on our chart, with sky blue in order to emphasize the current trend. If the (R1) 107.85 is clearly breached, then a move towards the (R2) 115.15 line is likely imminent. Our highest resistance remains the (R3) 123.50 barrier which was last tested in March and remains the year to date high for WTI. In the opposite direction, a move below the (S1) 100.00 support barrier, could force the price action even lower towards the (S2) 93.75 hurdle. Please note the (S2) has not been breached downwards since late February making it a solid barometer for the strength of a bearish momentum. As our final support we note the (S3) 87.50 which could be engaged in a rather intense selloff scenario. The RSI indicator below our chart seems to be running across the 47-level displaying some bearish interest in the short term.
Elliott Wave View: USDCAD Buyers in Control
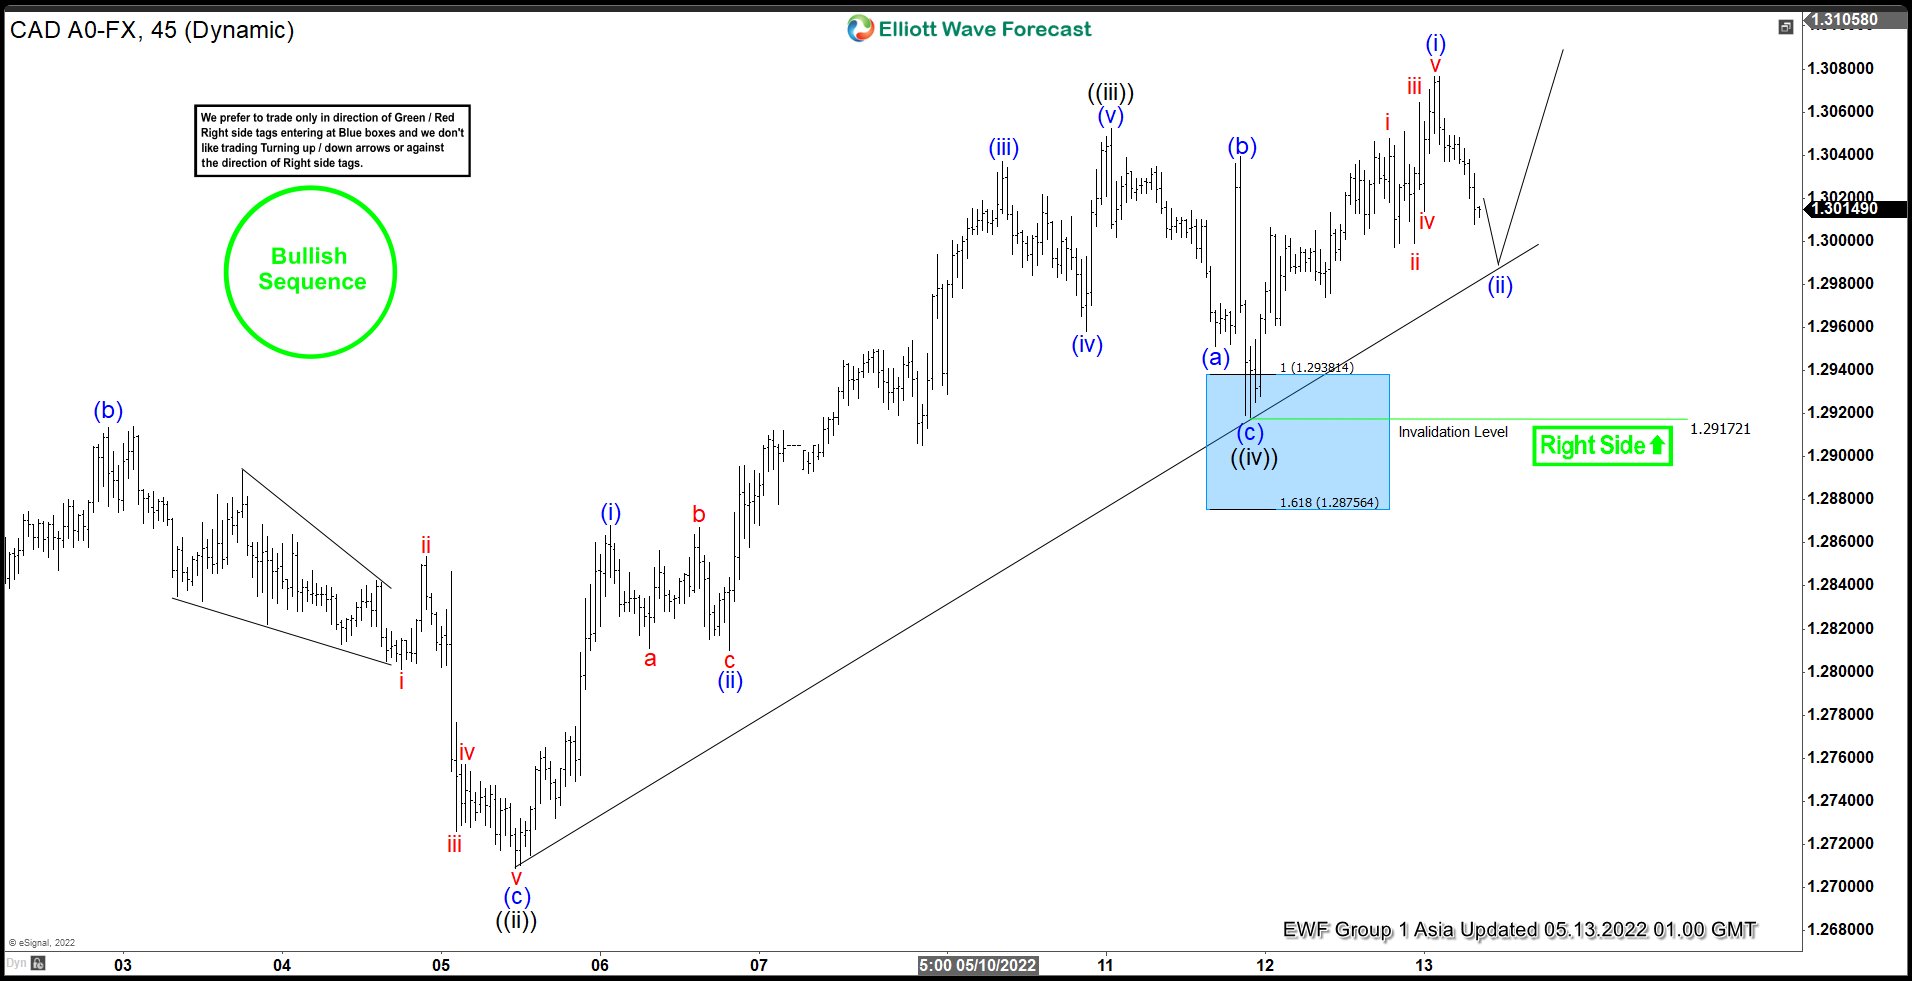
Short Term View in USDCAD suggests cycle from 04.21.2022 low is in progress as a 5 waves impulse Elliott Wave structure. Up from April 21 low, wave ((i)) ended at 1.288 and dips in wave ((ii)) ended at 1.2709. Pair then resumes higher in wave ((iii)) with internal subdivision as an impulse in lesser degree. Up from wave ((ii)), wave (i) ended at 1.2868 and pullback in wave (ii) ended at 1.281. Pair then resumes higher in wave (iii) towards 1.3037, wave (iv) ended at 1.295. Final wave (v) ended at 1.305 which completed wave ((iii)).
Pullback in wave ((iv)) unfolded as a zigzag structure. Down from wave ((iii)), wave (a) ended at 1.295, wave (b) ended at 1.304, and wave (c) ended at 1.2917 which completed wave ((iv)). Wave (c) ended at the 100% – 161.8% Fibonacci extension of wave (a). This area is denoted as a blue box on the chart. Pair has resumed higher in wave ((v)). Up from wave ((iv)), wave (i) ended at 1.3076. Near term, as far as pivot at 1.2917 low stays intact, expect pullback to find support in 3, 7, or 11 swing for further upside.
USDCAD 45 Minutes Elliott Wave Chart
Swiss Franc is About To Reverse
Historically, the stability of the franc is caused by the solid Swiss economy and a highly developed banking system. A peg to gold also supports its "safe currency" status. In addition, the inflation rate in the country over the past few years has averaged 0.6%, although, in April 2022, it reached 2.4% amid geopolitical turmoil and rising oil prices. The average inflation rate in the country in 2022 is expected to be 1.8%.
What happened?
Investors believe in the franc's reliability so much that after the start of the war in Ukraine, everybody rushed to buy the franc, which temporarily broke parity with the euro. However, the Swiss Central Bank gave a clear signal: if the franc continues to rise in price, it will intervene in the situation.
Why is it important?
January 15, 2015, will undoubtedly go down in the history of the Swiss franc and the Swiss economy as Black Thursday. On this day, within a couple of minutes, CHF soared by a quarter against EUR and USD.
This whole storm was caused by the Swiss National Bank (SNB) in Bern, which unexpectedly abandoned the policy it had been pursuing since September 2011. Then SNB decided to limit the growing exchange rate of the national currency, deciding that the euro should not fall below 1.20 francs. Since then, the SNB has spent billions of Swiss francs buying euros to defend this frontier.
The essence of the problem is that Switzerland has never aspired to have a reserve currency but de facto has one. The firmness and reliability of the Swiss franc lead to the fact that it is treated all over the world as a "safe haven" and bought up whenever doubts arise in other currencies. In September 2011, in the conditions of the debt crisis that was growing in the eurozone, a massive buying of Swiss francs began.
The high demand for the currency of a small country like Switzerland inevitably leads to an unnaturally high exchange rate, damaging the economy, which is entirely focused on exports and inbound tourism. After all, the more expensive the franc, the higher the prices for Swiss engineering products, watches, or chocolate, and the fewer foreigners can afford to visit this country.
Will the situation repeat?
We doubt. In 2015, the US Federal Reserve was shrinking the policy of ultra-cheap money and preparing to raise interest rates. At the same time, the European Central Bank was pumping up the unstable Eurozone economy with cheap money. Moreover, the ECB was about to announce new stimulating measures, which could cause further depreciation of the European currency.
As of today, the Federal Reserve has already increased the rate, and the European Central Bank is about to do the same. The Swiss National Bank doesn't need to buy millions of euros to hold EURCHF currency pair above 1.00. Moreover, the inflation rate in Switzerland is barely above the target of 2.2%, which allows the Swiss National Bank easily control the strengthens of the national currency using such instruments as key rate decreases, stimulus packages and currency sell-off.
Technical analysis
EURCHF, monthly chart
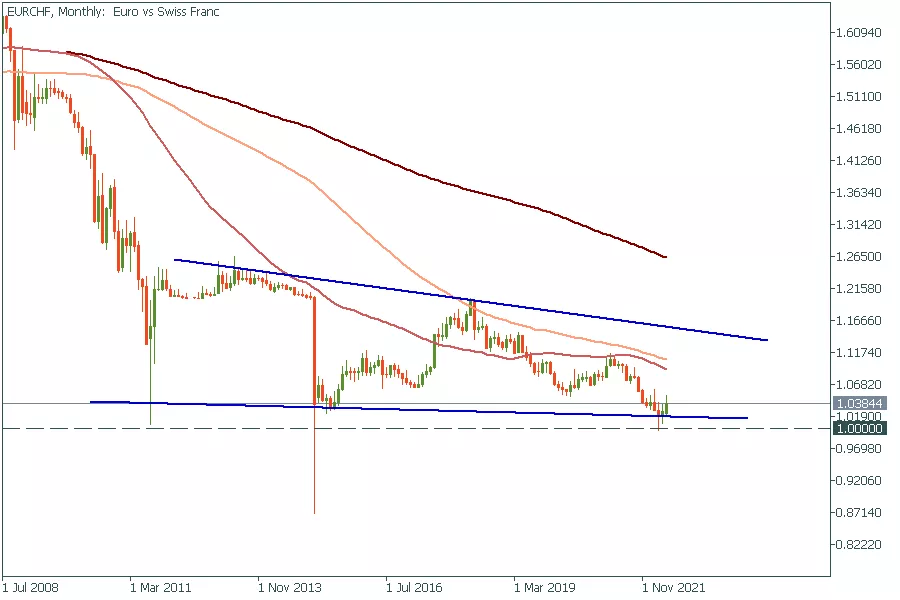
The pair is trading in the falling wedge, which is technically a bearish pattern. The Swiss National Bank gave the strongest hint it would not allow the pair to plunge below 1.00. That’s why we suggest placing limited BUY orders right above this support level and waiting for the upcoming reversal.
USDCHF, monthly chart
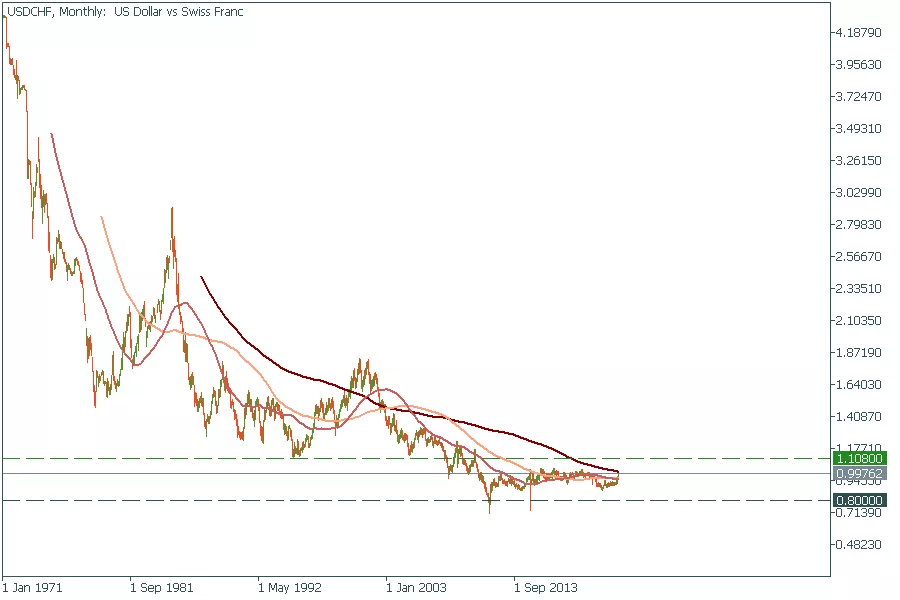
It also looks like the USDCHF pair has found its global support level at 0.8000. Currently, the price is heading towards the 200-month moving average, where a pullback might happen. However, the main resistance remains at 1.1080. Breakout of this level will set a new global solid uptrend for this pair.
Conclusion
The world is changing at its time to admit it. The Japanese yen has already proved old trends can get broken. It looks like the Swiss Franc is the next currency to lose its safe haven status.
AUD/USD: Aussie Posts New Multi-Month Low on Dominating Risk-off Mode
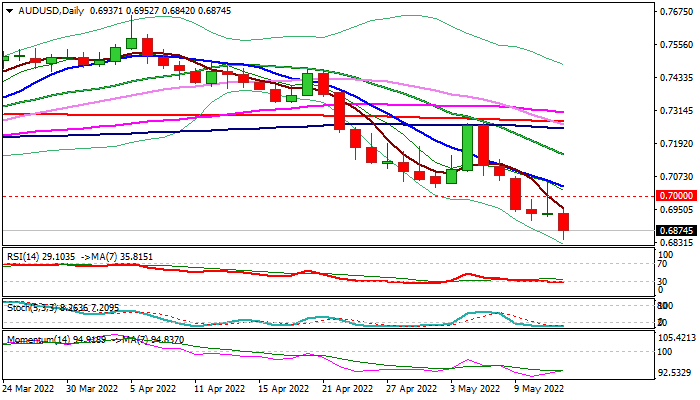
Risk aversion on growing concerns about inflation and slowdown of global growth continues to drive the Aussie dollar lower, after recovery attempts on Wednesday were strongly rejected above 0.70 level, now reverted to strong resistance.
Fresh weakness hit the lowest since June 2020 on Thursday, pressuring the top of monthly Ichimoku cloud (0.6822) which could provide some headwinds to larger bears.
Oversold daily indicators and 14-d momentum turning north from deep negative territory, support the scenario of consolidation, however, overall picture remains firmly bearish and complemented with negative fundamentals that suggests limited corrective action.
Upticks should stay below barriers at 0.7000/34 (psychological / falling 10DMA) to keep bears intact for fresh push lower, with weekly close below 0.70 level to strengthen bearish stance.
Violation of monthly cloud top would open way towards next key support at 0.6758 (50% retracement of larger 0.5509/0.8007 ascend).
Res: 0.6952; 0.6986; 0.7000; 0.7034
Sup: 0.6842; 0.6822; 0.6758; 0.6647