Sample Category Title
AUD/USD Could Struggle Above 0.7200, Gold Dives
Key Highlights
- AUD/USD declined sharply below the 0.7200 support zone.
- A major resistance is forming near 0.7200 and 0.7240.
- Gold price broke the $1,900 support to move into a short-term negative zone.
- The US ADP Employment could change 395K in April 2022, down from 455K.
AUD/USD Technical Analysis
The Aussie Dollar struggled to stay above 0.7400 against the US Dollar. AUD/USD declined heavily and traded below the key 0.7250 support zone.
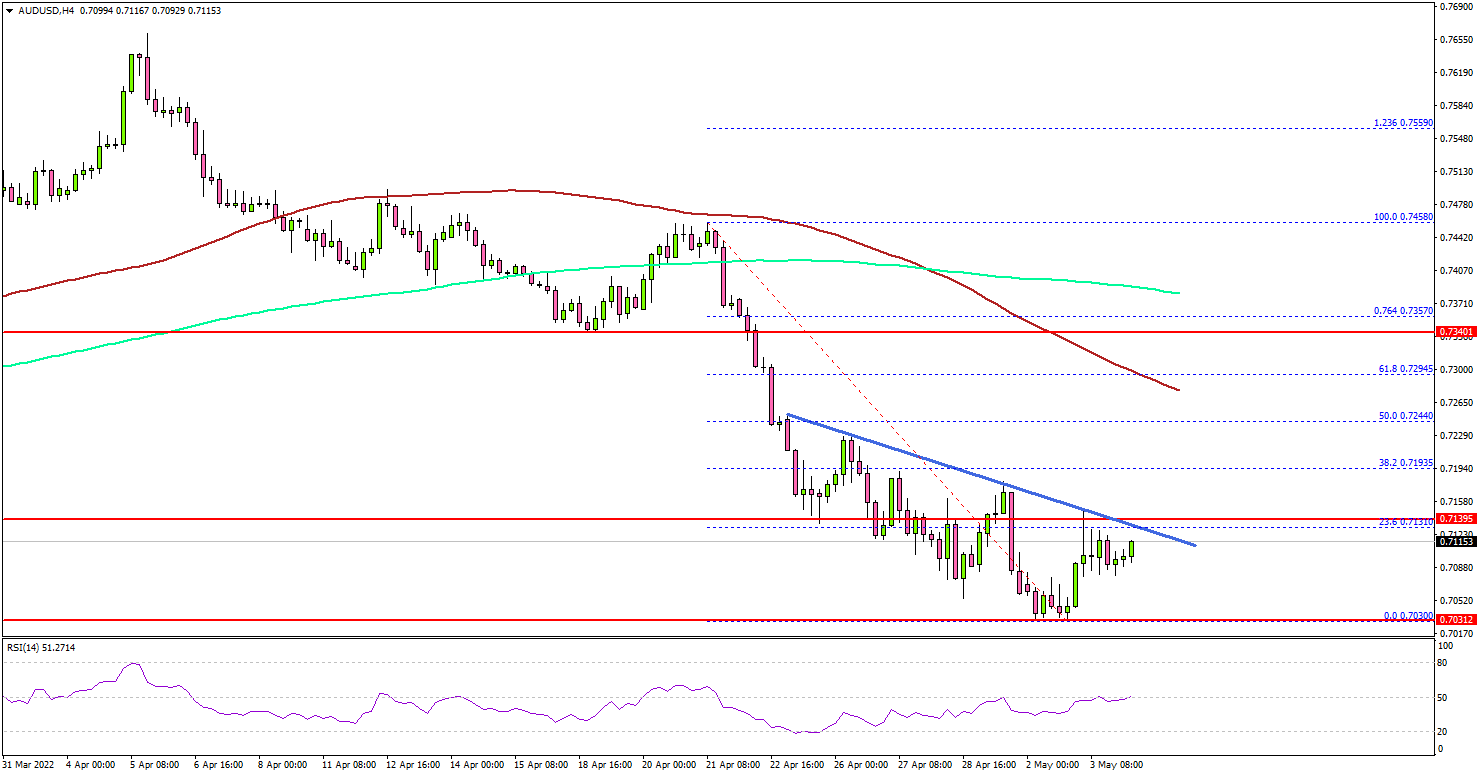
Looking at the 4-hours chart, the pair extended decline below 0.7220. There was also a close below 0.7200, the 200 simple moving average (green, 4-hours), and the 100 simple moving average (red, 4-hours).
Finally, there was a move below the 0.7050 level and the pair traded to a new multi-month low at 0.7030. It is now consolidating losses above the 0.7050 level.
The pair tested the 23.6% Fib retracement level of the main decline from the 0.7458 swing high to 0.7030 low. The first major resistance is forming near the 0.7200 level. If there is an upside break above 0.7200, the pair could rise to 0.7240.
The 50% Fib retracement level of the main decline from the 0.7458 swing high to 0.7030 low is also near the 0.7245. A close above 0.7240 and 0.7250 could open the doors for a move towards the 0.7300 resistance.
If not, there is a risk of more losses below 0.7050. The next major support is near the 0.7000 level. Any more losses may perhaps push AUD/USD towards the 0.6920 support zone.
Looking at EUR/USD, the pair is struggling to recover above the 1.0600 level. Similarly, GBP/USD is facing an uphill task near the 1.2600 zone.
Economic Releases
- US ADP Employment Change for April 2022 - Forecast 395K, versus 455K previous.
- US ISM Services Index for April 2022 – Forecast 58.5, versus 58.3 previous.
Gold Makes Move Before FOMC Meeting
Gold has headed lower for the past two consecutive weeks while remains in a selling momentum in the current, falling to a new 2-month low on the 2nd of May. Clearly Gold’s latest breach below known territory must signal a drastic change in sentiment among traders allowing us to detail some economic developments through this report. We aim to be precise and to the point as an interesting week unfolds with a number of crucial economic events posing as potential movers for the Gold market. Simultaneously, this report will present a technical analysis providing an insight on important technical levels and recent price action.
To make a start, Gold’s downward movement commenced on Friday the 29th of April and seems to persist until today the 3rd of May. In our view, the selling trendline may be correlated to the US economic releases of the previous Friday, which may have enacted a decent bearish interest among traders. On Friday the 29th we got the US Personal Consumption rate which rose to 0.2% from previous revised 0.1% and the Consumption Adjusted rate which jumped to the impressive 1.1% from previous revised 0.6%. At the same time, the Core PCE Price Index rates for March remained steady at 0.3% for the month while the yearly rate ticked down to 5.2%. Please note the Core PCE rates exclude energy prices thus these could be the first signs of good prices stabilizing instead of rising and the rates are optimistic for consumers as some stabilization maybe observed on the headline CPI rates incoming in the following weeks. It could be useful to note, that the Federal Reserve often refers to the Core PCE rates as guidance thus its appearance as a mediocre economic reading could be misleading. Expectations for lower inflation could have invited the sellers for Gold prices. On the contrary, the data is positive for the US economy and provided a temporary boost for the USD Index during the release. In this case, as the greenback received support Gold may have been pushed lower due to their adverse relationship.
Turning to the current week, on the 4th of May during the late US session we get the key economic event of the week with the Federal Reserve’s Interest rate decision meeting. This meeting will consist of the FOMC statement, the interest rate decision and later the FOMC press conference with Chairman J Powell going live. Currently FFF imply a probability of 93.9% for a rate hike of 50 basis points to be enacted sending the overnight rate to 0.875%. Market participants will be interested to know how the Fed will deal with the economy looking forward and how aggressive it is willing to be. In this case a hawkish tone could possibly favor the USD. Yet, due to the market’s anticipation for this important event, we could not rule out the scenario of Gold’s price action undertaking wide swings throughout the decision and press conference.
On Friday the 6th of May we get the important US employment report for April. The US job market had become extremely tight in the previous months and it will be very interesting to see if this notion continued in April. For the time being, the unemployment rate is expected to tick down to 3.5% while the NFP figure is estimated at 400K. This is an event that requires extra caution in our opinion, as the actual figures could create volatility waves across the board and especially for the Gold market.
Technical Analysis
XAUUSD Daily
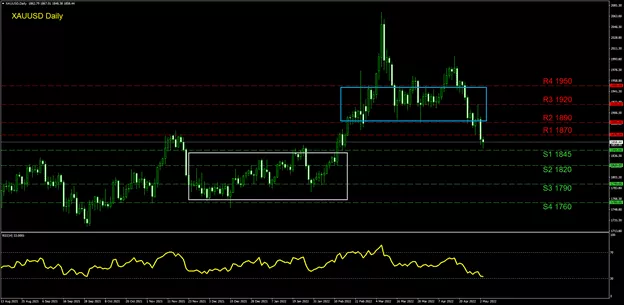
Due to the incoming economic events mentioned and the increased chances for volatility, we have selected the Gold’s daily chart for today’s technical analysis. With the latest drop to lower grounds, Gold has moved towards the (S1) 1845 support level but has failed to breach it yet. In the scenario of further selling we could see Gold crossing into the lower range of our chart which is highlighted with a gray rectangle. Below the (S1) we note the (S2) 1820 level and lower the (S3) 1790 hurdle. Please note the gray rectangle was used from November 2021 to February and could act as a retesting of some previously familiar levels. If Gold comes under buying interest, we note the (R1) 1870 resistance as the most probable level to be engaged. In the scenario of a move even higher we point out the (R2) 1890 barrier as a possible next target for the bulls. The (R2) has been tested various times in the last days of April thus may be the treated as a make or break point for a bullish trend. In the scenario of a move above the (R2), we highlight the area noted with a blue rectangle which may signal bullish appetite for the precious metal. We would like to note the (R3) 1920 which was tested for the last time on the 29th of April. Finally, the RSI indicator below our chart has dropped below 50 confirming the selling momentum may still be in place. The overall trend in our opinion remains downwards but a possible breach into the blue rectangle area on our chart can change into a sideways trend with bullish tendencies.
RBA Lifts Cash Rate by 25bps – More to Come Including 40bps in June
Today the Reserve Bank Board raised the cash rate by 0.25% from 0.10% to 0.35%.
The Governor issued his usual Statement at 230 pm and conducted a Press Conference at 4 pm.
The Governor noted that now was the right time to begin withdrawing some of the monetary support that was put in place to help the Australian economy through the pandemic.
The Board has made some significant changes to the forecasts that were released in the February Statement on Monetary Policy (SOMP).
The forecast unemployment rate at year's end has been revised down from 3.75% to 3.5% and is expected to hold at that level throughout 2023. That is despite GDP growth expected to slow to a below trend pace of 2% (unchanged from February).
But of most significance was the upward revision in inflation. Underlying inflation is now forecast to reach 4.75% by end 2022 (currently 3.7%) compared to the SOMP forecast of 2.75% – a staggering uplift of 2 ppt's in forecast inflation.
Underlying inflation is then forecast to fall back to 3% by mid- 2024 compared to 2.75% in the SOMP.
The task of reducing underlying inflation over that 18 month period from 4.75% to 3.0% overwhelms the previously expected task of holding it steady over the period at 2.75%.
We do not know where the Board expects underlying inflation at end 2023 but it seems entirely reasonable that the detailed forecasts to be released on May 6 will indicate that underlying inflation by end 2023 will still be above the Board's target range of 2–3% (probably 3.25%)
This observation explains why the Board surprised today by lifting the cash rate a little further than the 15 basis points expected by the market and many analysts including Westpac.
It also signals that the Board should be prepared to "front load" its tightening cycle to convince households and business that it is committed to achieving that formidable goal of returning inflation back to the target band (admittedly to the outer limit) by mid-2024.
In the press conference the Governor revealed the interest rate path that was used to arrive at the forecasts.
He noted that the cash rate profile was 1.5%-1.75% by end 2022 and 2.5% by end 2023, most likely the base terminal rate.
He also noted that the choice of 25 basis points was a return to "business as usual" signalling that increments of 25 basis points might be considered the base case.
We are not convinced that the next move will be 25 basis points.
Consistent with our previous forecast that the Board would want to reach a cash rate of 50 basis points by June we expected 15 basis points in May to be followed by 25 basis points in June.
But that was before we saw the formidable challenge that the Board believes it has to return inflation to within the band over the next 2 years.
A larger increase in the cash rate than 25 basis points is likely to be seen by the Board as necessary to convince agents that it is serious about the challenge and to accelerate the unwinding of the emergency measures that saw 65 basis points of rate cuts in 2020.
We have chosen 40 basis points rather than 50 basis points purely because we expect that "business as usual" is increments of 25 basis points on a base of multiples of 25 basis points (in line with the practices of most other central banks).
It is better to slightly trim the largest expected increase in the cycle rather than reduce any subsequent moves to that 15 basis points that was rejected at today's meeting.
We continue to disagree with the Board's base case and the market's expectation that the tightening cycle will extend into the second half of 2023.
We are surprised that the Board's forecast is for the unemployment rate to hold at 50 year lows in the second half of 2023 despite growth slowing to a below trend 2% and continue to believe that the high leverage in the household sector will start to weigh on the economy as rates move above 150 basis points.
Apart from that large hike of 40 basis points in June to return the cash rate to 75 basis points we continue to expect the rate path we forecast before today's announcement.
That is increases of 25 basis points in July; August; October and November with the rate reaching 175 basis points by year's end instead of our previous 150 basis points.
That will be a level where the household balance sheet will come under some strain and the subsequent movements by the Board will be much more cautious – one hike of 25 basis points in February and another in May.
The Governor described a revised approach to assessing the outlook for wages.
He gave greatest emphasis not to the slow- moving Wage Price Index but to the results of the Bank's liaison with businesses- 40% of the businesses responding to the liaison assessments described wage increases of above 3%. He confidently declared that wage growth is finally picking up.
It does not appear likely that a "disappointment" with the Wage Price Index that prints on May 18 or even the wages data in the national accounts (June 1) could divert his attention from the urgency of lowering that inflation rate back to the target band in 2023.
In moderating our rate view we continue to use the key approach that near term rate decisions will be heavily influenced by current forecasts whereas decisions further out are going to be impacted by the evolution of the data. For that reason, we see the need for some urgency in the near stages of this cycle but caution around the base assumption of four rate hikes in 2023 (or significantly more from the market).
The Governor also clarified the Board's position on the balance sheet. It will allow maturing government bonds to run off without reinvesting the proceeds. It has not committed to accelerating the shrinking of the balance sheet by outright sales of bonds. Bear in mind that around $180 billion of term fund loans to the banks are due to be repaid in September 2023 (around $80 billion) and a further $100 billion in June 2024. That compares with around $350 billion of bond purchases during the pandemic. The Bank can reduce the build up in its balance sheet during the pandemic by around 35% without needing to sell bonds.
Conclusion
The Board is clearly on the path to winding back the extraordinary stimulus that accumulated during the pandemic and then moving rates back to a normal profile.
The Governor speculated that 2.5% cash rate (zero real) might be a reasonable target, but we will only know when we can assess the response of the economy to these policies.
Our view is that the early stages of the cycle are likely to indicate the Board's commitment to the formidable task of bringing underlying inflation back from 4.75% to 3% over the course of 2023 and 2024.
In the early stages it is "safer" to move at a faster pace than in later stages when the build-up in rates will start to impact households.
We think that can be achieved with a terminal rate of 2.25% which will be reached late in the first half of 2023.
The high sensitivity of household balance sheets to rising rates will be the key constraint on the need for rates to move any higher.
EUR/USD Outlook: Euro Extends Consolidation above Five-Year Low
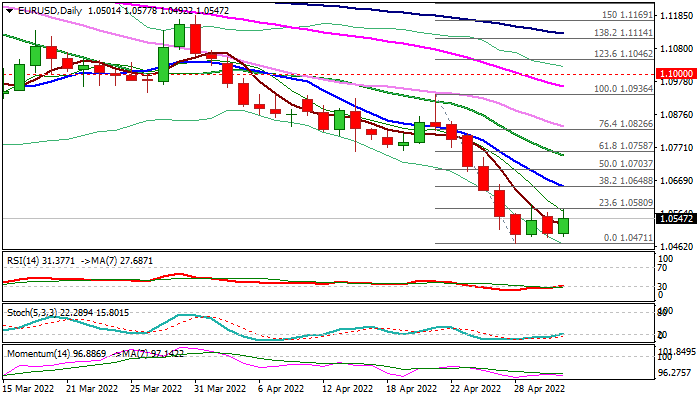
The Euro extends consolidation above five-year low into fourth straight day, with sideways trading reflecting quiet mode ahead of Fed’s policy decision, due on Wednesday.
Bears are taking a breather after nearly 5% drop in April, with the single currency being strongly deflated by risk aversion and robust dollar on safe-haven buying and expectations for more aggressive Fed.
Repeatedly capped recovery in past four days, suggest that overall structure remains firmly bearish and the larger downtrend is likely to resume after a brief pause.
Near-term picture was further hurt by strong rise in European producer prices (Apr PPI 36.8% y/y from 31.5% in Mar and above forecast for 36.3% rise) that signals persisting price pressures and warns that inflation could rise further after hitting new record high last month.
The US central bank is widely expected to hike interest rate by 50 basis points to 1% at the end of two-day policy meeting on Wednesday, with increased hawkish stance signaling a number of hikes in coming months that makes the dollar more attractive to investors.
Continuation of larger EURUSD’s downtrend from Feb 2021 peak would look for test of key longer-term support at 1.0340 (Jan 2017 low), the last obstacle on the way towards targets at 1.0069 (Fibo 76.4% of 0.8225/1.2039, 2000/2008 ascend) and 1.0000 (parity).
Firmly bearish technical studies on all larger timeframes, support scenario, as 4-hr techs lose bullish momentum and add to warnings.
However, some analysts suggest that strongly elevated US dollar may provide very good levels for fresh shorts, on ‘buy the rumors – sell the facts’ scenario.
Res: 1.0580; 1.0648; 1.0700; 1.0746.
Sup: 1.0490; 1.0471; 1.0400; 1.0340.
CADCHF Wave Analysis
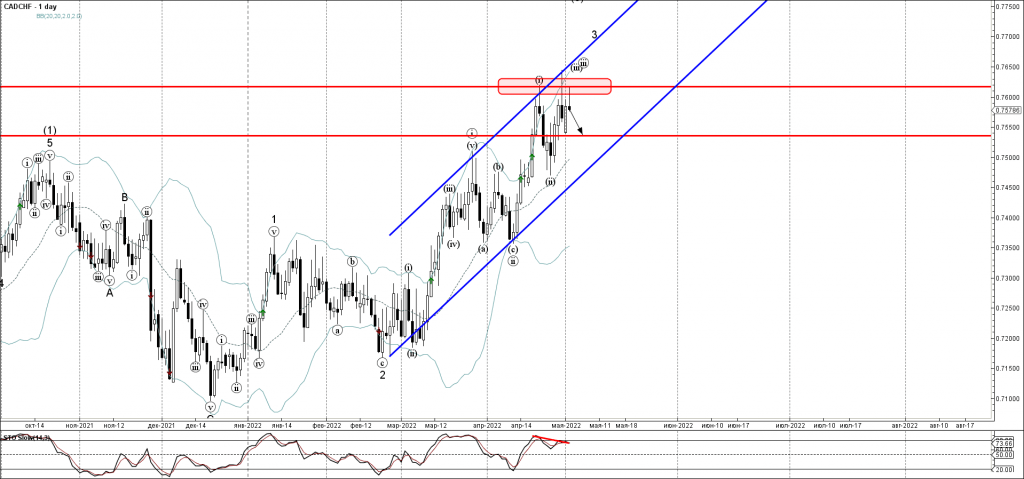
- CADCHF reversed from resistance level 0.7620
- Likely to fall to support level 0.7535
CADCHF currency pair today reversed down from the key resistance level 0.7620, standing near the upper daily Bollinger Band and the resistance trendline of the daily up channel from February.
The downward reversal from resistance level 0.7620 stopped the previous short-term impulse waves (iii) and 3.
Given the strength of the resistance level 0.7620 and the bearish divergence on the daily Stochastic – CADCHF currency pair can be expected to fall further toward the next support level 0.7535.
Platinum Wave Analysis
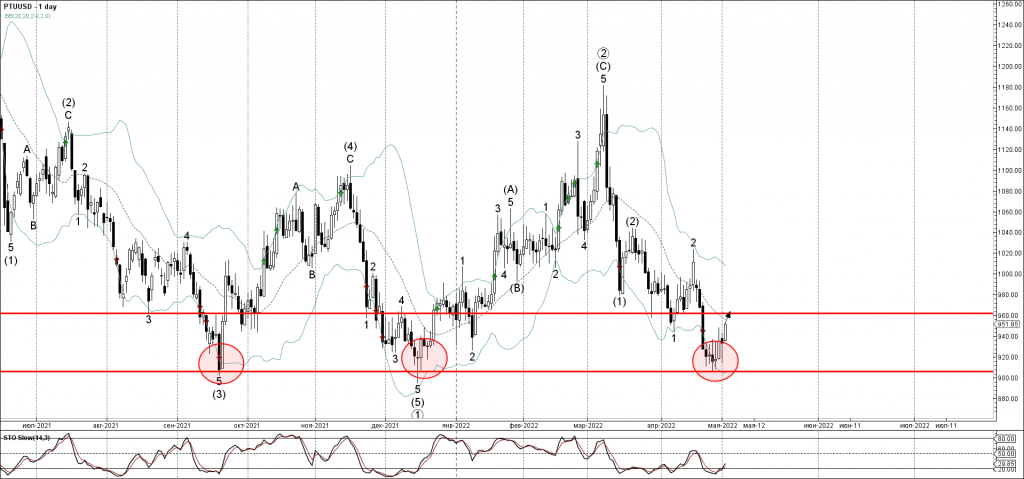
- Platinum reversed from support zone
- Likely to rise to resistance level 960.00
Platinum recently reversed up strongly from the powerful long-term support level 900.00 (which has been reversing the price from last September), standing near the lower daily Bollinger Band.
The upward reversal from support level 900.00 stopped the previous short-term impulse wave 3 of the higher impulse wave (3) from last month.
Given the strength of the nearby support level 900.00 – Platinum can be expected to rise further toward the next resistance level 960.00 (the former monthly low from March).
Sunset Market Commentary
Markets
Another dropout in the monetary policy ultimate survivor this morning. The Reserve Bank of Australia made a Swedish Riksbank-style sudden policy U-turn, leaving the ECB flanked by only the Swiss National Bank and the Bank of Japan. The RBA wrongfooted many both with the timing of the hike (ahead of Q1 wage growth and ahead of parliamentary elections) and with the size of the inaugural move (25 bps vs 10 bps outside chance discounted). European interest rate markets immediately added to their bets that the ECB will follow swiftly with a July rate hike. The EU 2y swap rate temporarily traded above the psychologic 1% mark for the first time since 2012. The German 10-yr yield crossed that same number for the first time since 2015. The 2015 top at 1.06% remained just out of reach. This time around, the sell-off didn’t last though. We’re probably too close to the FOMC meeting to add to directional bets from current levels. Core bonds recovered intraday losses and even eked out some gains as the European trading session evolved. The EMU unemployment rate declined from an upwardly revised 6.9% in February to 6.8% in March – an EMU record low – but didn’t impact trading. The German yield curve bull flattens at the time of writing with yields falling by 0.7 bps (2-yr) to 7.6 bps (30-yr). The US yield curve moves in similar fashion with yields 2.7 bps (2-yr) to 6.8 bps (20-yr) lower. The US 10-yr yield earlier on the day for a second straight session failed to take out the 3% mark. European stock market record small gains on a daily basis, but their performance remains unconvincing.
In FX space, the dollar’s multisession attempt to take out EUR/USD 1.05 failed again. It caused some rebound action north of 1.055, but the short term rebound high at 1.0593 remained out of reach. The trade-weighted dollar currently changes hands at 103.15 from an open at 103.60. Moves on FX markets probably fit in the general cautiousness ahead of tomorrow’s FOMC gathering. Rien ne va plus. EUR/GBP seemed trapped in a kind of similar paralysis ahead of Thursday’s Bank of England meeting with the pair hovering around the 0.84 big figure. EUR/GBP 0.8420 is currently on the charts. News Headlines
Hong Kong’s economy contracted by much more than expected in the first quarter of this year. GDP was down 2.9% q/q (-4% y/y) vs -0.9% (-1.3% y/y) expected. It’s the biggest setback since Q1 of 2020. The coronavirus is again responsible. Tough restrictions to beat down a fifth wave made domestic household spending collapse. These effects should ease going forward thanks to the accelerated reopening plans. Externally, moderating global demand growth and China’s zero-Covid strategy hampering trade flows from and to the mainland posed substantial drags to exports, a government spokesperson said. The person added that the global economic outlook is being challenged by central banks expediting monetary policy tightening. The HK dollar loses against most peers but the market reaction in USD/HKD is limited. This may be because the pair is stomping at the upper bound of the 7.80 +/- 0.05 peg lately. Losses beyond that level could trigger 2018-2019 style FX interventions by the Hong Kong Monetary Authority.
Italy’s PM Draghi called on the EU to address soaring energy costs and the economic impact of the Ukraine war the way it did with handling Covid, saying individual national budgets won’t make the cut. He argued for the SURE unemployment scheme to be extended in scope so that it eg. can be used to finance tax relief measures to support lower real wages. For long-term investments in areas such as defense, energy and food, NextGenEU offers inspiration.
DXY: Knocking on Heavens Door
When it comes to foreign exchange markets, it has been the US dollar that has reigned supreme. Last week, the US dollar index (DXY) capped of its fourth consecutive week of gains, rising by 2.10%. In level terms, the pair quickly breached the March 2020 high of 102.992 and had a brief dalliance at 103.928, just above the January 2017 high of 103.820, before closing at 103.212. This positive momentum has carried into this week as the index looks set to retest the 103.820 level and traders eye further upside.
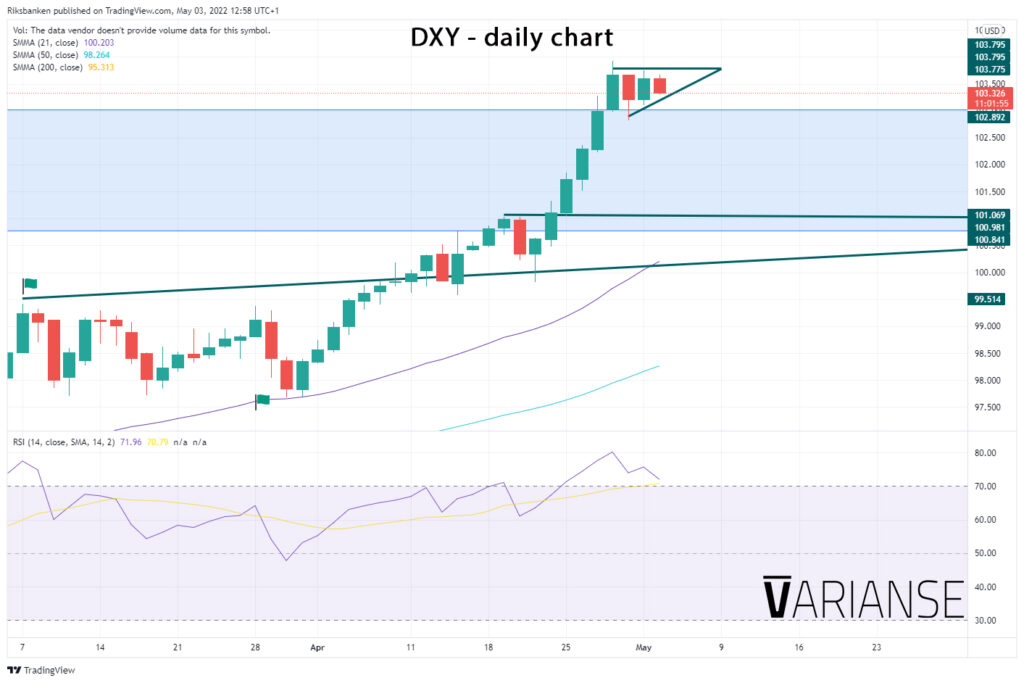
At the time of writing, daily price action has formed what could be construed as an ascending triangle pattern, which would suggest a continuation of the current uptrend. Furthermore, despite the daily RSI being above 70 – the level which traditionally demarcates overbought conditions – sings of divergence that would allude to a potential reversal are absent. A sustained break above 103.820, would leave every opportunity for the index to rise above the 105.40-60 region. The latter acted as prior support in 2020 and could easily prove areas of resistance.
That said, the 103.820 level remains a key area of resistance and the DXY’s rise over recent week has been aggressive. There is every risk the DXY could trade sideways within a big range from these levels. As a result, buyers may be tempted to wait for better levels before carrying the DXY higher. Based on prior congestion zones, 100 to 101, could be key buy zones if that does prove to be the case. Either way, it will likely take a break below 99.818 to really convince market participants that the DXY has shifted from its current uptrend into a downtrend.
Euro Rises, Fed Meeting Looms
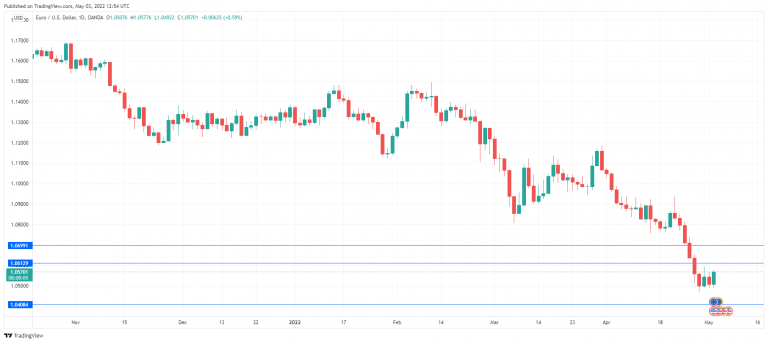
The euro is in positive territory on Wednesday. EUR/USD is trading at 1.0568 in the European session, up 0.57% on the day.
Fed likely to raise rates by half-point
All eyes are on the Fed, which is expected to raise rates by a half-point, which would be the largest rate hike in 20 years. Fed Chair Powell and other FOMC members have been telegraphing their newfound hawkishness to the markets and receive full marks for being transparent, assuming that there are no last-minute surprises. There have been calls for a massive 0.75% rate, which is unlikely. Still, the mere fact that such massive increases are being suggested indicates just how badly the Fed miscalculated inflation and has fallen behind on the inflation curve.
We are likely to see additional 0.50% hikes in upcoming meetings, as the Fed comes out swinging against inflation, which has become Public Enemy No. 1. This aggressive stance has boosted the US dollar against the major currencies, as Treasury yields continue to climb higher. However, there are growing concerns that sharp rises in rates will choke growth and result in a recession.
Equally as important as the rate hikes, the FOMC is expected to announce a reduction in bond holdings, and the pace of the balance sheet normalization will be closely watched. If the Fed delivers a larger cap on holdings than expected, this would be bullish for the US dollar.
The eurozone remains vulnerable to the war in Ukraine, and the manufacturing sector continues to struggle with supply chain disruptions and price pressures. German factories are reporting a loss of momentum due to weaker economic activity, and if the EU were to place an embargo on Russian oil, it would likely lead to a recession in Germany. Inflation has been soaring, which is weighing on growth in the bloc. Last week, the German government cut its growth forecast for 2022 to 2.2%, down sharply from 3.6% in a previous forecast.
With the ECB still stuck in accommodative mode while the Fed is getting ever more hawkish, the US/Europe rate differential is widening, which spells more trouble for the euro.
EUR/USD Technical
- There is resistance at 1.0612 and 1.0699
- 1.0408 is providing support, followed by 1.0321