Sample Category Title
NASDAQ hits new low as medium term correction resumes
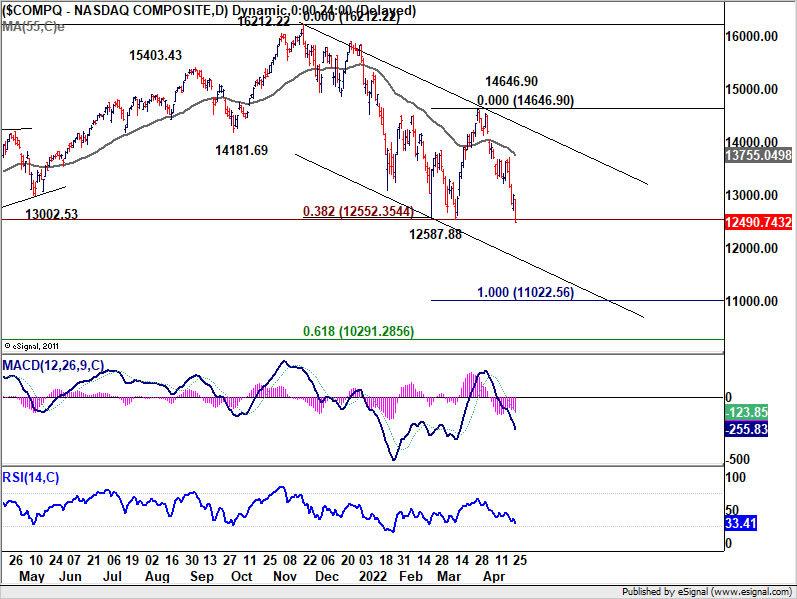
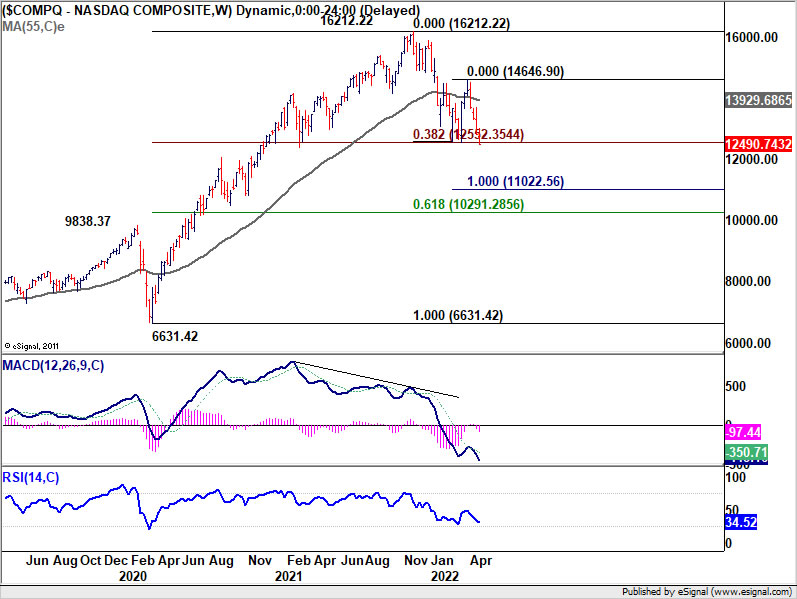
NASDAQ lost -3.95%% overnight and closed at a new 2022 low. The development suggests that whole corrective fall from 16212.22 is resuming. More importantly, a key medium term fibonacci support at 38.2% retracement of 6631.41 to 16212.22 at 12552.35 is taken out. If this fibonacci support cannot be reclaimed soon, the decline ahead could be rather deep.
Tentatively, NASDAQ should target 100% projection of 16212.22 to 12587.88 from 14646.90 at 11022.56 next. There should be strong support around this level, and above 61.8% retracement of 6631.42 to 16212.22 at 10291.28 to contain downside to finish the correction.
Australia CPI accelerated to 2.1% qoq, 5.1% yoy, highest since 2000
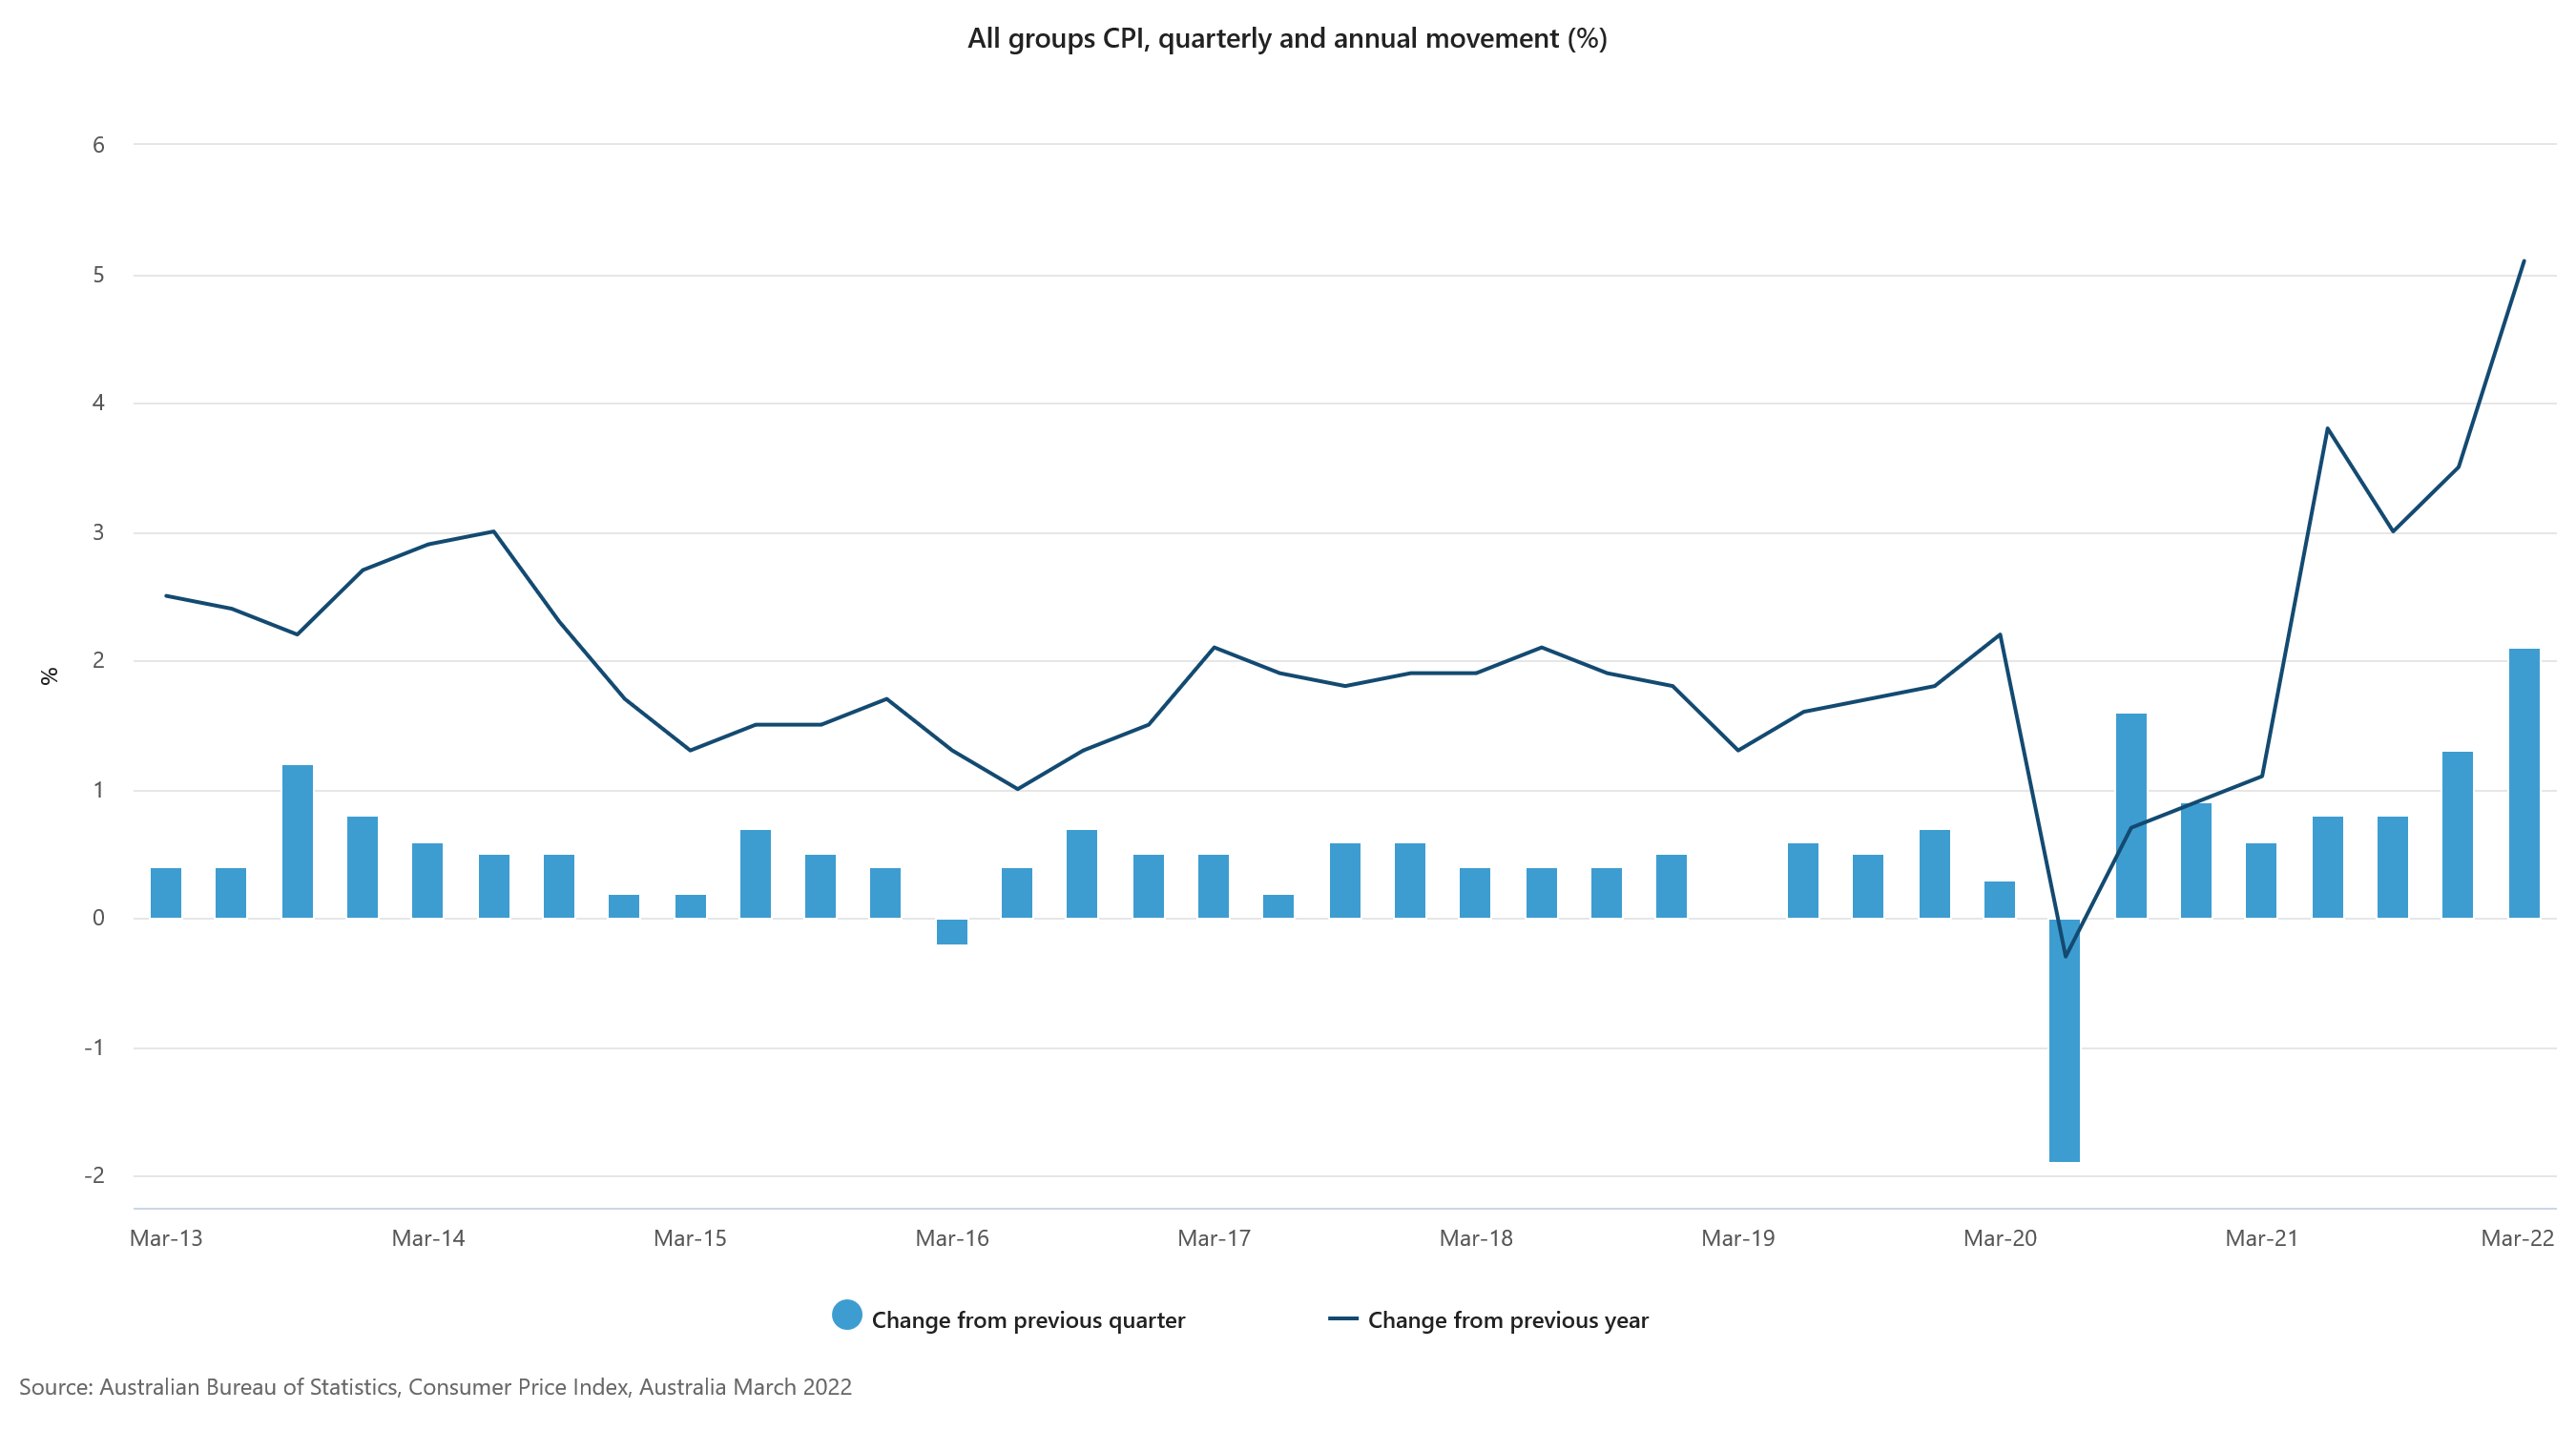
Australia CPI rose 2.1% qoq in Q1, accelerated from Q3's 1.3% qoq, above expectation of 1.7% qoq. For the 12-month period, CPI accelerated to 5.1% yoy, up from 3.5% yoy, above expectation of 4.6% yoy. RBA trimmed mean CPI also accelerated from 2.6% yoy to 3.7% yoy, above expectation of 3.4% yoy.
Head of Prices Statistics at the ABS, Michelle Marquardt, said "The CPI recorded its largest quarterly and annual rises since the introduction of the goods and services tax (GST) (in 2000)"
"Strong demand combined with material and labour supply disruptions throughout the year resulted in the highest annual inflation for new dwellings since the introduction of the GST. Annual price inflation for automotive fuel was the highest since the 1990 Iraqi invasion of Kuwait."
Marquardt said: "Annual trimmed mean inflation was the highest since 2009. This reflected the broad-based nature of price rises, as the impacts of supply disruptions, rising shipping costs and other global and domestic inflationary factors flowed through the economy."
Technical Outlook and Review
DXY:
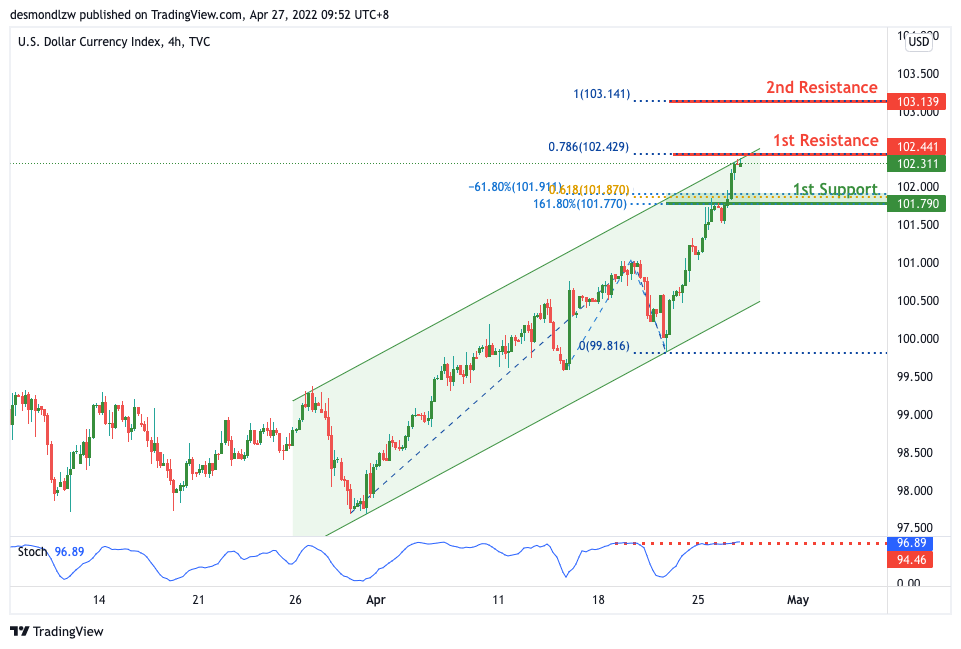
On the H4, with price expected to reverse off the stochastics indicator, we have a bearish bias that price will drop from our 1st resistance at 102.441 where the 78.6% Fibonacci retracement is to our 1st support at 101.790 in line with the horizontal pullback support, 161.8% Fibonacci extension, 61.8% Fibonacci projection and -61.8% Fibonacci expansion. Alternatively, price may break 1st resistance structure and head for 2nd resistance where the 100% Fibonacci projection.
Areas of consideration:
- H4 time frame, 1st resistance at 102.441
- H4 time frame, 1st support at 101.790
XAU/USD (GOLD):
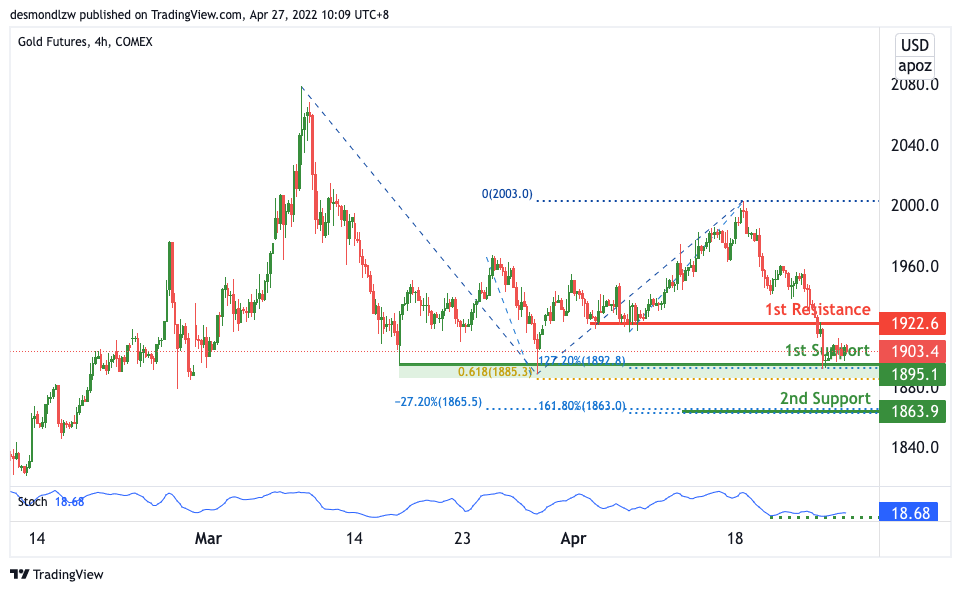
On the H4, with price expected to bounce off the stochastics indicator, we have a bullish bias that price will rise to our 1st resistance at 1922 where the pullback resistance is from our 1st support at 1895 in line with the horizontal swing low support and 61.8% Fibonacci projection and 127.2% Fibonacci extension. Alternatively, price may break 1st support structure and head for 2nd support where the 161.8% Fibonacci extension and -27.2% Fibonacci expansion is at 1863.
Areas of consideration:
- H4 time frame, 1st Resistance at 1922
- H4 time frame, 1st Support at 1895
GBP/USD:
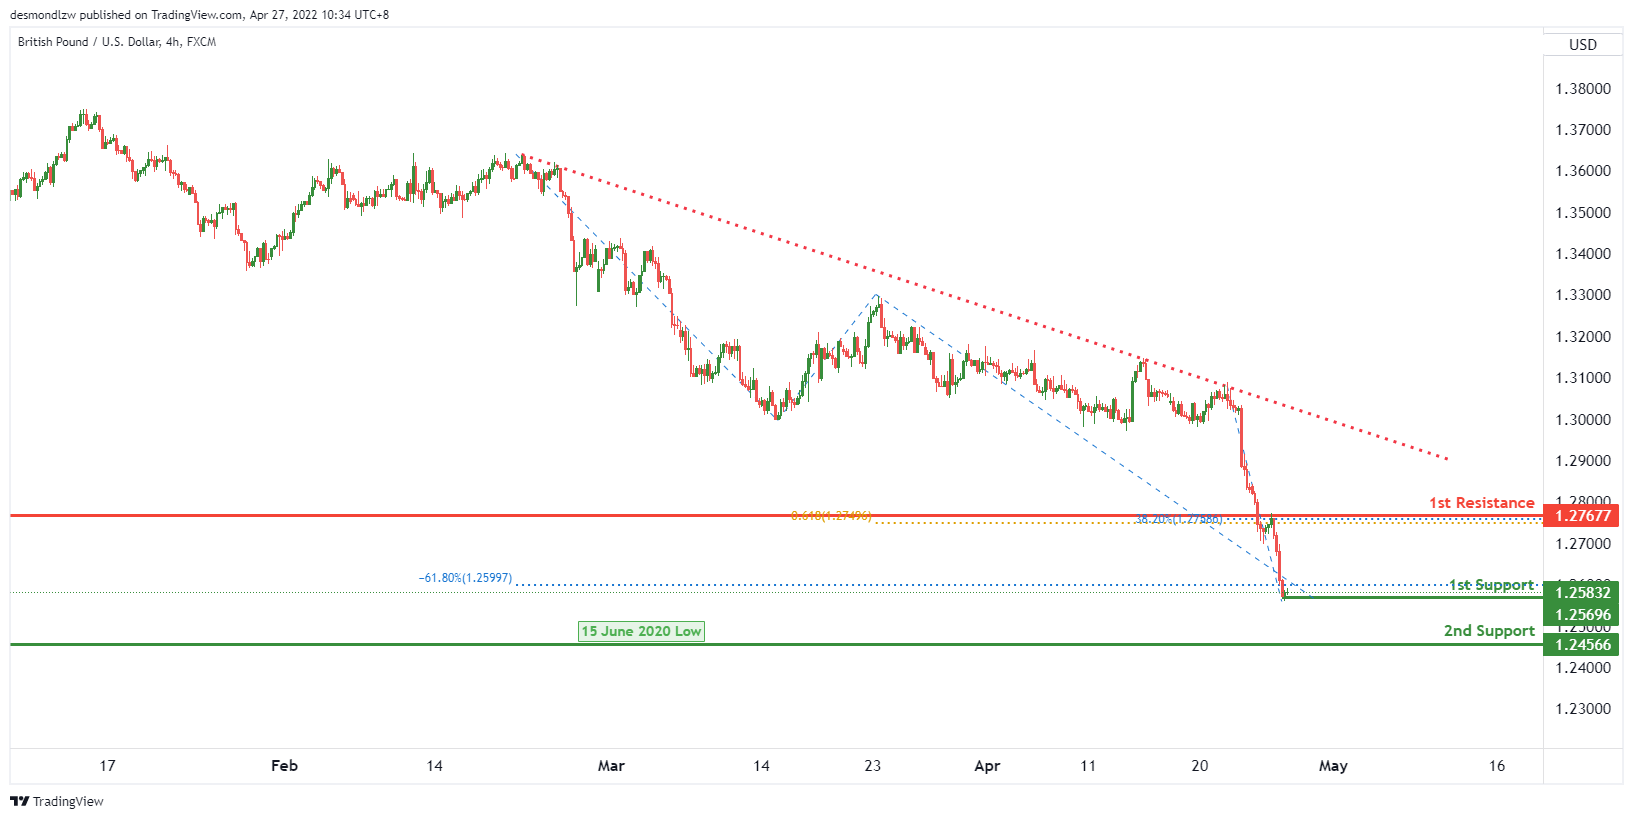
On the H4, we have a bullish bias that price will rise from 1st support level of 1.25696 which lines up with -61.8% fibonacci expansion towards the 1st resistance level of 1.27677 which lines up with 61.8% fibonacci projection and 38.2% fibonacci retracement.
Areas of consideration:
- H4 1st resistance at 1.27677
- H4 1st support at 1.25696
- H4 2nd support at 1.24566
USD/CHF:
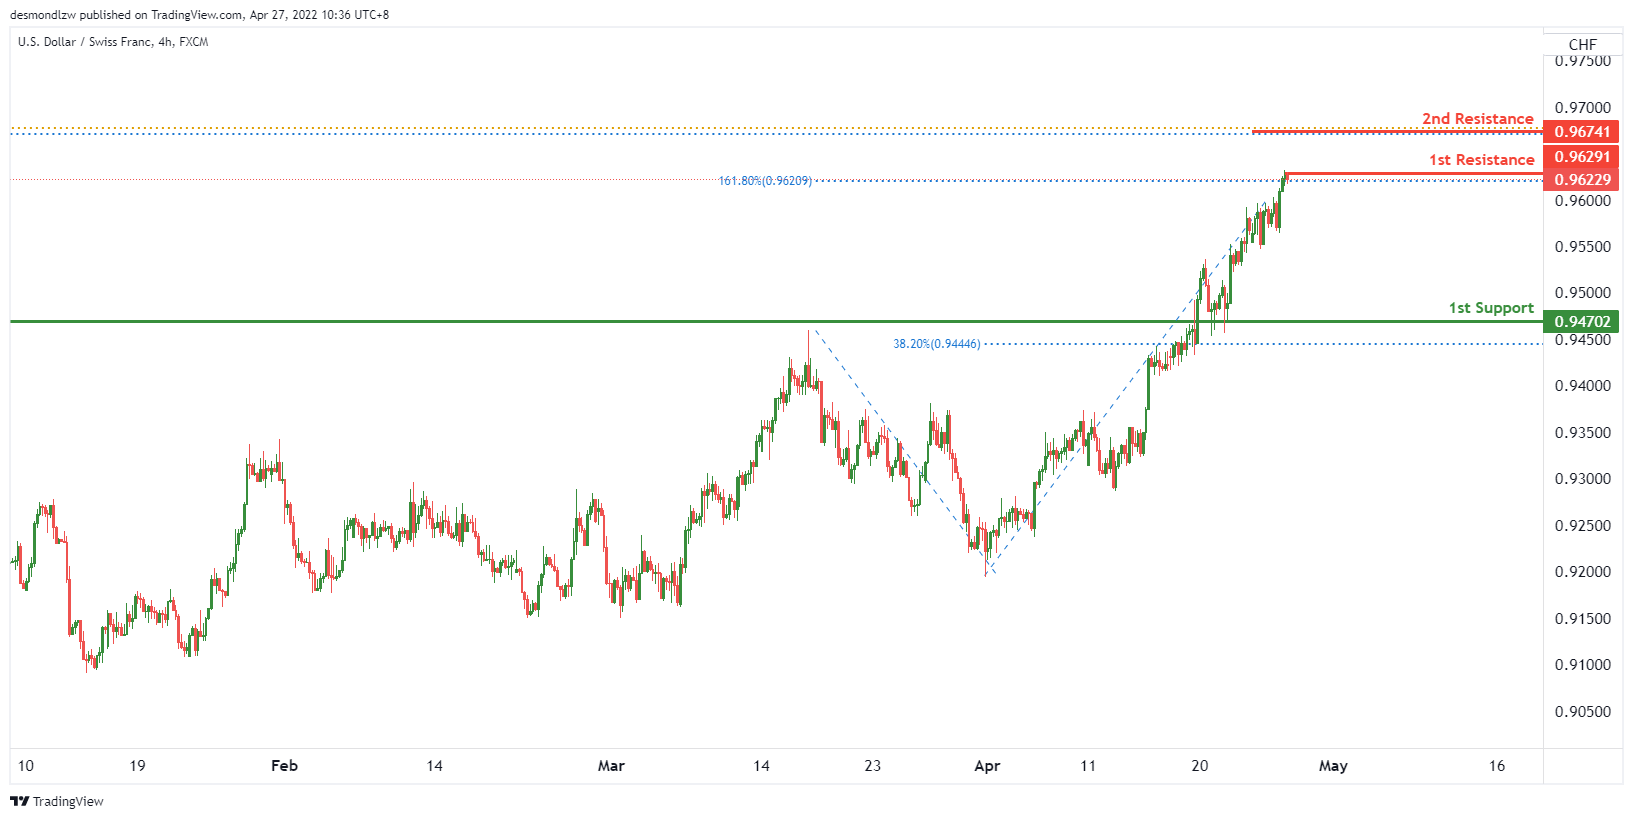
On the H4, price is near to the key resistance level. We expect that price will potentially reverse from 1st resistance level of 0.96291 in line with 161.8% fibonacci extension towards the 1st support level of 0.94702 in line with 38.2% fibonacci retracement.
Areas of consideration
- 1st support level at 0.94702
- 1st resistance level at 0.96291
- 2nd resistance level at 0.96741
EUR/USD :
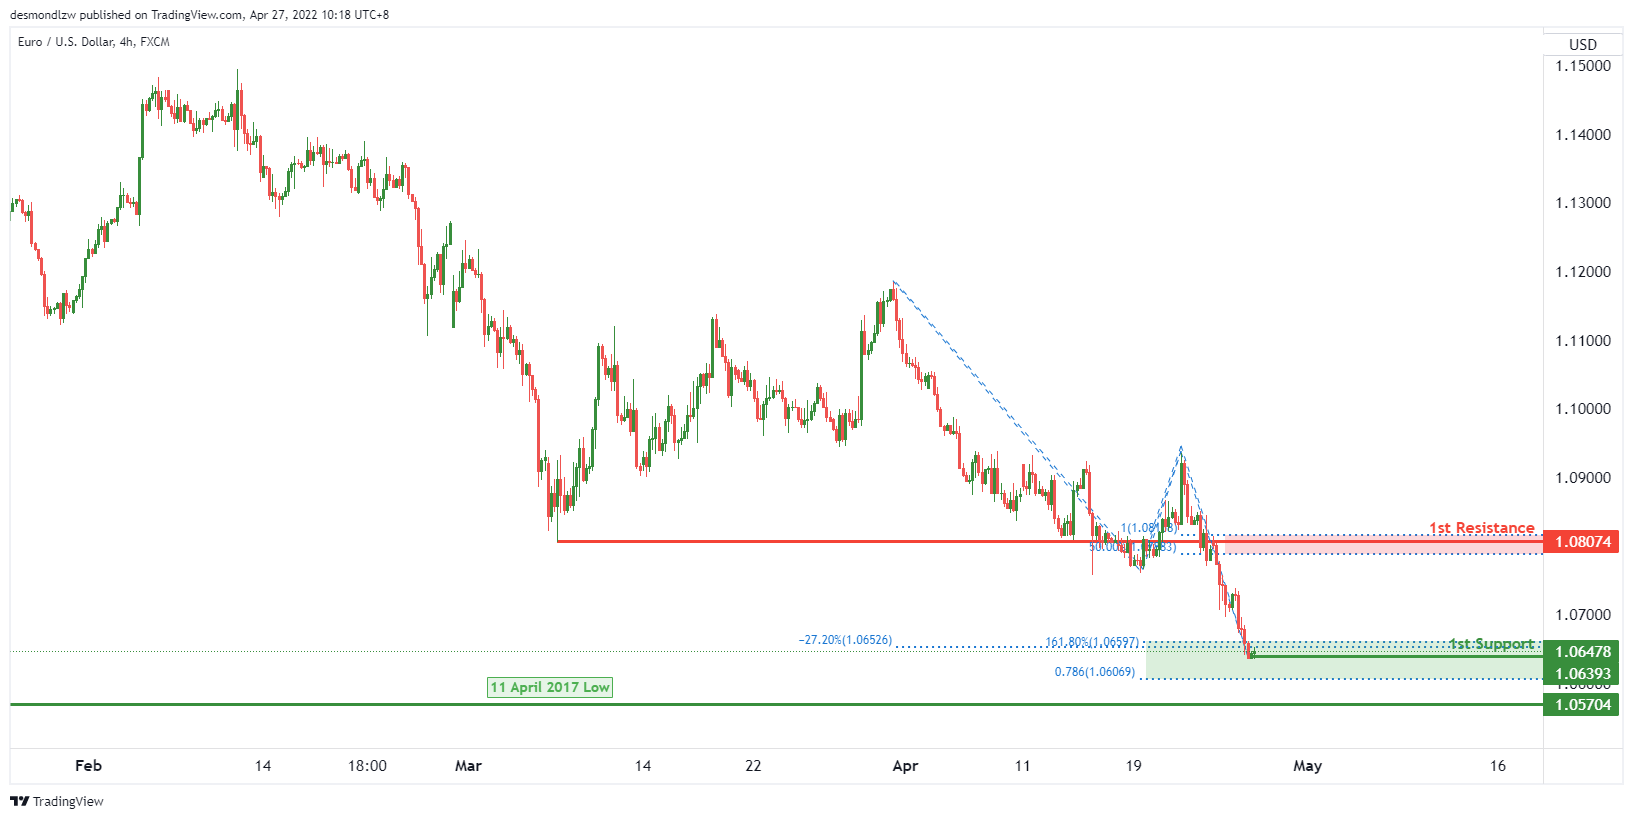
On the H4, price is near the pivot level. We expect price to potentially rise from 1st support level of 1.06393 in line with 78.6% fibonacci retracement, -27.2% fibonacci expansion and 161.8% fibonacci extension towards the 1st resistance level of 1.08074 in line with 50% fibonacci retracement and 100% fibonacci projection.
Areas of consideration :
- H4 1st resistance at 1.08074
- H4 1st support at 1.06393
- H4 2nd support at 1.05704
USD/JPY:
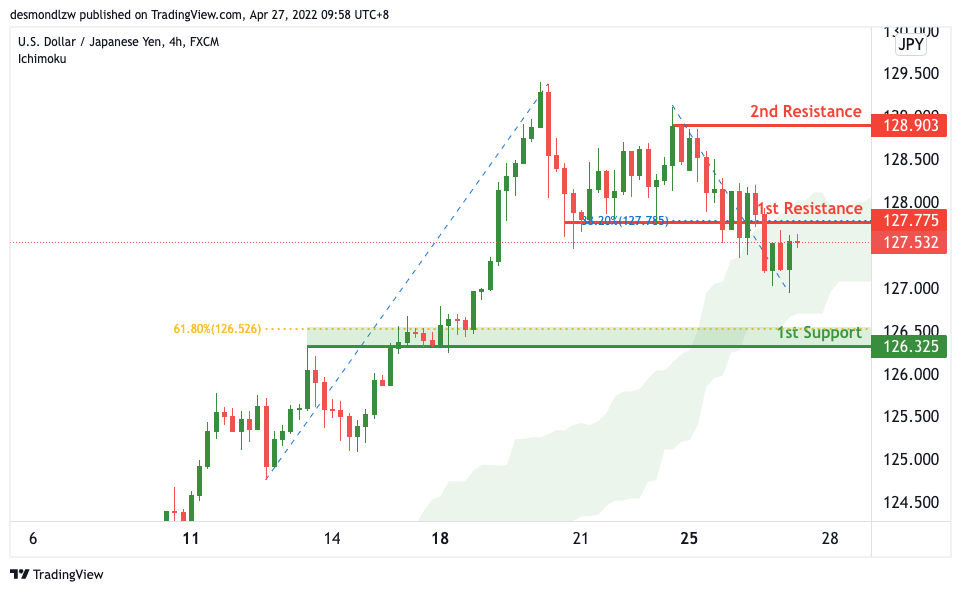
On the H4, with price moving below the ichimoku cloud indicator, we have a bearish bias that price will drop from our 1st resistance at 127.775 where the 38.2% Fibonacci retracement is to our 1st support at 126.325 in line with the horizontal pullback support and 61.8% Fibonacci retracement. Alternatively, price may break 1st resistance structure and head for 2nd resistance where the horizontal swing high resistance is at 108.903.
Areas of consideration:
- H4 time frame, 1st resistance at 128.331
- H4 time frame, 1st support at 127.667
AUD/USD:
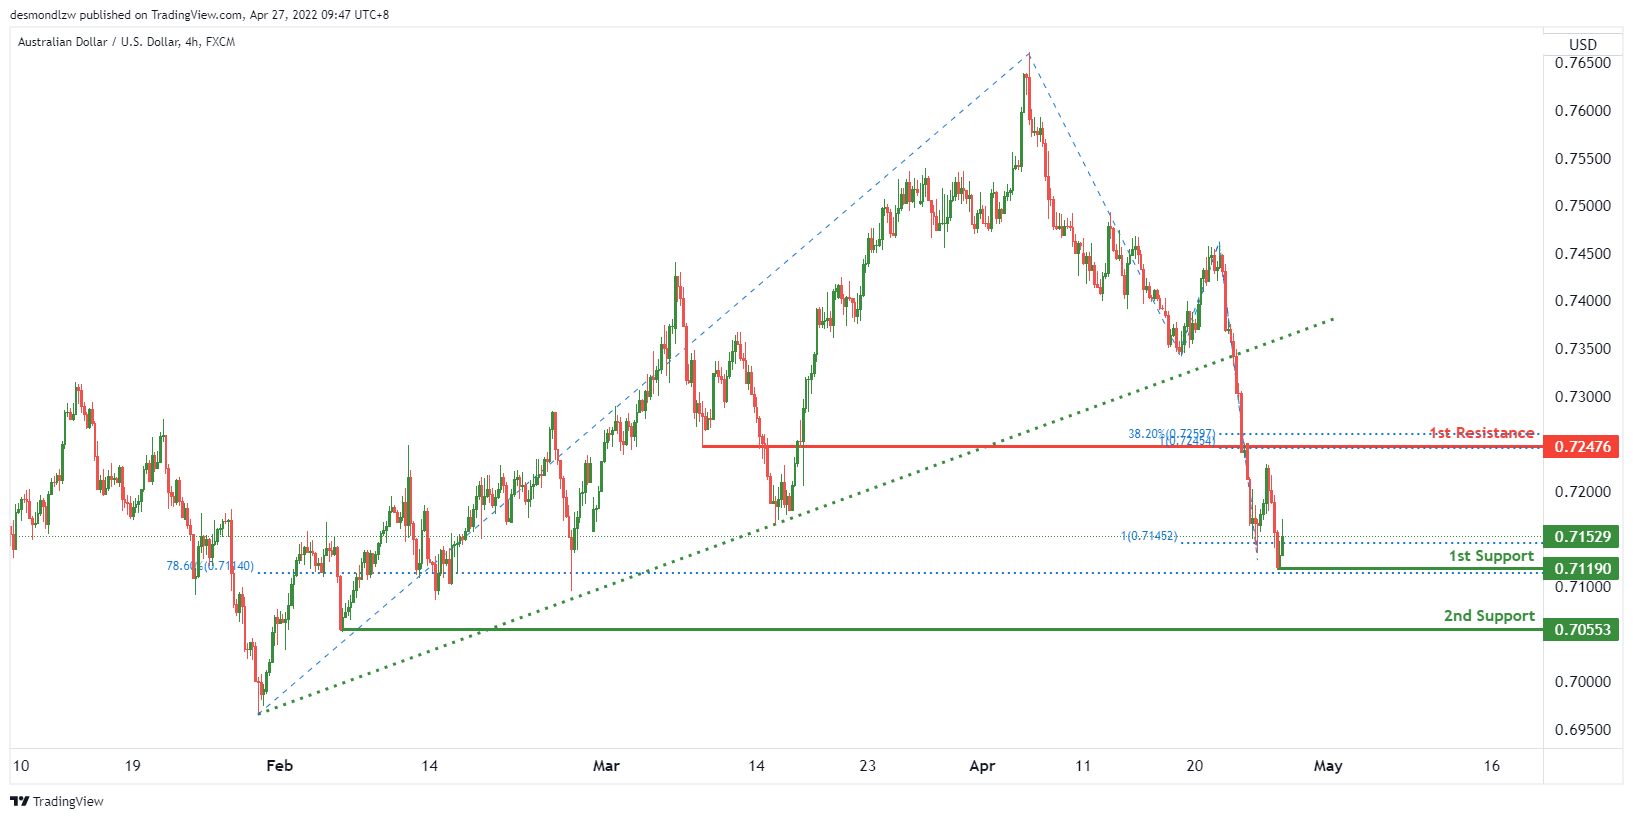
On the H4 timeframe, price is near the key support level, We see the potential of a bullish rise from 1st support level of 0.71190 in line with 78.6% fibonacci retracement and 100% fibonacci projection towards the 1st resistance level of 0.72476 in line with 38.2% fibonacci retracement and 100% fibonacci projection. Otherwise, price might break the key support level to trigger a dip towards the 2nd support of 0.70553 which is in line a previous horizontal swing low support.
Areas of consideration
- H4 1st resistance at 0.72476
- H4 1st support at 0.71190
- H4 2nd support at 0.70553
NZD/USD:
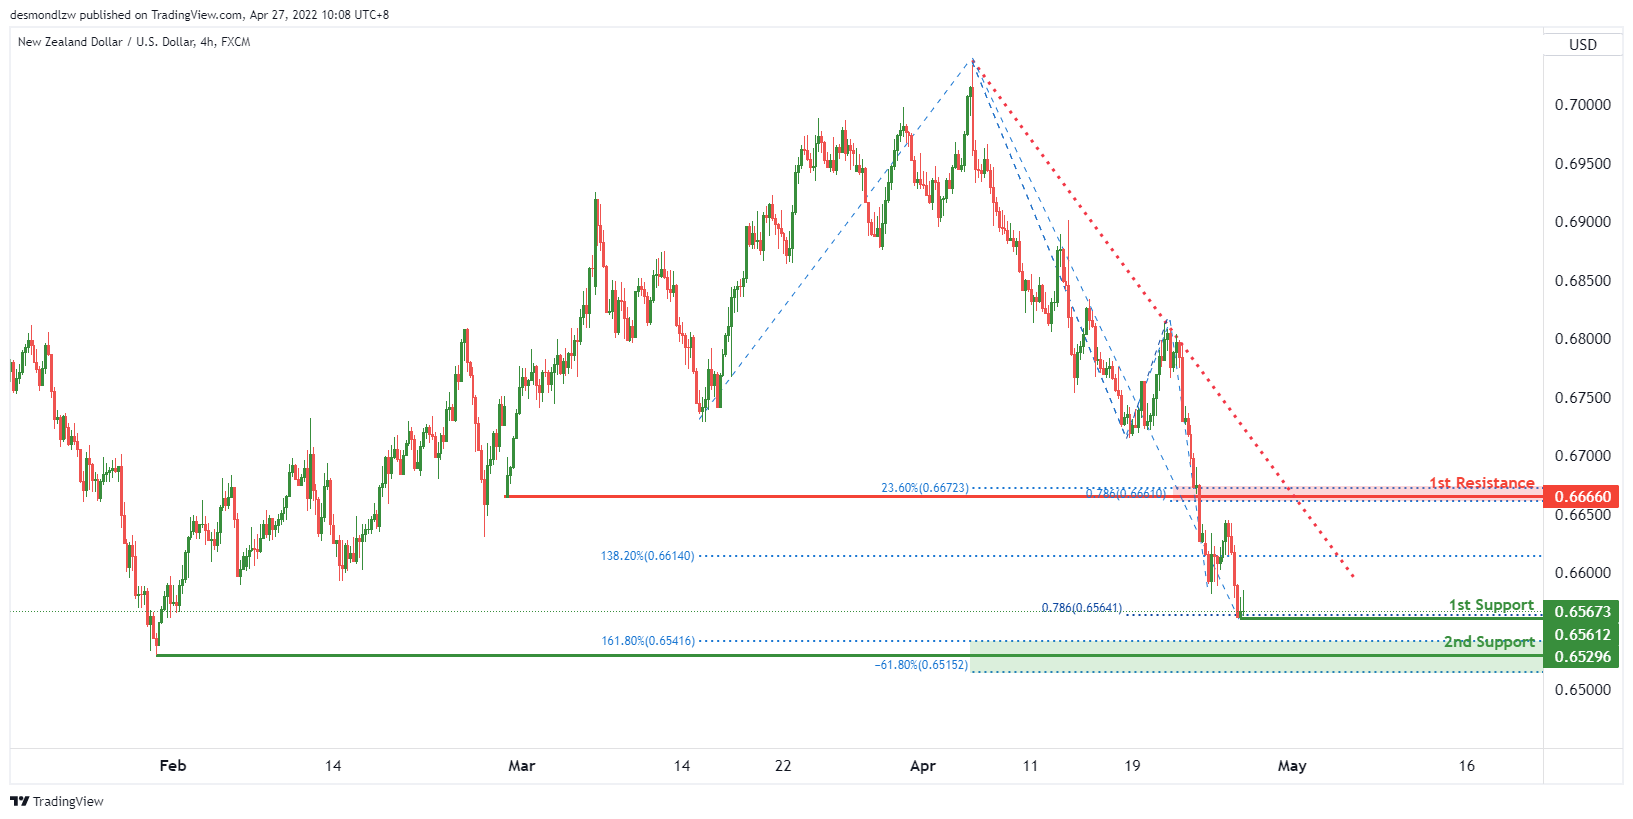
On the H4, we see the potential of bullish bounce from 1st support level of 0.65612 in line up with 78.6% fibonacci projection towards the 1st resistance level of 0.66660 in line with 23.6% fibonacci retracement and 78.6% fibonacci projection.
Areas of consideration:
- H4 time frame, 1st support at 0.65612
- H4 time frame, 1st resistance at 0.66660
- H4 time frame, 2nd support at 0.65296
USD/CAD:
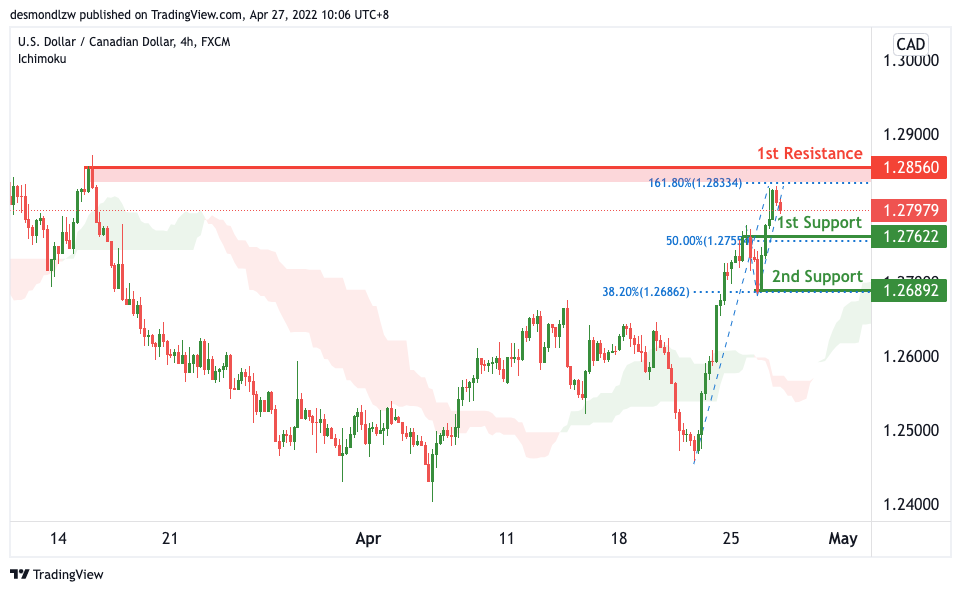
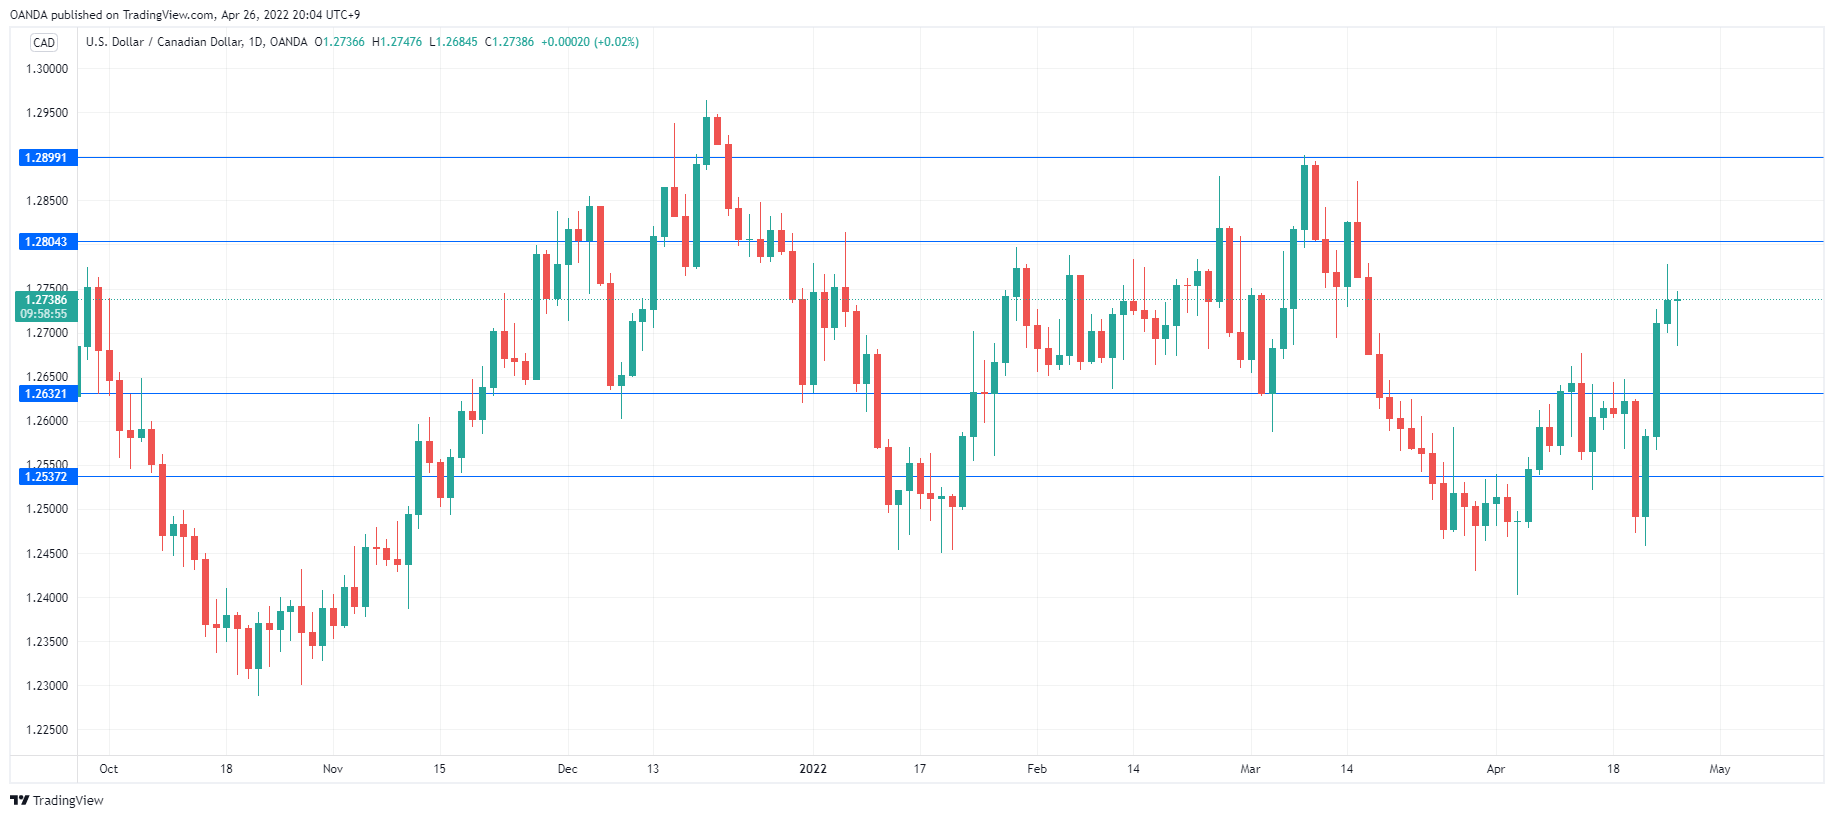
On the H4, with price moving above the ichimoku cloud, we have a bullish bias that price will rise to our 1st resistance at 1.28560 where the swing high resistance and 161.8% Fibonacci extension is from our 1st support at 1.27622 in line with the horizontal pullback support and 50% Fibonacci retracement. Alternatively, price may break 1st support structure and head for 2nd support where the horizontal swing low support and 38.2% Fibonacci retracement is.
Areas of consideration:
- H4 time frame, 1st resistance at 1.28560
- H4 time frame, 1st support at 1.27622
OIL:
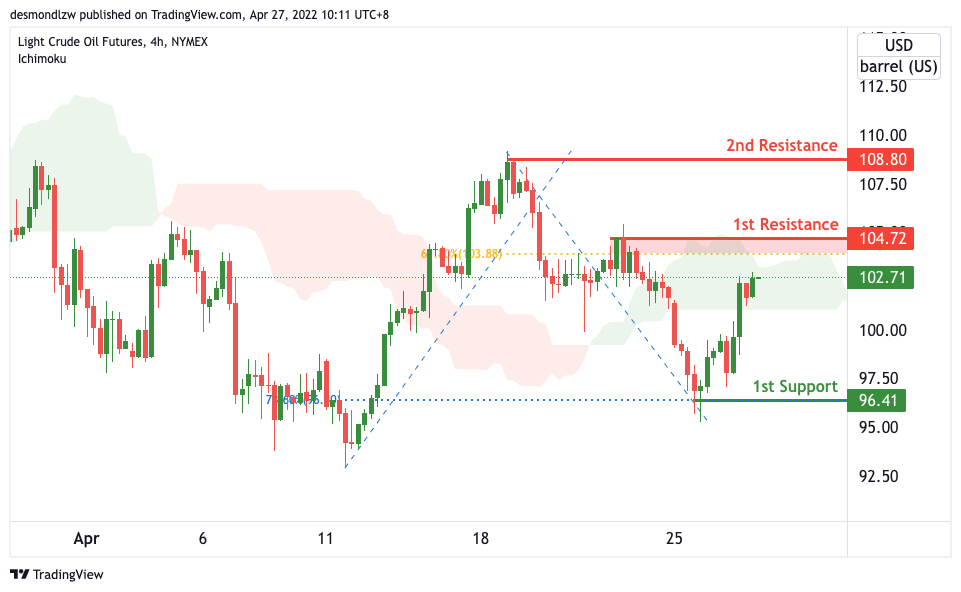
On the H4, with price expected to reverse off the resistance of the ichimoku cloud, we have a bearish bias that price will drop from our 1st resistance at 104.72 where the swing high resistance and 61.8% Fibonacci retracement is to our 1st support at 96.41 in line with the horizontal swing low support and 78.6% Fibonacci retracement. Alternatively, price may break 1st resistance structure and head for 2nd resistance where the horizontal swing high resistance at 108.80.
Areas of consideration:
- H4 time frame, 1st resistance of 104.72
- H4 time frame, 1st support of 96.41
Dow Jones Industrial Average:
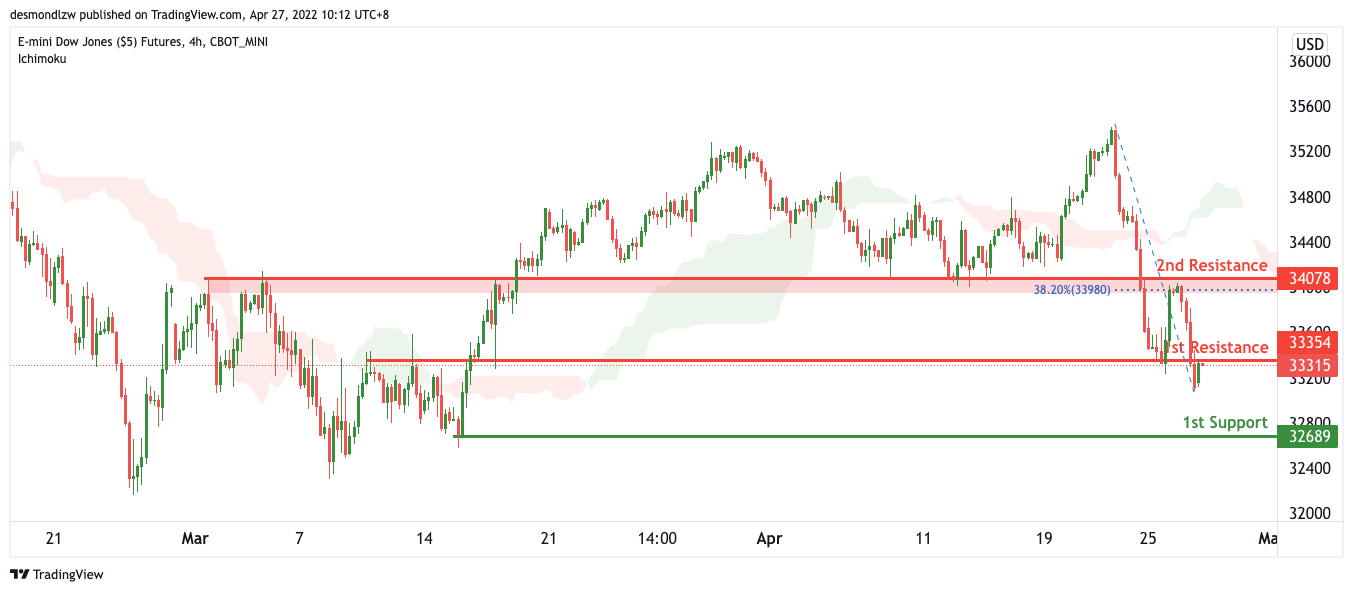
On the H4, with price moving below the ichimoku cloud, we have a bearish bias that price will drop from our 1st resistance at 33354 where the horizontal overlap resistance is to our 1st support at 32689 in line with the horizontal swing low support. Alternatively, price may break 1st resistance structure and head for 2nd resistance where the horizontal overlap resistance and 38.2% Fibonacci retracement is at 34078.
Areas of consideration :
- H4 time frame, 1st resistance at 33354
- H4 time frame, 1st support at 32689
Aust Q1 CPI – Inflationary Pressures Broad Based
Headline CPI 2.1%qtr/5.1%yr; trimmed mean 1.4%qtr/3.7%yr, weighted median 1.0%qtr/3.0%yr. The 1.4% rise in core inflation captures the broad nature of the inflationary pulse with more than 60% of the components in the CPI now running at a greater than 2.5%yr pace.
Inflation came in 2.1%, well above the market forecast of 1.7% even exceeding Westpac’s top of the range forecast of 2.0%. This was the largest quarterly rise in the CPI since the introduction of the GST. At two decimal places it was 2.14 so rounded up or softer 2.1%.
The annual pace lifted from 3.5% to 5.1% the fastest pace of annual inflation since the introduction of the GST in 2000 and significantly faster than the June 2021 print of 3.8% which was a twelve year high. While the unwinding of the HomeBuilder grants continues to be part of the story behind the boost in inflation it is the shortages of building supplies and labour, heightened freight costs and ongoing strong demand also contributed to price rises for newly built dwellings as well as a broader inflationary pulse.
This broad spread inflationary pulse was captured by 1.4% gain in the trimmed mean, both the market and Westpac were expecting 1.2%, which the ABS reports as the largest quarterly rise since the beginning of the series in 2002. If we compare to the RBA historical estimates of the trimmed mean it is the largest quarterly rise since the 1.8% print in December 1990. The 1.4% gain has lifted the annual pace of core inflation to 3.7%ry, the fastest pace since a 4.1%yr print in March 2009. The ABS reports the lift in core inflation “reflected the broad-based nature of price rises, as the impacts of supply disruptions, rising shipping costs and other global and domestic inflationary factors flowed through the economy."
This widespread nature of this inflationary pulse was further emphasised by the rise in the share of components of the CPI running faster than a 2.5%yr pace. The share lifted to 66% from 32% in March, the largest share of the CPI components running faster than 2.5%yr since December 2001 (post the introduction of GST).
At two decimal places the trimmed mean rose 1.37% so a hard 1.4%; for history the weighted median gained 1.0% for 3.2%yr.
The ABS reports that most significant price rises were for new dwelling purchase by owner-occupiers (5.7% vs 5.4% WBC), automotive fuel (11.0% vs 10.9% WBC) and tertiary education (6.3% vs. WBC 2.4%). Also worth noting were the strong gains in food (2.8% vs 2.1% WBC) along with the unseasonal rise in furniture & furnishings (1.1% vs -1.1% WBC) and communication (0.3% vs flat WBC)
The ABS provides more details on food noting that the increases reflected high transport, fertiliser, packaging and ingredient costs, as well as Covid-related disruptions and herd restocking due to favourable weather. Main contributors to the rise in food prices included vegetables (6.6% vs 8.7% WBC), waters, soft drinks & juices (5.6% vs 1.7% WBC), fruit (4.9% vs 3.9% WBC) and beef (7.6% vs 3.4% WBC).
Inflationary pressures in the food group was softened by voucher programs in Sydney and Melbourne, which reduced out of pocket costs for meals out & takeaway foods. The grocery component of the group, which excludes meals out and takeaway foods, rose 4.0%. Prices for other grocery items, such as non-durable household products which includes products such as toilet paper and paper towels, rose 6.7% in the March quarter.
The ABS reported that automotive fuel rose for the 7th consecutive quarter, resulting in the strongest annual rise since the Iraqi invasion of Kuwait in 1990. It was also a record level for auto fuel due to an oil price shock caused by the Russian invasion of Ukraine, paired with ongoing easing of Covid-19 restrictions strengthening global demand. The national quarterly average price for unleaded petrol was $1.83 per litre in the March quarter. The halving of the fuel excise in the recent budget will have will be a meaningful disinflationary force in the June quarter but this will be reversed when the excise is reinstated in the December quarter.
The ABS continues to report a two-speed rental market in Australia but as we expected Sydney and Melbourne shifted from negative to positive gains for rents. Rents across the remaining capital cities continue to record relatively stronger rises, reflecting historically low vacancy rates. The positive growth in rents for Sydney and Melbourne was mainly driven by rising rents for houses, while other dwellings recorded a relatively smaller rise in Sydney and a small fall in Melbourne. Rental conditions for other dwellings remained subdued in Melbourne reflecting higher vacancy rates. Rents for both houses and other dwellings increased at a similar rate in the remaining capital cities.
Non-discretionary annual inflation (6.6%yr) was higher than the CPI (5.1%yr) and more than twice the rate of discretionary inflation. (2.7%yr). Non-discretionary inflation includes goods and services that households are less likely to reduce their consumption of, such as food, automotive fuel, housing and health costs which have all experienced price rises through the year. In the quarter non-discretionary items 3% driven by housing, auto fuel and food.
We are processing this data and will review what implications it has for our CPI forecasts. But it is worth noting that the 5.1%yr pace in annual CPI inflation is already higher than our forecast peak of 4.9%yr. The 3.7%yr pace in core inflation (trimmed mean) is narrowing in on our forecast peak of 4.0%yr in the September quarter.
Gold Price Trims Gains, $1,890 Is The Key
Key Highlights
- Gold price started a fresh decline and traded below $1,920.
- It traded below a key bullish trend line with support near $1,955 on the 4-hours chart.
- EUR/USD extended decline below 1.0700, and GBP/USD traded below 1.2600.
- Crude oil price declined below $100 but found support near $95.50.
Gold Price Technical Analysis
Gold price struggled to stay above the $1,950 support against the US Dollar. The price started a fresh decline after it settled below $1,950 and $1,940.
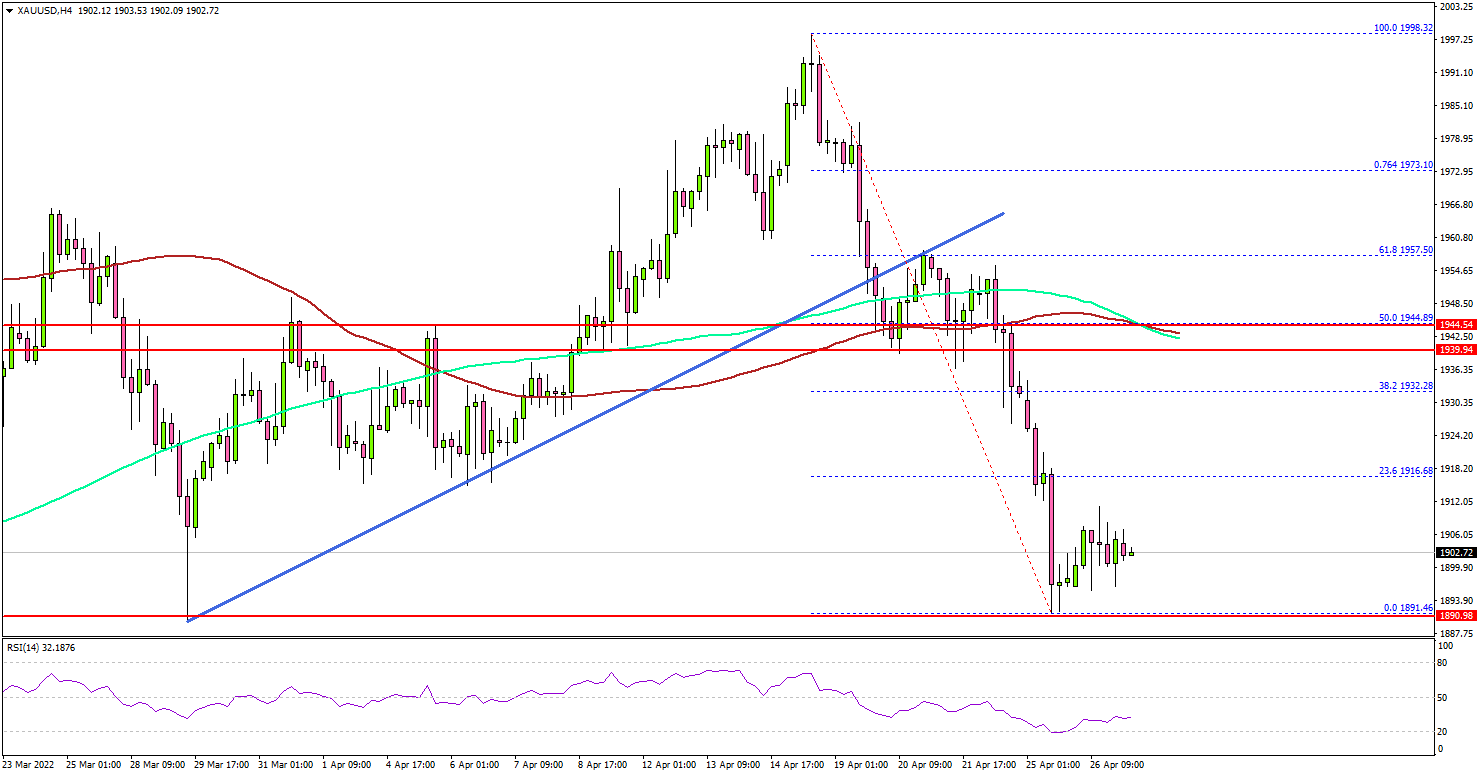
The 4-hours chart of XAU/USD indicates that the price traded below the $1,920 support zone. There was also a move below the $1,900 level, and the price settled below the 100 simple moving average (red, 4-hours) and the 200 simple moving average (green, 4-hours).
It retested the key $1,890 support area, where the bulls emerged. It is now consolidating losses above $1,890. On the upside, the price might face resistance near $1,915.
The next key resistance could be $1,920, above which the bulls might aim a move towards the main resistance at $1,945. The 100 simple moving average (red, 4-hours) and the 200 simple moving average (green, 4-hours) are also near the $1,945 zone to act as a resistance.
If there is no upward move, the price could decline below the $1,890 support. The next major support is near the $1,865 level, below which it could even test $1,850.
Looking at EUR/USD, the pair is still trading in a bearish zone and there was a move below the 1.0700 support. Similarly, GBP/USD resumed its decline below 1.2600.
Economic Releases to Watch Today
- Germany’s GfK Consumer Confidence for May 2022 – Forecast -16.0, versus -15.5 previous.
- US Pending Home Sales for March 2022 (YoY) - Forecast -1.7%, versus -4.1% previous.
Elliott Wave View: EURJPY Correcting 5 Waves Move
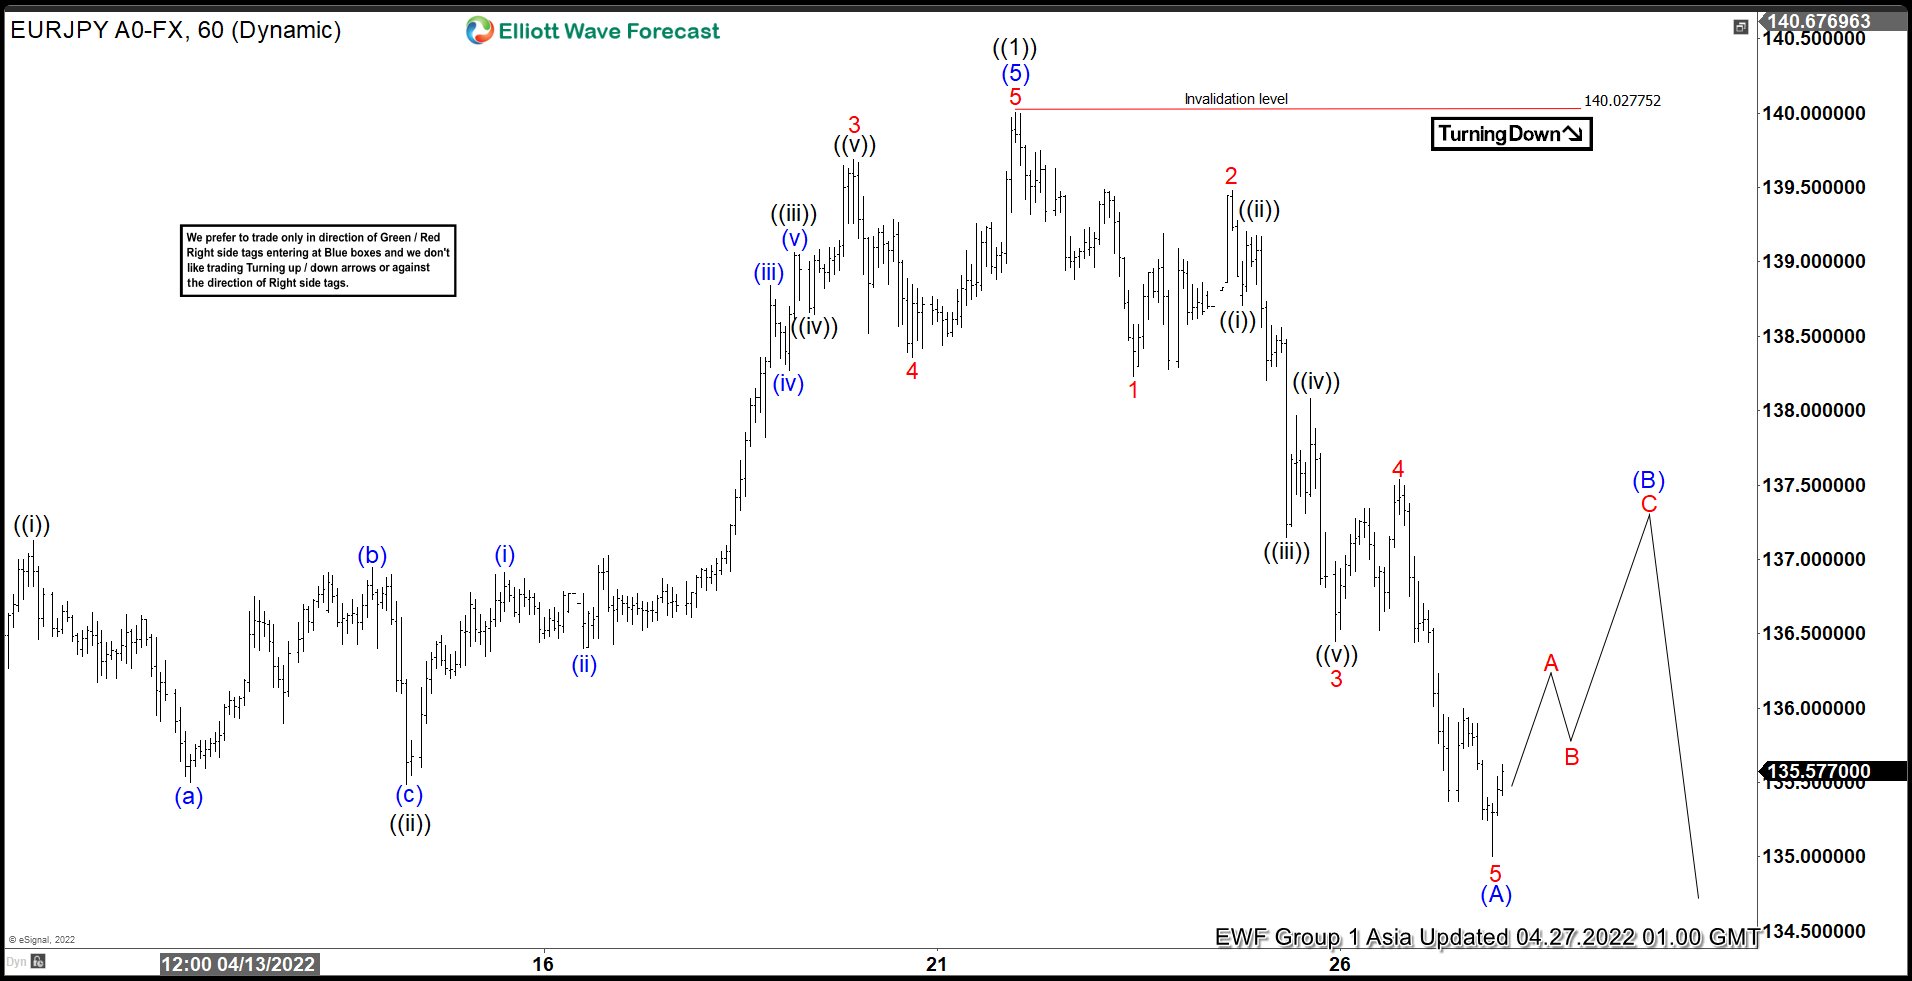
EURJPY shows a bullish sequence from June 2016 low and May 2020 low. Long term, pair should be supported and continue higher. Short term, however, pair has ended the rally from March 7, 2022 low at 140 with wave ((1)). Wave ((2)) pullback is currently in progress to correct the rally from March 7 low before it resumes the rally again. Wave ((2)) is unfolding as a zigzag Elliott Wave structure. Down from wave ((1)), wave 1 ended at 138.23 and rally in wave 2 ended at 139.48. Pair then resumes lower in wave 3 towards 136.45 and rally in wave 4 ended at 137.54. Final leg lower wave 5 ended at 135 which also completed wave (A).
Pair should rally in wave (B) to correct cycle from April 21 before the decline resumes. Internal of wave (B) is proposed to unfold in 3 waves taking the form of zigzag structure before the next leg lower. Expect pair to extend higher to end wave A, then it should pullback in wave B before another leg higher in wave C to complete wave (B). Afterwards, pair should resume lower in wave (C) of ((2)). Near term, as far as April 21 pivot high at 140 remains intact, expect the rally to fail in the sequence of 3, 7, or 11 swing for further downside.
EURJPY 60 Minutes Elliott Wave Chart
Bank of Japan to defend yield curve control policy, but what about the yen?
The Bank of Japan concludes a two-day monetary policy meeting on Thursday and even though no changes are anticipated, its language on the exchange rate might prove decisive for the yen. As other central banks race to normalize policy amid the global spiral in inflation, the BoJ has stuck to its ultra-accommodative policy, stepping up its purchases of Japanese Government Bonds (JGBs) over the last month. But this has come at a cost as the yen has plunged to 20-year lows against the US dollar. Will the BoJ make any attempt to sound less dovish this week?
No inflation panic at the BoJ
Although Japan is not yet experiencing the same inflationary pressures as the United States and other countries, there is no question that prices are on the rise. The consumer price index hit 1.2% year-on-year in March – the highest since October 2018. Core CPI that excludes fresh food prices and is targeted by the Bank for its 2% goal rose by a more modest 0.8%.
This partially explains why the BoJ is a lot more relaxed about surging prices than its peers. Not only has inflation yet to reach 2%, but policymakers can afford to let it rise above target for a while after decades of deflation. The other reason is that Governor Haruhiko Kuroda is now the lone central bank chief that still thinks this episode of excessive inflation will be temporary. Only last week Kuroda reinforced his view that inflation in Japan is being driven mainly by the cost-push shock due to supply factors and therefore “lacks sustainability”.
Weak yen: a new headache?
Until there is more evidence that higher inflation is becoming embedded into the economy, Kuroda is unlikely to change his stance. But if that risk alone is not enough to alter policy course at the Bank of Japan, another might. The yen has come under intense selling pressure since early March when the sanctions against Russia sent inflation expectations soaring and the government bond yields of major economies to multi-year highs, except of course for JGB yields.
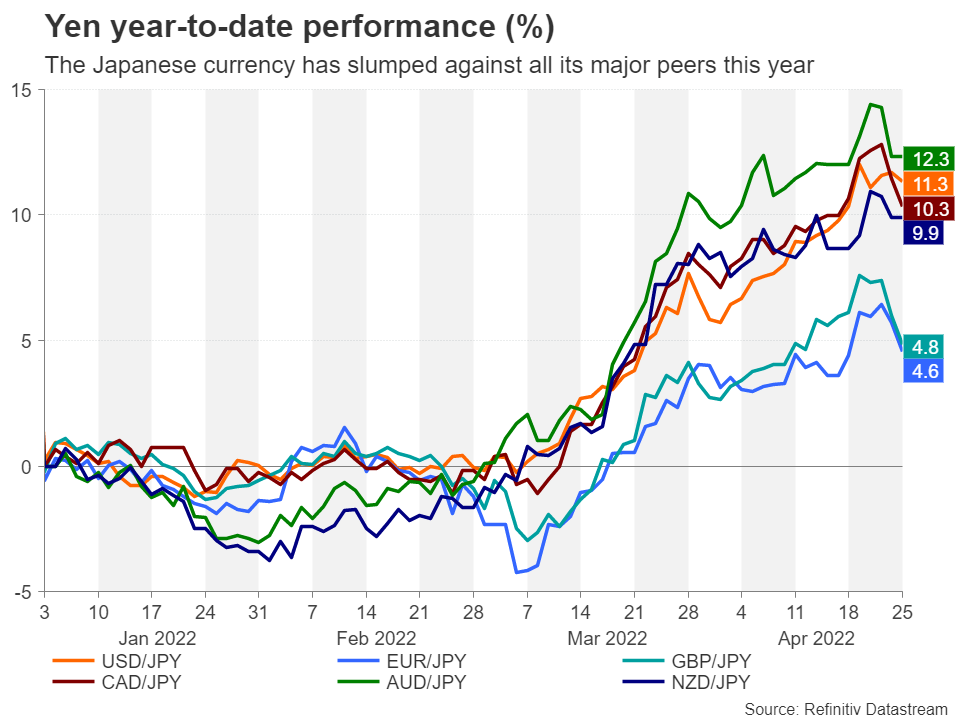
The widening yield differentials, especially with the US, have been an unexpected headache for the BoJ. Kuroda is not particularly mindful of a weaker yen but the Japanese government is, putting him at odds with Finance Minister Shunichi Suzuki who decides on exchange rate policy. Japanese businesses have also been complaining about the slump in the value of the yen. Although exporters tend to benefit from a devalued currency, any benefits from cheaper exports are being negated by the increased cost of imports, which is additionally being exacerbated by the huge jump in energy and raw material prices.
All eyes on the forward guidance
It's possible the BoJ will add something about the yen in its statement, to demonstrate that it is worried about a rapid fall in the currency. But what would send a more convincing signal to the markets that the Bank isn’t prepared to let the yen slide much further is an updated forward guidance that is less dovish.
Even if Japan has some way to go before inflation turns into a big problem, it may not be feasible for much longer for the BoJ to pin the 10-year yield near zero per cent. Liquidity in the bond market is drying up fast as the central bank snaps up all the available JGBs. So maintaining its yield curve control policy in its current form may become impossible if yield spreads keep widening in favour of the dollar and other rival currencies.
Yield curve control may be tweaked
The BoJ may hint that it is open to allowing the 10-year yield to fluctuate within a wider range than the current target band of 25 basis points above or below zero. Another option is to switch the target from 10-year JGBs to shorter-dated bonds.
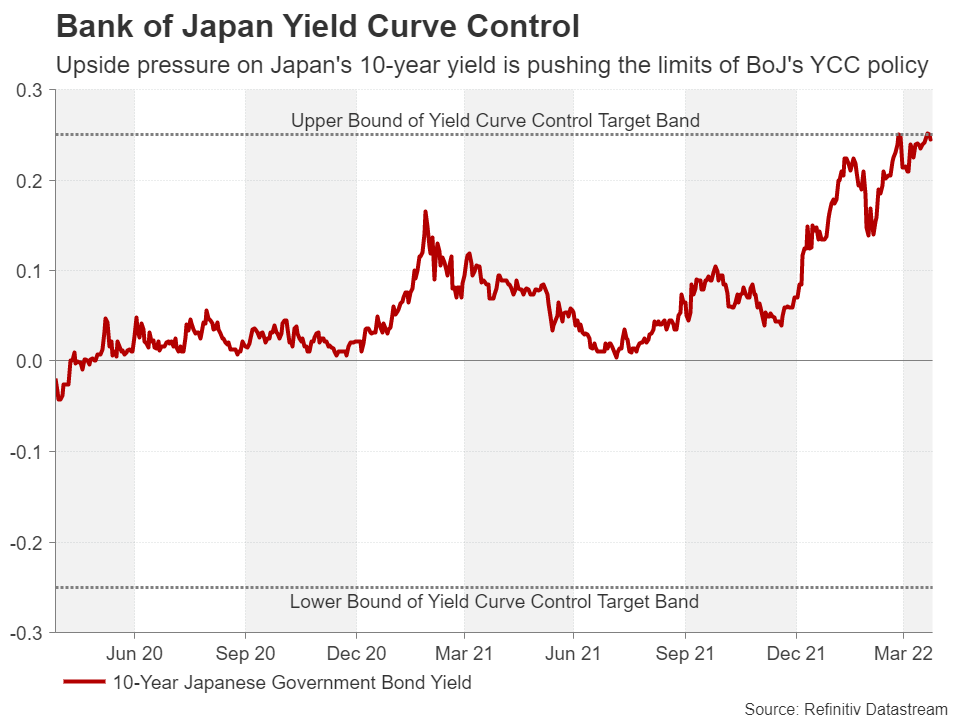
Although such policy tweaks would still leave the BoJ miles away from hiking its benchmark lending rate, which is stuck at -0.1%, they would nevertheless be a significant step towards normalization. Hence, there is scope for the yen to make notable gains on the back of a policy shift.
Yen has steadied, but 130/dollar remains within reach
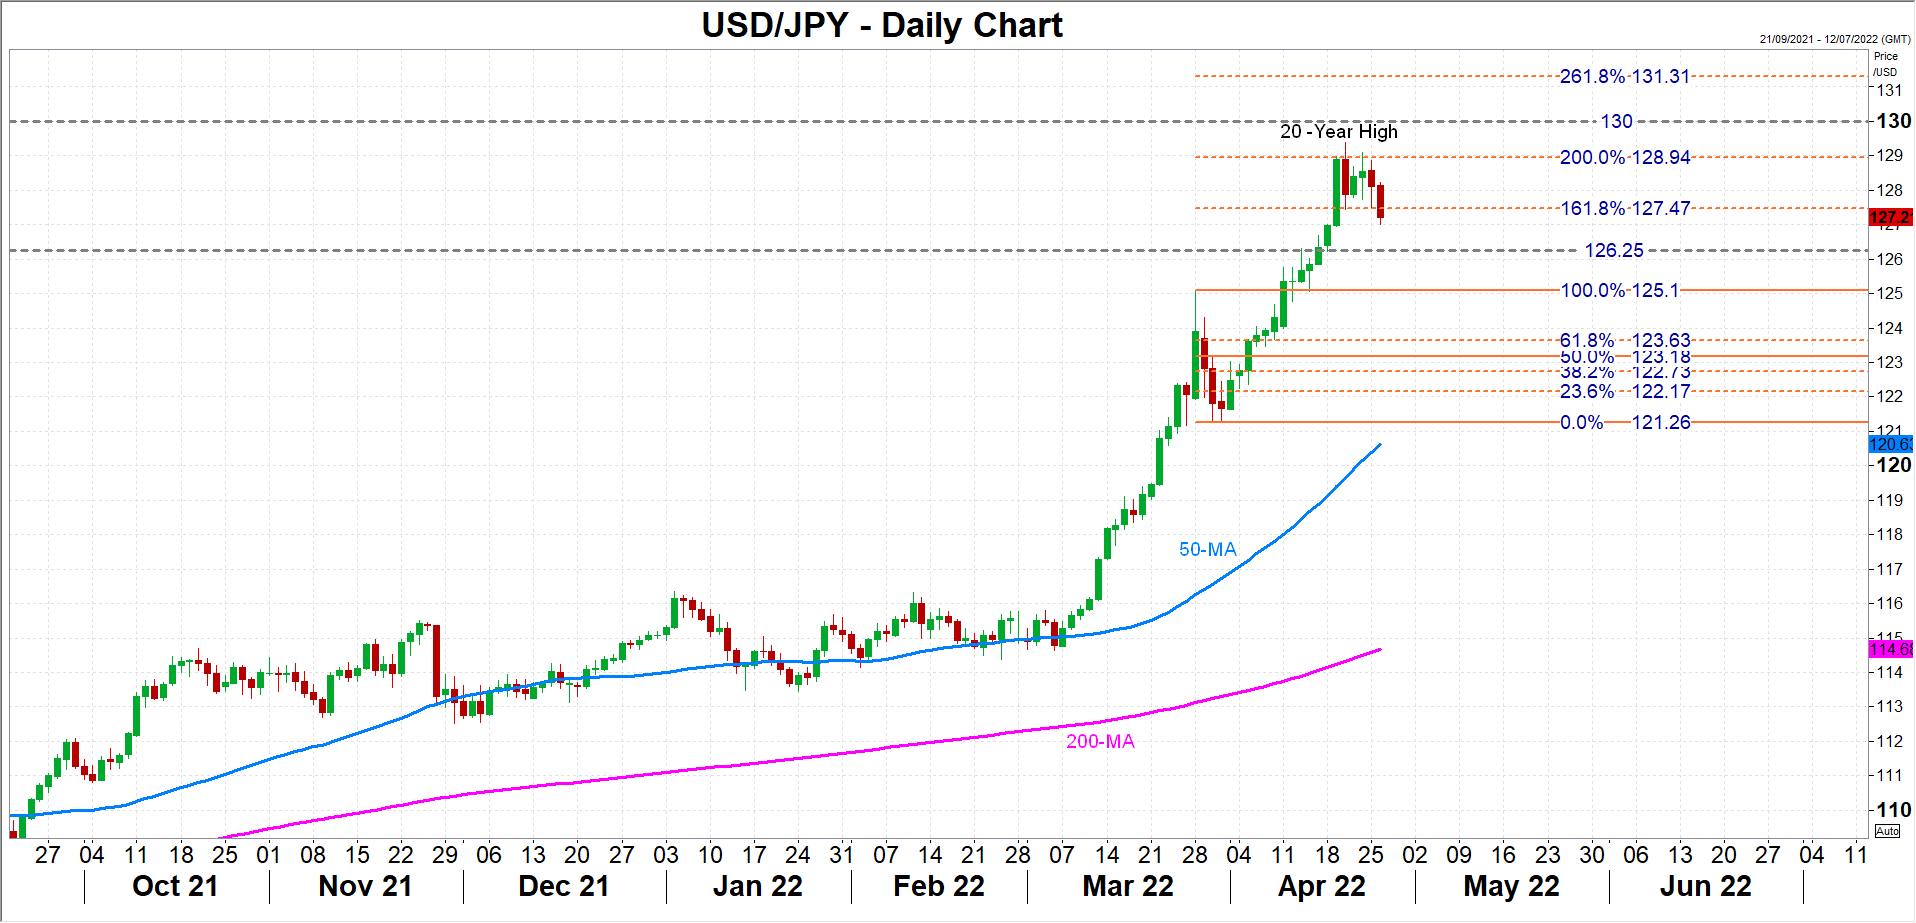
The dollar has eased to just above the 127-yen level, as the Japanese currency has benefited from some safe-haven flows in the last few sessions. Should the pair retreat further, the 126.25 mark is a potential support area, otherwise, the decline could stretch until the March peak of 125.10.
However, if the BoJ decides to wait until its June or July meetings before telegraphing or announcing any policy changes, dollar/yen could resume its rally and aim for the crucial 130 level. The 200% Fibonacci extension of the March downleg just below 129 could obstruct any advances before reaching this point, while above it, the 261.8% Fibonacci of 131.31 would be the next target for yen bears.
Inflation forecast to be revised up
In the absence of any explicit signals, investors will have to search for clues in the BoJ’s latest quarterly outlook report. The Bank is expected to revise up its forecasts for inflation but will probably cut its projection for economic growth for the current fiscal year. However, what will matter more is whether policymakers put greater emphasis on the upside risks to inflation than on the downside dangers to growth as this would be a better indication on the pace of future policy tightening.
Australian Dollar Falls Below 0.72
Aussie steady after nasty slide
The Australian dollar has stabilized after a sharp downturn, losing over 300 points since Thursday. AUD/USD is trading below the 72 line and is close to a 2-month low.
All eyes are on Australia’s inflation report for March, with CPI expected to accelerate to 4.6% YoY, after a 3.5% gain in February. This would mark the highest rate of inflation since the GFC, as soaring food and fuel prices continue to drive inflation higher. If March CPI comes in as expected, the RBA may well respond with an oversize 0.40% increase at the policy meeting on May 3rd. This means that a strong inflation report should give the Australian dollar a boost.
The central bank, which last raised rates in 2010, would prefer to stay on the sidelines during the current election campaign or raise rates by a very modest 0.15%. The problem is that with inflation showing no signs of easing, policymakers may feel they can’t wait until June to hike rates.
The Federal Reserve, which has already embarked on its rate-hike cycle, has been sending out hawkish messages to the markets. Last week, Fed Chair Powell reiterated that a 0.50% rate increase was on the table, and according to CME’s Fed Watch, there is a 98% likelihood of a 0.50% hike at the May 4th meeting. With the Fed expected to tighten rates to 3% or higher by the end of the year, the rate-hike cycle should boost the US dollar in the coming months.
The Australian dollar, which was trading just shy of the 0.76 in early April, benefited from the surge in commodity prices. Now that commodities, especially iron ore, are falling in price, the Aussie is dropping along for the ride. Concerns over China’s growth are also weighing on the Australian dollar, as China is Australia’s number one trading partner.
AUD/USD Technical
- There is resistance at 0.7253 and 0.7390
- AUD/USD has broken through support at 0.7167. Below there is support at 0.7089
Dollar Index: Dollar Remains Well Supported and Could Extend Higher than Expected
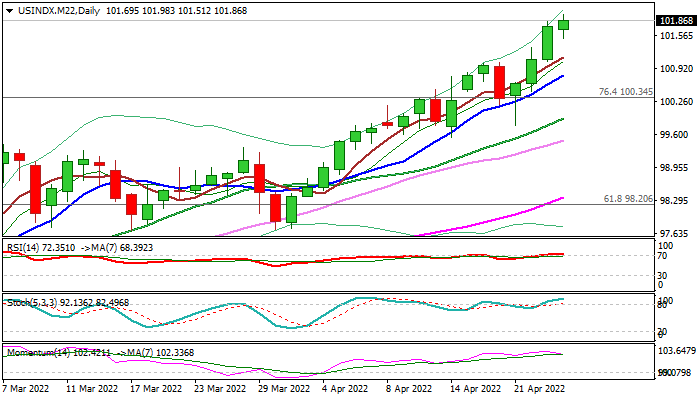
The dollar continues to trend higher and hit new two-year high on Monday, with recent rapid rise being underpinned by safe-haven buying and expectations of more aggressive Fed.
Growing uncertainty over the consequences of the conflict in Ukraine and its possible escalation, prompts traders out of riskier assets into safe-haven dollar, while markets bet on stronger than expected action from the US central bank in tightening monetary policy in attempts to tame raging inflation, as the rhetoric from the US policymakers becomes more hawkish lately.
The dollar index rose over 5% since the war in Ukraine started, with strong acceleration seen in April that marks the biggest monthly advance since May 2010.
Strong uptrend can extend towards March 2017 high at 102.26, the last obstacle en-route to key barriers at 103.80 (peaks of Jan 2017 / Mar 2020), as bulls so far show no signs of fatigue, with fundamentals being dollar’s main driver and remaining strongly supportive.
Overbought studies warn of minor price adjustment which should stay above psychological 100 support and offer better levels to join the uptrend.
Res: 102.00; 102.26; 102.71; 103.00
Sup: 101.51; 101.00; 100.78; 100.34