Sample Category Title
EUR/USD Resumes Weakness after Hawkish Powell’s Comments
The risk-off is in full swing following FOMC Jerome Powell speech, who mentioned that they are planning to get interest rates "expeditiously" to neutral. Powell acknowledged that 50 basis points rate hikes will be on the table at the upcoming meetings. US yields are again ticking higher/US notes lower while the USD is up sharply across the board. We see commodity currencies acting very weak as well, so it appears there is more weakness ahead, especially for next week if the stock will remains bearish through the US session today. Keep in mind that daily and weekly closing prices are the most important prices, and give us a lot of important indications for the upcoming week.
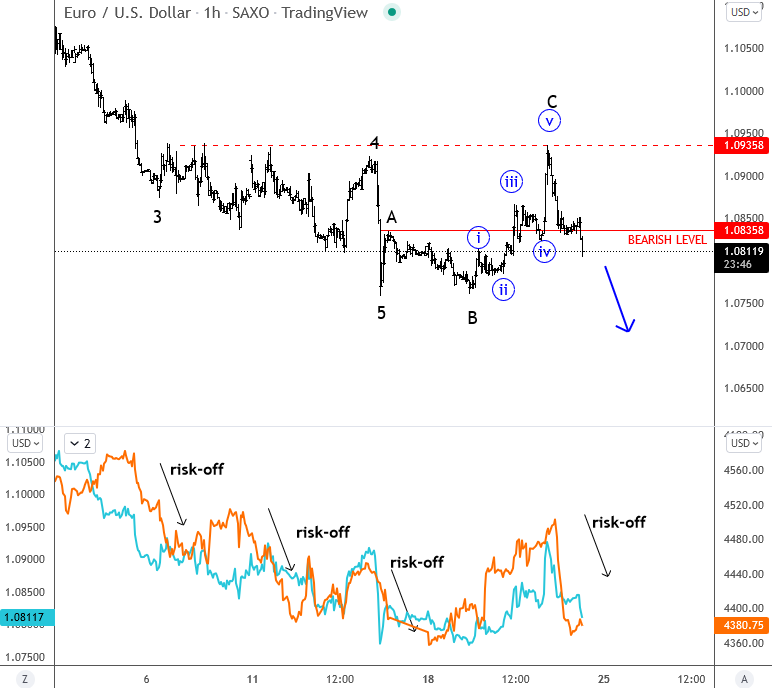
EURUSD is also down, despite the fact that ECB policymakers said they are ready to hike the policy rate as early as July. However, there is still a big gap between the policy of US and FED CB so pair remains in a downtrend and it may retest 1.0700 area as the recent rally in three waves stopped at 1.0935 resistance.
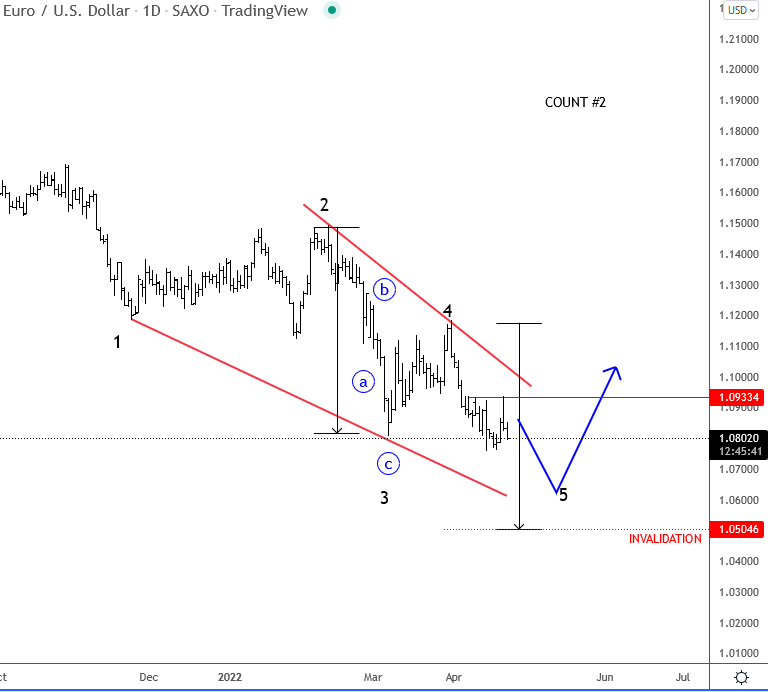
However, big wedge on the EURUSD may indicate a potential limited weakness in upcoming weeks, but we will need more aggressive and hawkish ECB tone for a bounce.
USDCAD bounces back from dip but neutral outlook unchanged
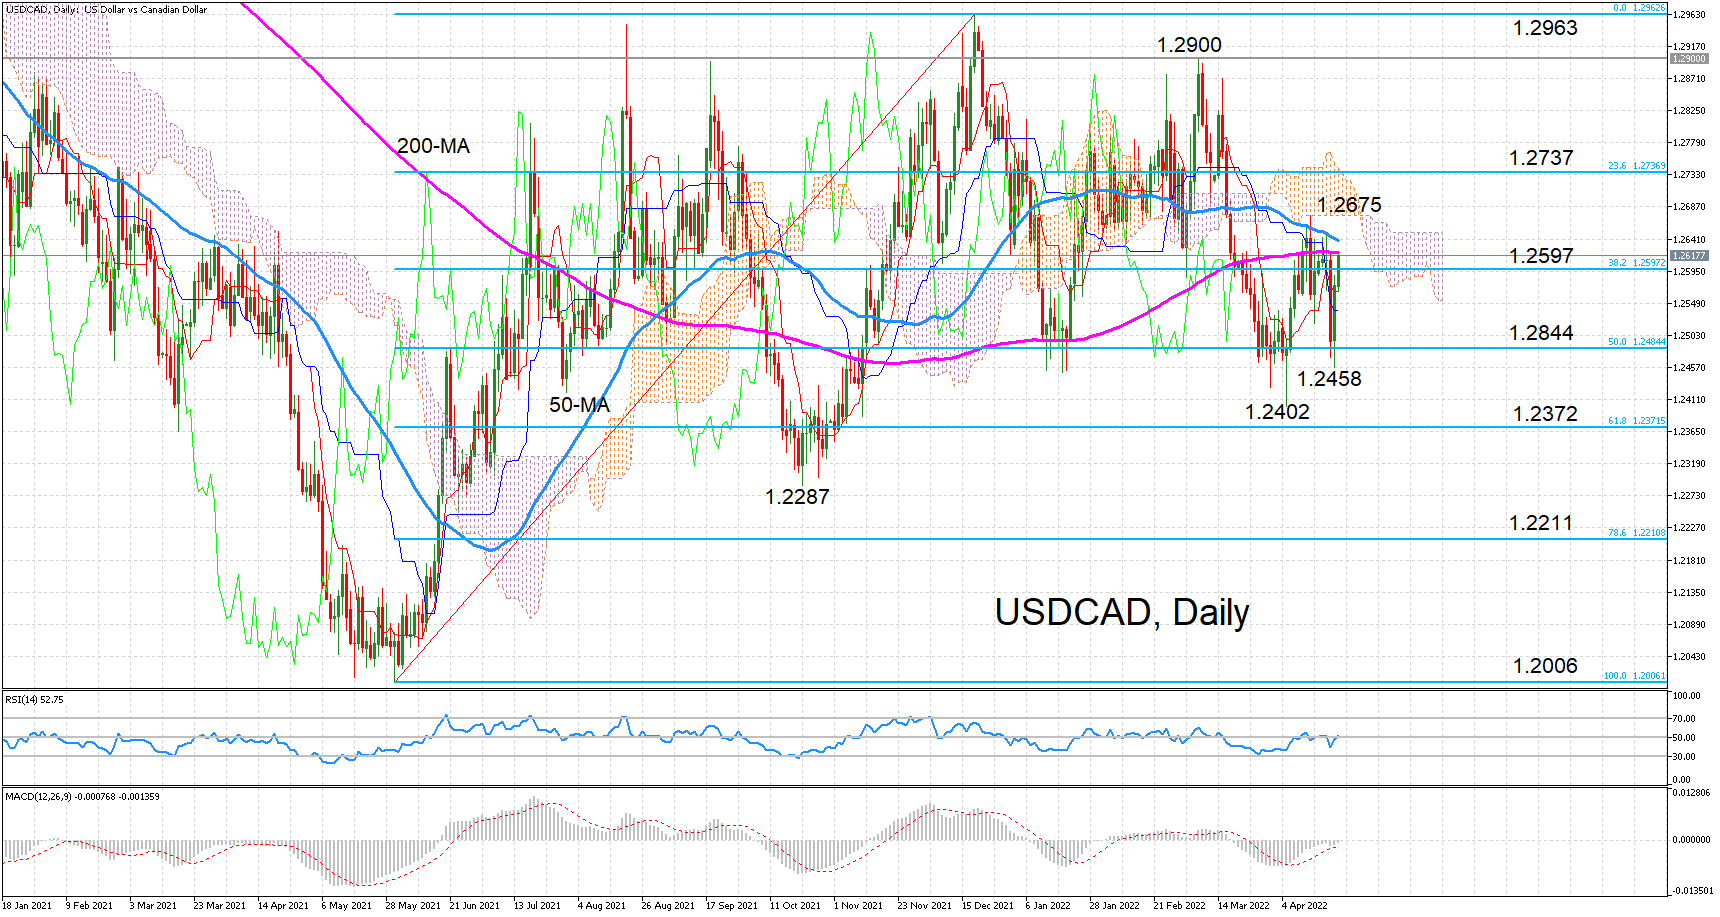
USDCAD has bounced back towards its 50- and 200-day moving averages (MA) after dipping to a more than two-week low of 1.2458 on Thursday. The price is currently testing the 38.2% Fibonacci retracement June-December 2021 uptrend at 1.2597 and there is a strong prospect of further gains in the short term.
The RSI is in the process of climbing above the 50-neutral point, while the MACD histogram is continuing to advance higher above its red signal line and could soon cross into positive territory.
If the bullish bias holds and USDCAD manages to overcome the immediate resistance of the 38.2% Fibonacci just below the 1.26 level, there are further tough obstacles ahead. The 200-day MA is at 1.2621 and slightly higher at 1.2639 is the 50-day MA, which is heading towards it for a bearish cross.
A successful break above this resistance zone would strengthen the upside momentum but the bulls would then have to battle the 1.2675 mark to enter the Ichimoku cloud, while the 23.6% Fibonacci of 1.2737 could block the exit out of the cloud. Nevertheless, clearing the cloud would pave the way for the crucial 1.2900 level, which was the March peak.
To the downside, the April lows of 1.2458 and 1.2402 could halt the declines from reaching the October 2021 trough of 1.2287 should the positive bias fade and bearish forces take over. However, if those support barriers give way and the losses deepen all the way till the 78.6% of 1.2211, the neutral outlook in the medium term would also turn bearish.
To sum up, although the positive momentum is gathering steam in the very near term, the neutral pattern in the bigger picture remains intact. Unti the price approaches the upper region of this range, starting with the 1.29 level, it’s hard to see a bullish shift taking place.
AUD/USD: Extended Weakness Pressures Key Supports
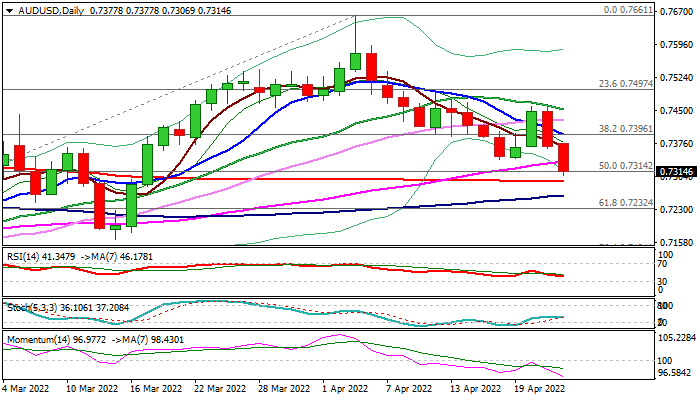
The Australian dollar extends strong fall into second day (the pair was down 1.02% on Thursday and fell nearly 1% in early Friday), hitting new five-week low and pressuring key supports.
The Aussie came under fresh pressure on risk aversion over uncertainty about the conflict in Ukraine and worries about China’s economic growth.
Fresh weakness completed a failure swing pattern on daily chart that signals continuation of downtrend from 0.7661 (Apr 5 high).
Bears cracked pivotal Fibo support at 0.7314 (50% retracement of 0.6967/0.7661 rally) and pressure key levels at 0.7292/83 (200DMA / daily cloud top) violation of which would add to bearish signals and open way for deeper drop towards 0.7232/04 (Fibo 61.8% / daily cloud base).
Daily studies maintain strong bearish momentum that supports the action, however bears may slow on headwinds from 200DMA and rising cloud top, but will remain in play while the price holds below 0.7400 (falling daily Tenkan-sen).
Res: 0.7332; 0.7369; 0.7397; 0.7428
Sup: 0.7292; 0.7283; 0.7261; 0.7232
US Dollar Bounces Back, Stocks Retreat after Hawkish Powell Statement
The US dollar rose while stocks retreated after a hawkish statement by Jerome Powell, the Fed chair. In a speech at an IMF forum, Powell signaled that the central bank was likely to hike rates by 0.50% in May this year. He also noted that the bank will start shrinking its $9 trillion assets in a process known as quantitative tightening. His statement mirrored that of Mary Daly, another Fed official, who said that it was necessary to be aggressive in rate hikes. The Fed minutes published last week also showed that officials were looking forward to more hikes. The challenge is that these hikes will not help to slow inflation since it is caused by external factors like the war in Ukraine.
The British pound declined against the US dollar ahead of the latest UK retail sales data. The numbers, which will be published by the Office of National Statistics (ONS), are expected to show that sales declined by 0.3% in March while core sales fell by 0.4%. On a year-on-year basis, these sales are expected to have slowed to 2.8% and 0.7%, respectively. Retailers in the UK are facing the challenge of high inflation and logistics. Also, consumer confidence has dropped in the past four straight months. Sterling will also react to the upcoming flash PMI numbers.
There will be several important economic events today. The most important one will be flash manufacturing and services data. These numbers will provide more color about the impact of the ongoing crisis in Ukraine on economies. Economists expect the data to show that the manufacturing sector has performed worse than the services sector. For example, in the European Union, they expect that the manufacturing PMI declined to 54.7 in April. The other important data will be the Canadian retail sales and manufacturing sales numbers.
EURUSD
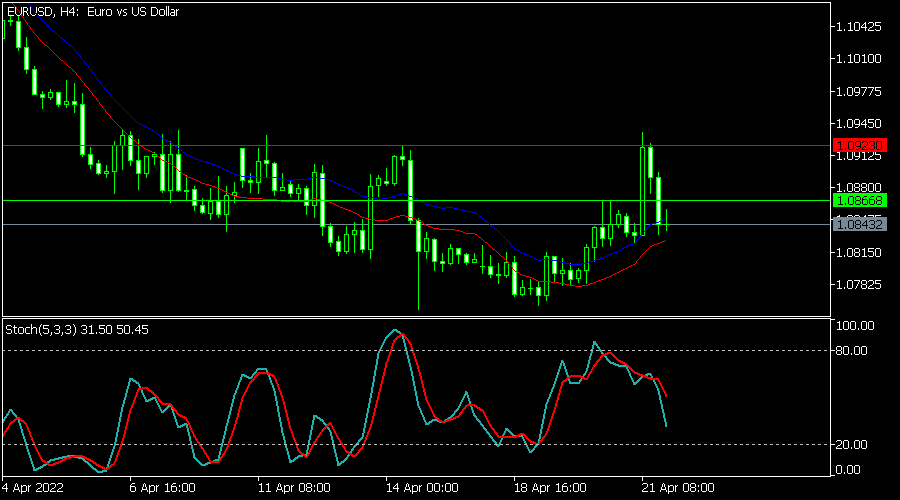
The EURUSD pair erased gains it made on Thursday after the hawkish statement by Jerome Powell. On the four-hour chart, the pair is slightly above the Envelopes indicator. It also crossed the 25-day moving average while the Stochastic oscillator is pointing downwards. It also dropped below the important resistance level at 1.0923, which was the highest level since April 14th. Therefore, the pair will likely keep falling today.
EURJPY
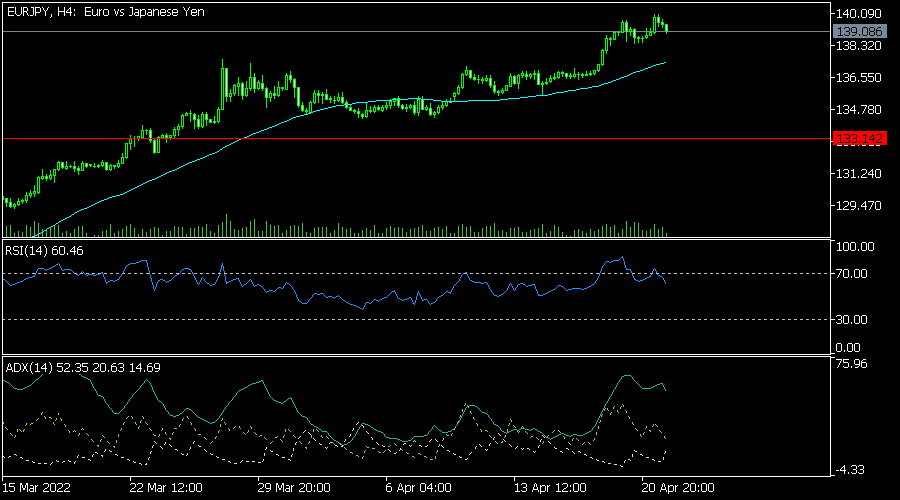
The EURJPY pair declined slightly as the recent rally paused. It is trading at 139.12, which is slightly below this week’s high of 140. The pair remains above the 25-day and 50-day moving averages while the Average Directional Movement Index. This is a sign that the bullish trend is easing. The Relative Strength Index (RSI) has also moved below the overbought level. Therefore, the pair will likely end the week in this level.
NAS100
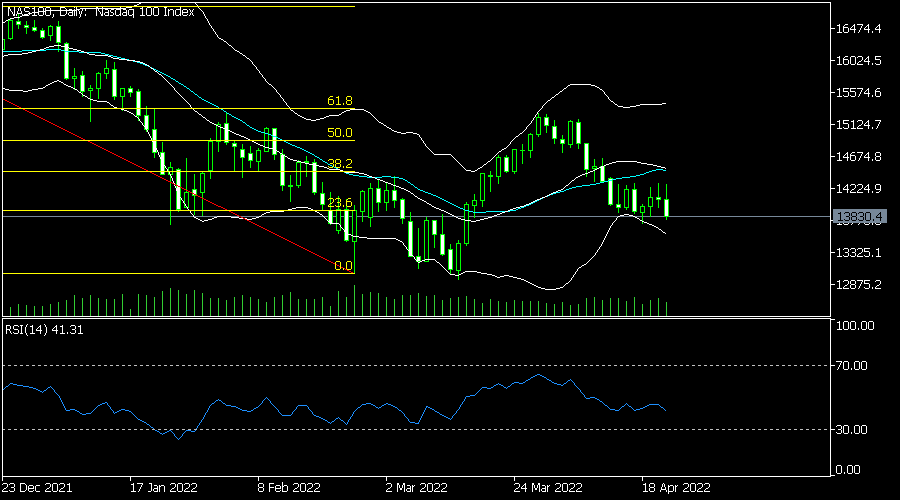
The Nasdaq 100 index declined after the hawkish statement by Powell. It dropped to a low of $13,800 even as Tesla shares jumped after strong earnings. The Bollinger Bands have widened, signaling that investors expect more volatility. It has also moved slightly below the 25-day moving average while the RSI is pointing lower. Therefore, the index will likely keep falling today.
Oil Price Declined Below $100 to Move into a Bearish Zone
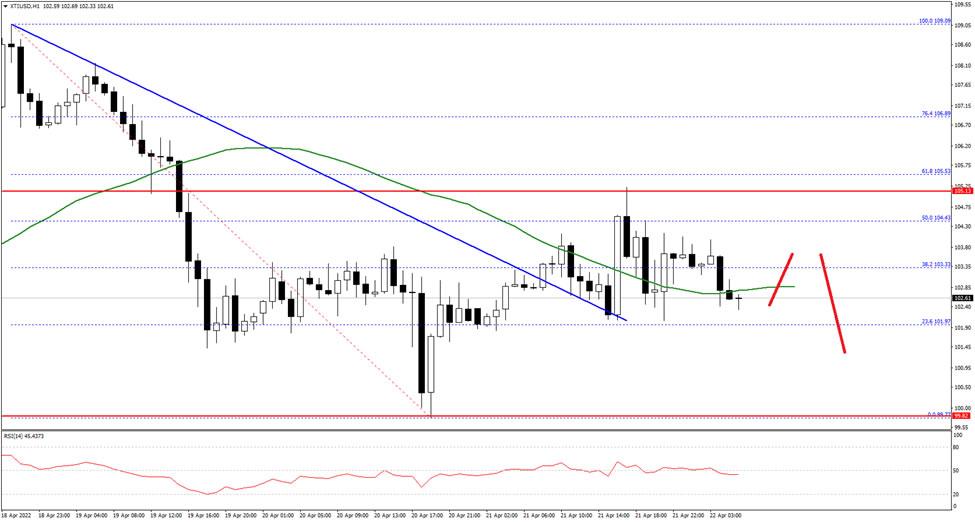
Crude oil price started a downward move from well above the $108 level against the US Dollar. The price declined below the $100 level to move into a short-term bearish zone.
A low was formed near $98.77 before there was a fresh increase. The price climbed above the $102 level and the 50 hourly simple moving average. There was a move above a key bearish trend line with resistance near $103.30 on the hourly chart.
However, the price is struggling to gain pace above the $105 resistance. The next key resistance is near the $105.50 level, above which the price might rise steadily towards the $108 resistance level.
If not, the price might continue to move down towards the $101.20 low. If there is a downside break below $101.20, the price might accelerate lower to $100.00. Any more losses might call for a test of $95.00 on FXOpen.
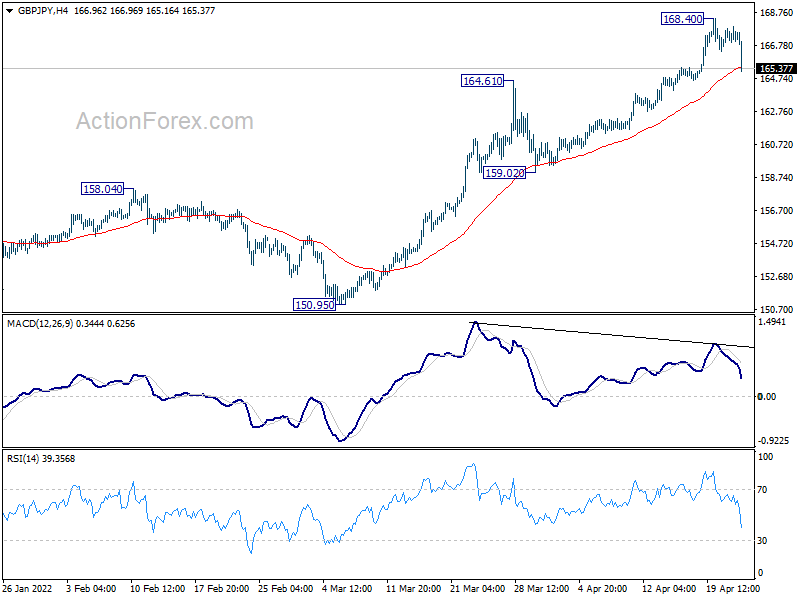
GBP/JPY Daily Outlook
Daily Pivots: (S1) 166.83; (P) 167.38; (R1) 167.77; More...
GBP/JPY's retreat from 168.40 extends lower today and intraday bias bias remains neutral at this point. Downside of retreat should be contained well above 159.09 support to bring up trend resumption. However, firm break of 159.02 will indicate rejection by 167.93 long term fibonacci resistance, and carry larger bearish implications.
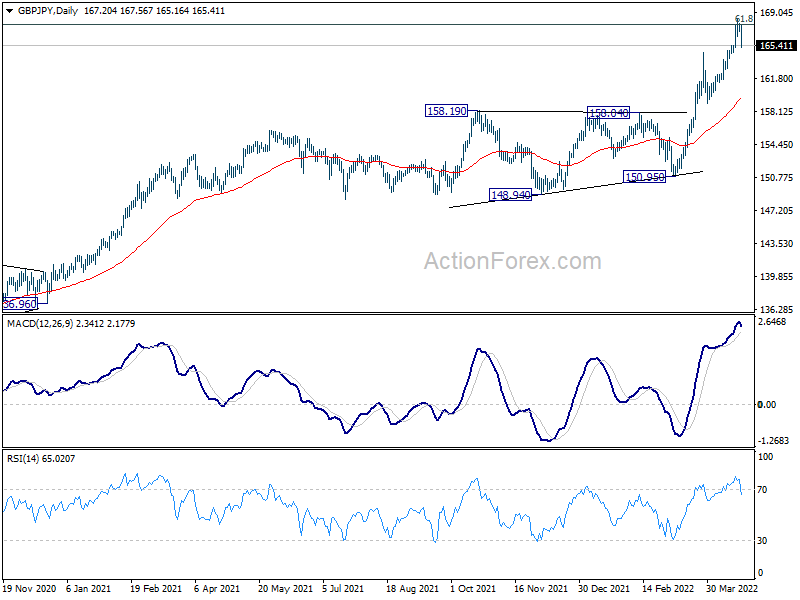
In the bigger picture, up trend from 123.94 (2020 low) is still in progress, and notable support from 55 week EMA affirms medium term bullishness. Next target is 61.8% retracement of 195.86 (2015 high) to 122.75 (2016 low) at 167.93. Sustained break there will be a long term bullish signal, and could pave the way back to 195.86. This will now remain the favored case as long as 150.95 support holds.
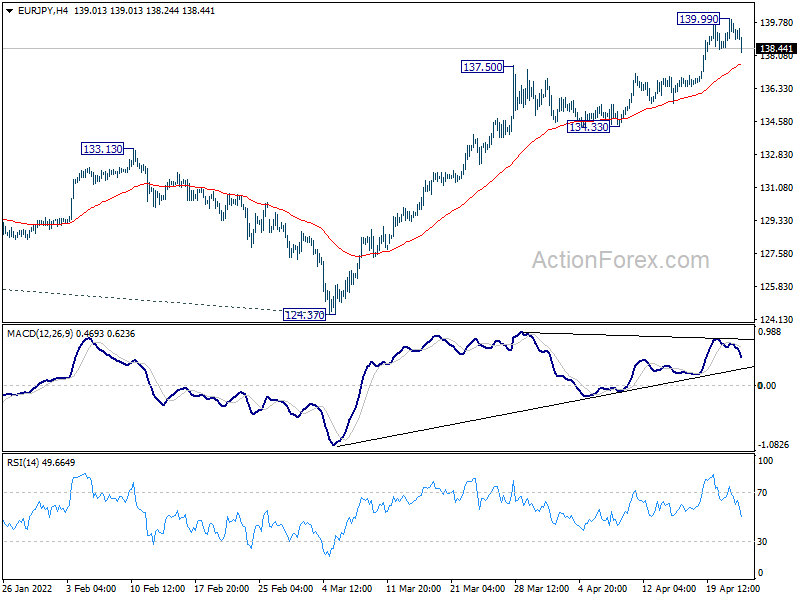
EUR/JPY Daily Outlook
Daily Pivots: (S1) 138.19; (P) 138.94; (R1) 139.48; More....
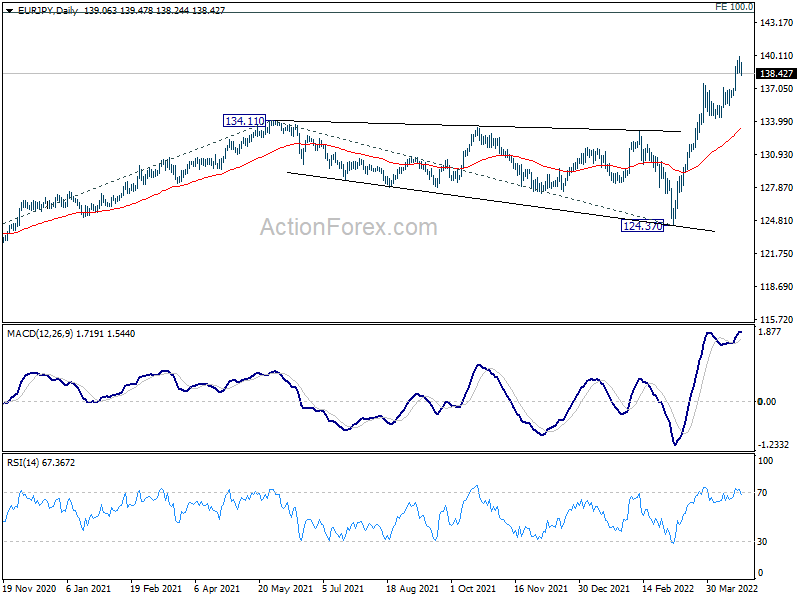
Intraday bias in EUR/JPY is turned neutral with current retreat, as a temporary top is formed at 139.99. Some consolidations could be seen but downside of retreat should be contained above 134.33 support to bring rally resumption. On the upside, break of 139.99 will resume larger up trend to 144.06 projection level next.
In the bigger picture, up trend from 114.42 (2020 low) is in progress. Sustained break of 137.49 (2018 high) will resume larger pattern from 109.30 (2016 low). Next target will be 100% projection of 114.42 to 134.11 from 124.37 at 144.06. In any case, outlook will now remain bullish as long as 124.37 support holds, in case of deep pull back.
EUR/GBP Daily Outlook
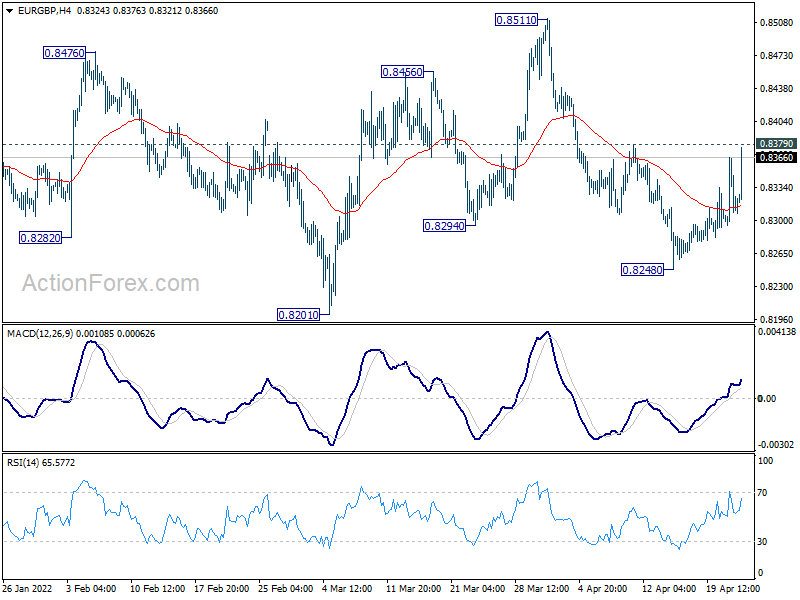
Daily Pivots: (S1) 0.8287; (P) 0.8327; (R1) 0.8358; More...
Immediate focus is now on 0.8379 resistance as EUR/GBP's rebound from 0.8248 extends. Firm break there will turn bias back to the upside. Further break of 0.8511 will reaffirm that 0.8201 is a medium term bottom, and target 0.8697 medium term fibonacci level next. On the downside, though, break of 0.8248 will resume the fall from 0.8511 to retest 0.8201 low.
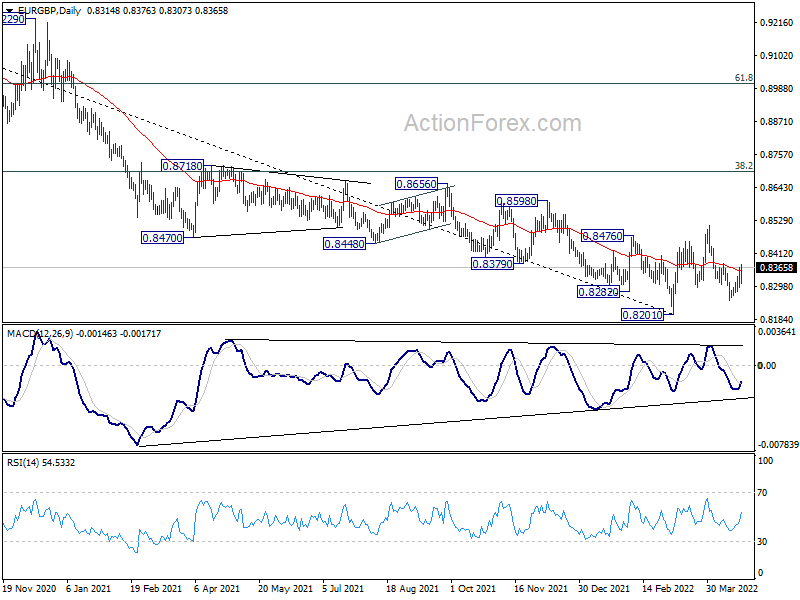
In the bigger picture, a medium term bottom should be in place at 0.8201, on bullish convergence condition in daily and weekly MACD. Rise from there could either be a correction to the down trend from 0.9499 (2020 high), or a medium term up trend itself. In either case, further rise should be seen to 38.2% retracement of 0.9499 to 0.8201 at 0.8697. Sustained break there will target 61.8% retracement at 0.9003. This will remain the favored case as long as 0.8294 support holds.
EUR/AUD Daily Outlook
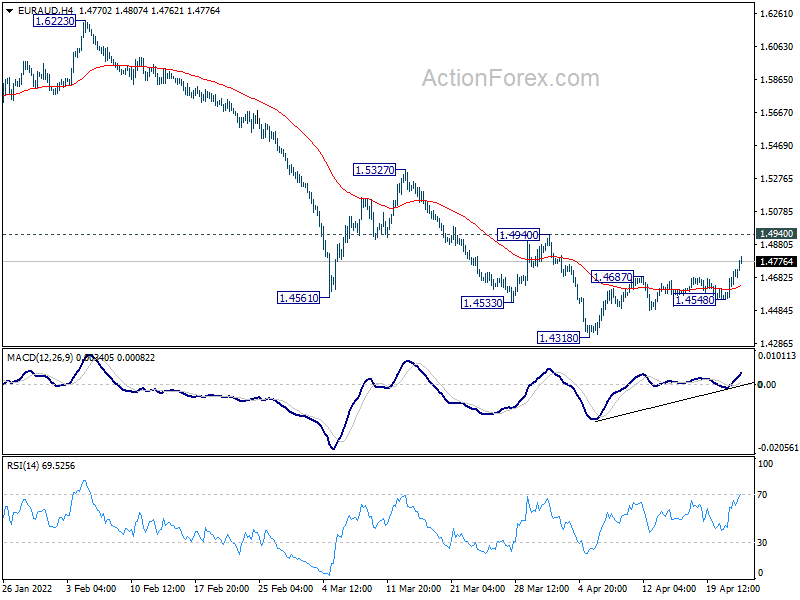
Daily Pivots: (S1) 1.4596; (P) 1.4662; (R1) 1.4769; More...
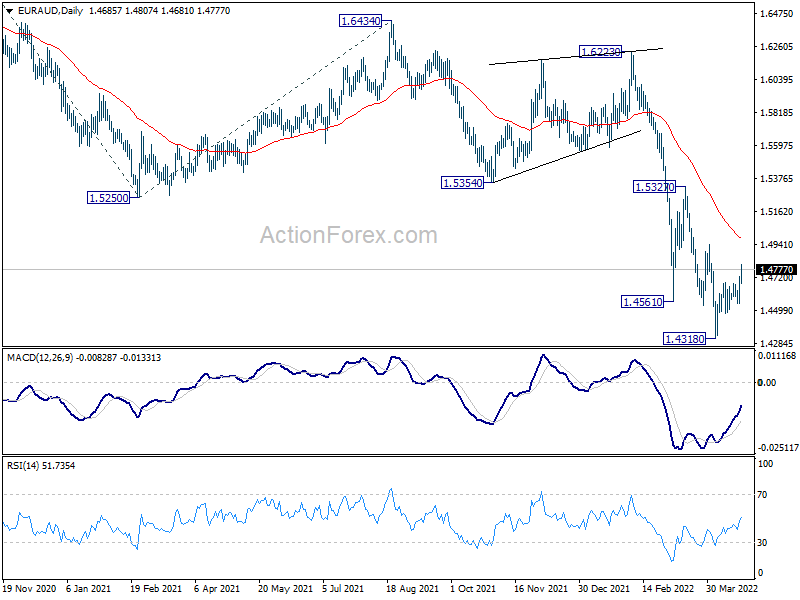
EUR/AUD's rebound from 1.3418 extends higher today but stays well below 1.4940 resistance. Intraday bias remains neutral and outlook stays bearish too. On the downside, below 1.4548 support will bring retest of 1.4318 low. Decisive break there will resume larger down trend to 1.3624 long term support next. On the upside, however, firm break of 1.4940 will indicate short term bottoming and turn bias back to the upside for 1.5327 resistance instead.
In the bigger picture, fall from 1.9799 is seen as a long term impulsive move. Next target is 61.8% projection of 1.9799 to 1.5250 from 1.6434 at 1.3623, which is close to 1.3624 long term support (2017 low). Some support could be seen there to bring interim rebound. But overall, break of 1.5354 support turned resistance is needed to be the first sign of medium term bottoming. Otherwise, outlook will stay bearish in case of recovery.
EUR/CHF Daily Outlook
Daily Pivots: (S1) 1.0288; (P) 1.0330; (R1) 1.0373; More....
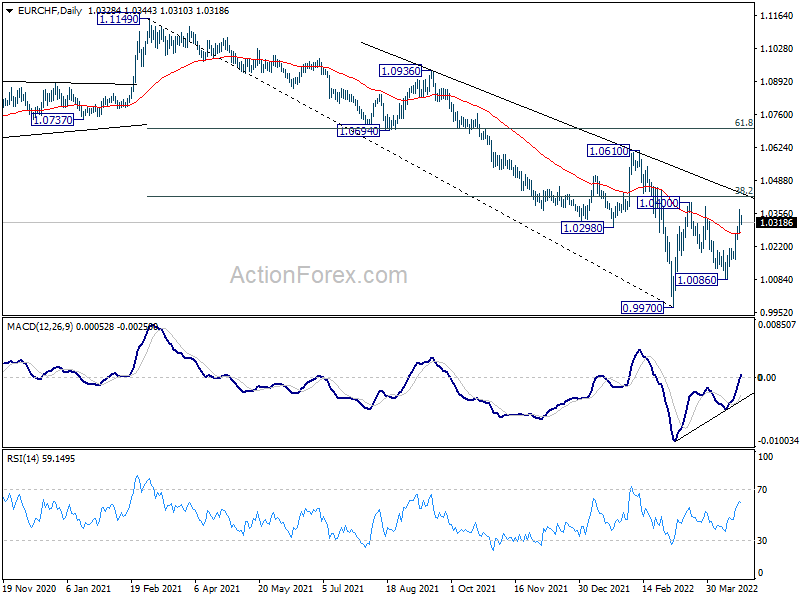
Intraday bias in EUR/CHF stays on the upside for 1.0400 resistance. Firm break there will resume whole rebound from 0.9970, and target 1.0610 resistance next. On the downside, below 1.0246 minor support will turn intraday bias neutral first. But further rally is expected as long as 1.0086 support holds.
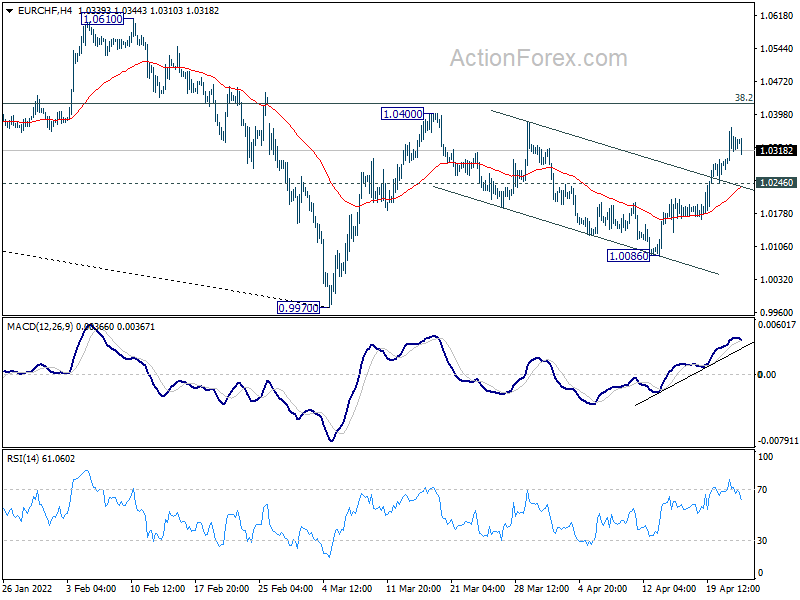
In the bigger picture, long term down trend from 1.2004 (2018 high) is still in progress. Next target is 100% projection of 1.2004 to 1.0505 to 1.1149 at 0.9650. In any case, sustained break of 1.0505 support turned resistance (2020 low) is needed to be the first sign of medium term bottoming. Otherwise, outlook will remain bearish.