Sample Category Title
US: Inflation Reaches (Another) Multi-Decade High
Consumer price inflation continued to accelerate in March, rising 1.2% month-on-month (m/m) – the fastest month-over-month pace since September 2005. On a year-over-year (y/y) basis, inflation was 8.5%, marking yet another multi-decade high.
Gasoline prices remained a key contributor to price growth, rising by 18.3% m/m and accounting for over half of the total increase in headline inflation. Food prices were also up 1.0% m/m in March, and 8.8% relative to year-ago levels.
Core (excludes food and energy) inflation rose 0.3% m/m, a step down from the previous month's 0.5% m/m gain. On a year-over-year basis, inflation ticked up a tenth of a percentage point, rising to 6.5% y/y.
Shelter costs were again a key contributor to core price growth – accounting for nearly two-thirds of the increase – and rising 0.5% m/m, with both rent of primary residence and owners equivalent rent notching gains of 0.4% m/m. Having said that, price increases were relatively broad-based across most categories, with airline fares (10.7% m/m), transportation (2.0% m/m) & medical (0.6% m/m) services, and motor vehicle insurance (0.7% m/m) all up in March.
Core goods prices fell by 0.4% m/m, with all categories showing a deceleration (or decline) on the month. Of note was the decline in used vehicle prices (-3.8% m/m), which has now fallen in each of the last two months. New vehicle (0.2% m/m) prices, however, were up modestly in March, though price growth has shown signs of cresting here as well in recent months. Relative to year-ago levels, new and used vehicle prices are still up 12.5% and 35.3%, respectively.
Key Implications
As expected, price pressures continued to mount in March, as higher food and energy prices remained key contributors to last month's price gains. Over the near-term, we should see some reprieve in gasoline prices, as WTI has moved sharply lower in recent weeks following separate announcements from both the US and International Energy Agency to release some reserves of oil.
The decline in core goods prices is an encouraging development, though we caution reading too much into this over the near-term. Most of the decline was concentrated in used vehicle prices, which are highly volatile and still suspectable to ongoing supply shocks. Both new and used vehicle inventories remain historically low and ongoing supply chain disruptions – largely stemming from China lockdowns and semiconductor shortages – will continue to weigh on auto production this year, keeping the market undersupplied and prices elevated.
Having said that, the notable increases in some price categories which were heavily impacted by COVID restrictions (airline, public transportation, etc.) is showing that consumer spending is starting to "normalize". This should result in increased spending in consumer services, helping to ease some of the demand-side cost pressures on goods.
With price pressures continuing to mount and the labor market remaining as tight as ever, there is no doubt the Federal Reserve will be raising rates at its next policy announcement on May 3rd-4th. Markets are largely priced for a 50-basis point rate hike, and we fully expect the Fed to use this opportunity to accelerate the removal of monetary accommodation.
EUR/USD Mid-Day Outlook
Daily Pivots: (S1) 1.0860; (P) 1.0897 (R1) 1.0920; More...
Intraday bias in EUR/USD remains neutral at this point. Further decline is in favor with 1.0987 minor resistance intact. On the downside, decisive break of 1.0805 low will resume larger down trend. Next target is 61.8% projection of 1.1494 to 1.0805 from 1.1184 at 1.0758, and then 100% projection at 1.0495. On the upside, above 1.0987 minor resistance will turn bias back to the upside for 1.1184 resistance instead.
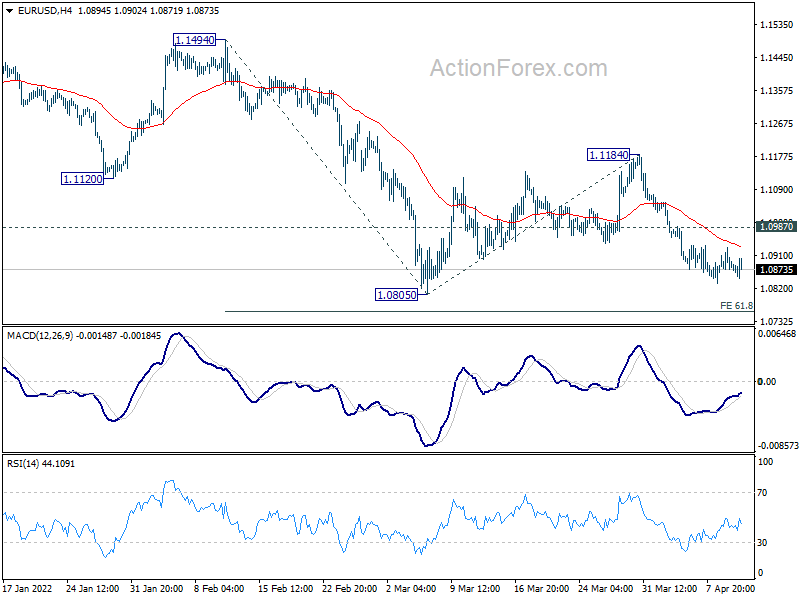
In the bigger picture, the decline from 1.2348 (2021 high) is expected to continue as long as 1.1494 resistance holds. Firm break of 1.0635 (2020 low) will raise the chance of long term down trend resumption and target a retest on 1.0339 (2017 low) next. Nevertheless, break of 1.1494 will maintain medium term neutral outlook, and extending term range trading first.
GBP/USD Mid-Day Outlook
Daily Pivots: (S1) 1.2993; (P) 1.3025; (R1) 1.3061; More...
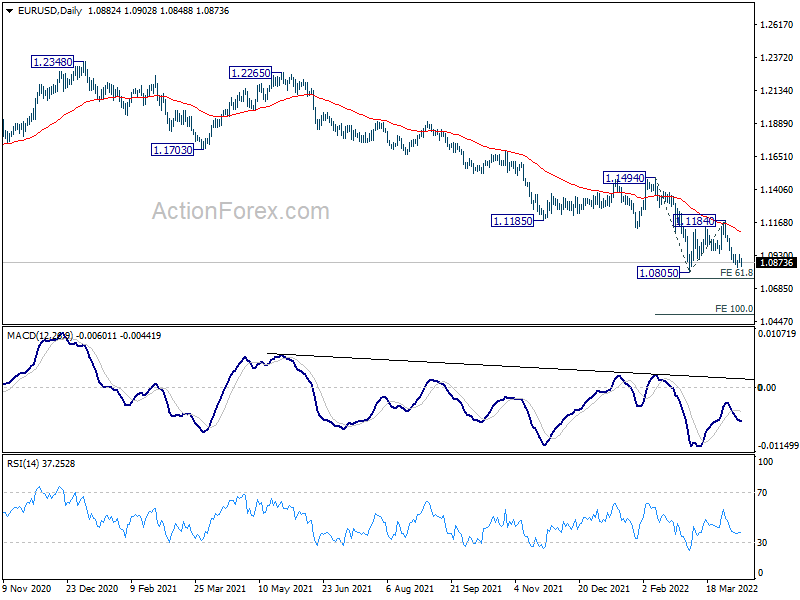
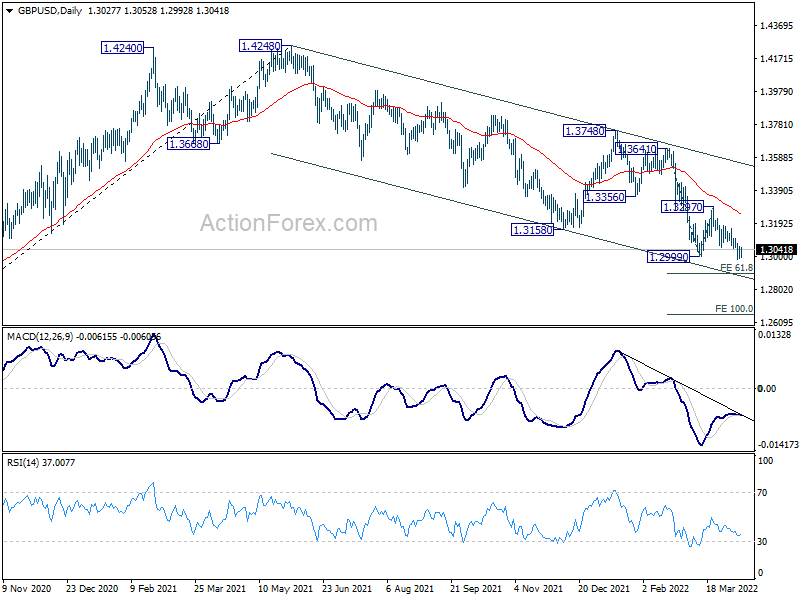
Intraday bias in GBP/USD is turned neutral as it turns into consolidation after hitting 1.2981. Outlook will stay bearish as long as 1.3165 resistance holds. Break of 1.2981 will resume larger down trend to 61.8% projection of 1.3641 to 1.2999 from 1.3297 at 1.2900.
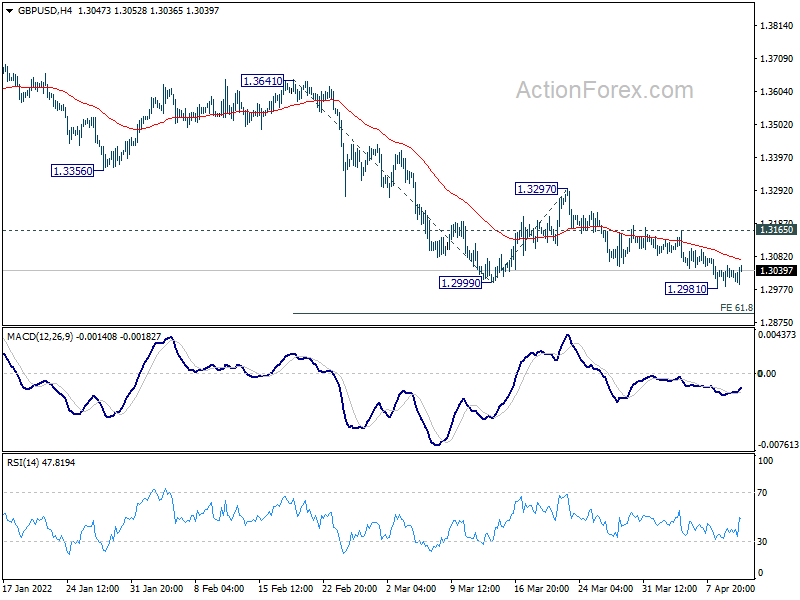
In the bigger picture, rise from 1.1409 (2020 low) has completed at 1.4248. Decline from 1.4248 could still be a corrective move, or it could be the start of a long term down trend. In either case, deeper decline would be seen back to 61.8% retracement of 2.1161 to 1.1409 at 1.2493. In any case, break of 1.3748 resistance is needed confirm completion of the fall from 1.4248, or outlook will stay bearish.
USD/JPY Mid-Day Outlook
Daily Pivots: (S1) 124.36; (P) 125.07; (R1) 126.10; More...
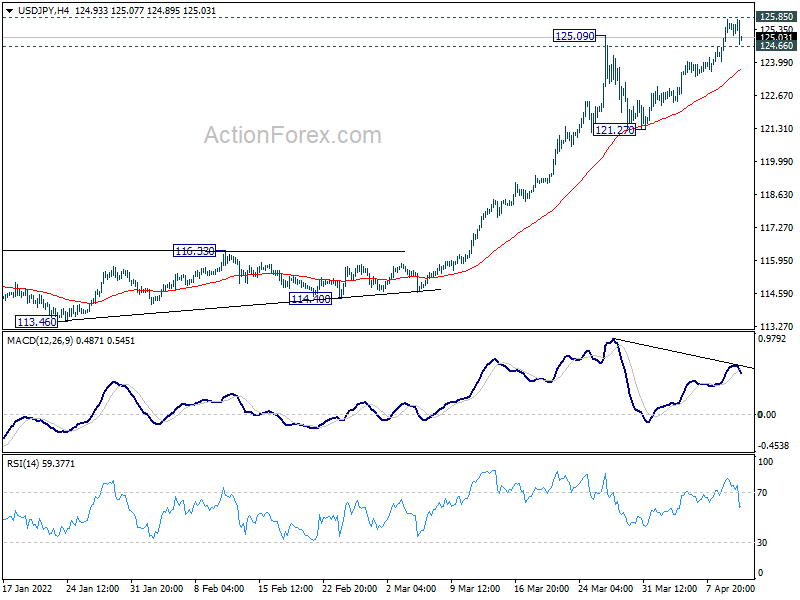
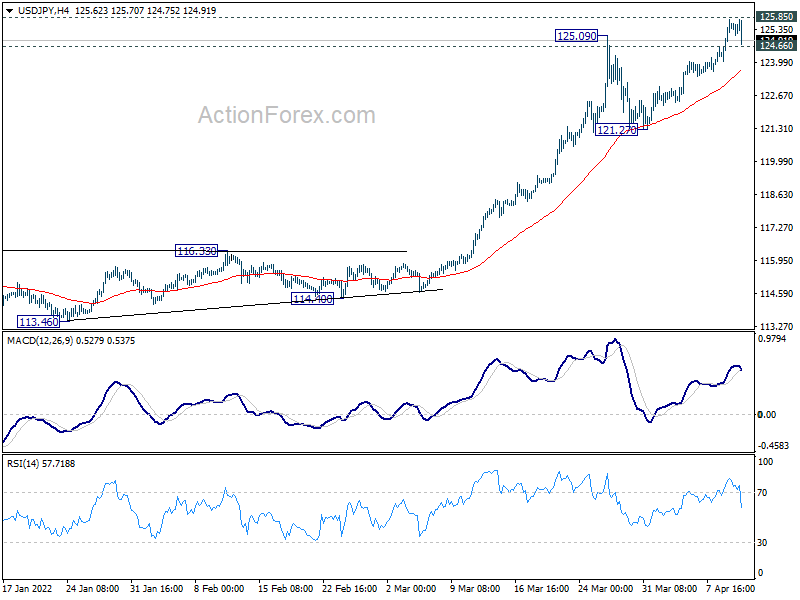
Intraday bias in USD/JPY is turned neutral with 4 hour MACD crossed below signal line. On the downside, break of 124.66 minor support will bring deeper pull back to 4 hour 55 EMA (now at 123.67) and possibly below. But downside should be contained above 121.27 support to bring another rally. On the upside, sustained break of 125.85 will pave the way to 130.04 long term projection level next.
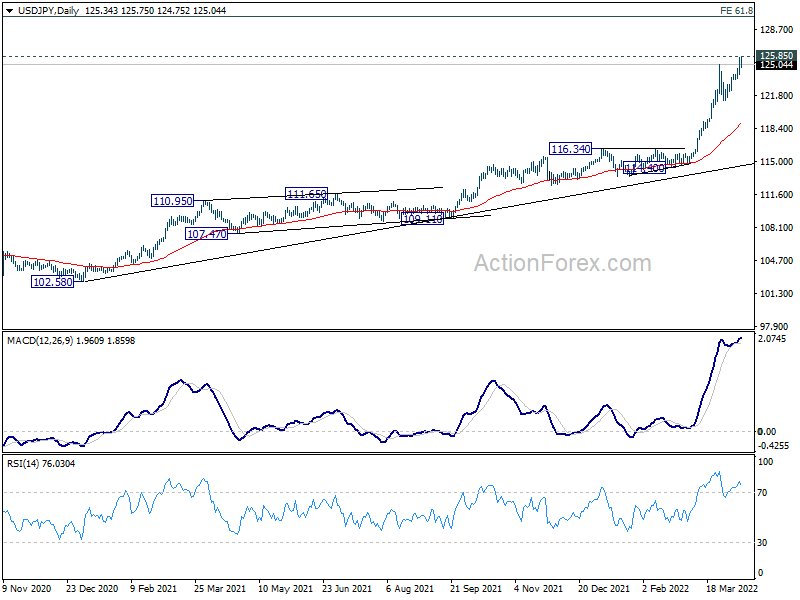
In the bigger picture, up trend from 98.97 (2016 low) is in progress for retesting 125.85 (2015 high). Sustained break there will confirm long term up trend resumption. Next target will be 61.8% projection of 75.56 (2011 low) to 125.85 (2015 high) from 98.97 at 130.04. This will now remain the favored case as long as 116.34 resistance turned support holds.
USD/CHF Mid-Day Outlook
Daily Pivots: (S1) 0.9287; (P) 0.9329; (R1) 0.9355; More....
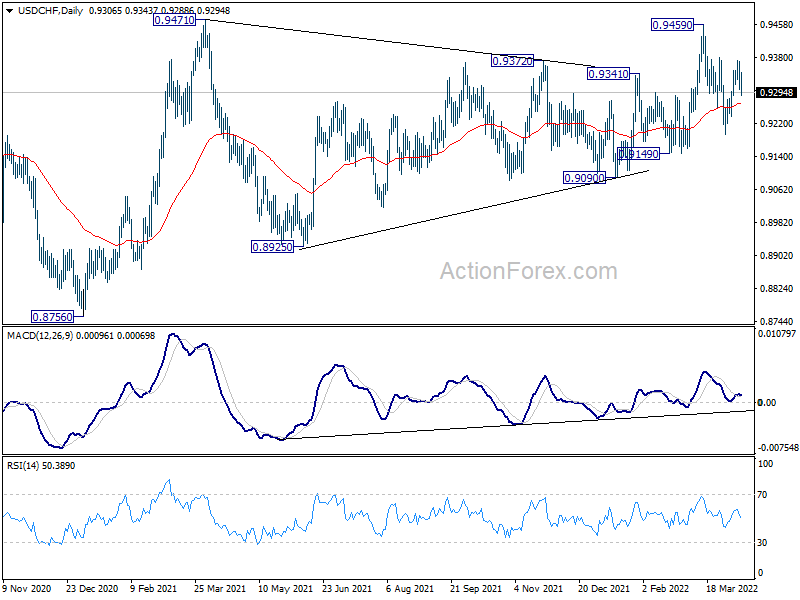
Intraday bias in USD/CHF remains neutral for the moment. On the upside, firm break of 0.9380 should confirm that fall from 0.9459 has completed with three wave down to 0.9193. Such development will revive near term bullishness and turn bias back to the upside for 0.9459 and then 0.9471 resistance. On the downside, below 0.9280 minor support will turn bias to the downside for 0.9193 support next.
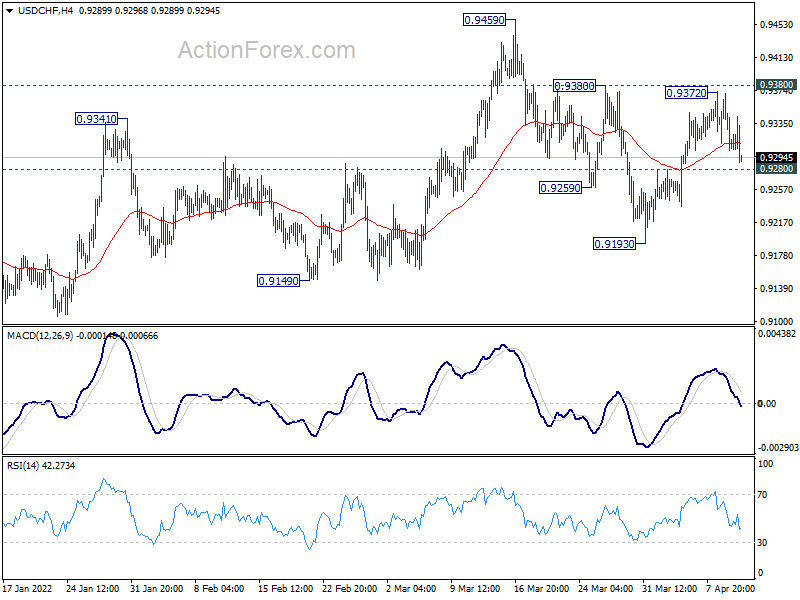
In the bigger picture, medium term outlook will be neutral at best as long as 0.9471 resistance holds. Larger down trend could still extend through 0.8756 (2021 low). However, firm break of 0.9471 will argue that whole down trend form 1.0342 (2016 high), has completed with waves down to 0.8756. A medium term up trend should be set up to target 1.0237/0342 resistance zone.
Dollar and Yield Dip after CPI, Stocks Rebound
Dollar drops in early US session together with treasury yields after consumer inflation data. While headline CPI came in higher than expected, core CPI's pick up missed expectations. Commodity currencies are trading generally higher as US futures point to a rebound in major stock indexes. European majors are also attempting a recovery but momentum is relatively weak. Yen is trading is tight range, consolidating recent losses.
Technically, a focus is now on whether USD/JPY would correct from current level, after rejection by 125.85 long term resistance. Bring of 124.66 minor support will bring deeper pull back. But overall, there shouldn't be any change in the up trend. Any retreat should be contained above 121.27 support, to bring another attempt on 125.85 resistance.
In Europe, at the time of writing, FTSE is down -0.45%. DAX is down -0.35%. CAC is down -0.12%. Germany 10-year yield is down -0.043 at 0.775. Earlier in Asia, Nikkei dropped -1.81%. Hong Kong HSI rose 0.52%. China Shanghai SSE rose 1.46%. Singapore Strait Times dropped -0.99%. Japan 10-year JGB yield rose 0.0052 to 0.244.
US CPI rose to 8.5% yoy, core CPI rose to 6.5% yoy, highest since early 80s
US CPI rose 1.2% mom in March, above expectation of 1.1% mom. CPI core rose 0.3% mom, below expectation of 0.5% mom.
For the 12-month period, CPI accelerated from 7.9% yoy to 8.5% yoy, above expectation of 8.3% yoy. That's the highest annual rate since December 1981.
CPI core ticked up from 6.4% yoy to 6.5% yoy, below expectation of 6.6% yoy. That's the fastest 12-month increase since August 1982.
Energy index rose 32.0% yoy while goods index rose 8.8% yoy, largest 12-month increase since May 1981.
Germany ZEW economic sentiment dropped to -41, prospect of stagflation over...
Germany ZEW Economic Sentiment dropped from -39.3 to -41 in April, but was better than expectation of -48. Current Situation Index dropped from -21.4 to -30.8, above expectation of -35.0. Inflation expectations dropped -43.4 pts to 26.8.
Eurozone ZEW Economic Sentiment dropped from -38.7 to -43.0, above expectation of -46.5. Current Situation index dropped -6.6 pts to -28.5. Inflation expectations dropped -43.6 pts to 25.9.
"The ZEW Indicator of Economic Sentiment remains at a low level. The experts are pessimistic about the current economic situation and assume that it will continue to deteriorate. The decline in inflation expectations, which cuts the previous month's considerable increase by about half, gives some cause for hope. However, the prospect of stagflation over the next six months remains," comments ZEW President Achim Wambach.
UK payrolled employees rose 35k in Mar, unemployment rate dropped to 3.8% in Feb
UK payrolled employees rose 35k in March, comparing to February. Number of payrolled employees were 544k or 1.9% above prepandemic level in February 2020. Claimant count dropped -46.9k, larger than expectation of -41.1k.
In the three months to February, unemployment rate dropped to 3.8% matched expectations. That's -0.2% lower than the previous three-month period, and -0.1% below pre-pandemic levels. Average earnings including bonus rose 5.4% over the year, below expectation of 5.7%. Average earnings excluding bonus jumped 4.0% over the year, above expectation of 3.7%.
Japan PPI rose 7.3% yoy in Mar, index at highest level since 1982
Japan corporate goods price index rose 7.3% yoy in March, slowed from 9.7% yoy but beat expectation of 9.3% yoy. The March index, at 112.0, was the highest level since December 1982. The yen-based import price index surged 33.4% yoy, signaling that Yen's depreciation could be amplifying import inflation.
Separately, Finance Minister Shunichi Suzuki warned, "The government will closely monitor developments in the foreign exchange market, including the recent depreciation of the yen with a sense of vigilance. That includes the impact on the Japanese economy."
Australia NAB business confidence rose to 16, strong rebound led by consumer demand
Australia NAB business confidence rose from 13 to 16 in March. Business conditions rose from 9 to 18. Looking at some details, trading conditions rose from 11 to 24. Profitability conditions rose from 5 to 13. Employment conditions rose from 8 to 12.
"A surge in business conditions headlined a really strong March survey," said NAB Group Chief Economist Alan Oster. "Businesses reported very strong trading conditions and a sharp rise in profitability, which indicates demand is continuing to hold up as the economy rebounds from Omicron and growth gathers momentum."
"Business confidence continued to improve in March, with little evidence of any adverse impact from events in Ukraine," said Oster. "The outlook also strengthened in terms of forward orders which points to ongoing economic growth over coming months."
"Overall, the results depict a very strong rebound, led by strong consumer demand."
USD/CHF Mid-Day Outlook
Daily Pivots: (S1) 0.9287; (P) 0.9329; (R1) 0.9355; More....
Intraday bias in USD/CHF remains neutral for the moment. On the upside, firm break of 0.9380 should confirm that fall from 0.9459 has completed with three wave down to 0.9193. Such development will revive near term bullishness and turn bias back to the upside for 0.9459 and then 0.9471 resistance. On the downside, below 0.9280 minor support will turn bias to the downside for 0.9193 support next.
In the bigger picture, medium term outlook will be neutral at best as long as 0.9471 resistance holds. Larger down trend could still extend through 0.8756 (2021 low). However, firm break of 0.9471 will argue that whole down trend form 1.0342 (2016 high), has completed with waves down to 0.8756. A medium term up trend should be set up to target 1.0237/0342 resistance zone.
Economic Indicators Update
| GMT | Ccy | Events | Actual | Forecast | Previous | Revised |
|---|---|---|---|---|---|---|
| 22:00 | NZD | NZIER Business Confidence Q1 | -40 | -28 | ||
| 23:01 | GBP | BRC Like-For-Like Retail Sales Y/Y Mar | -0.40% | 2.60% | 2.70% | |
| 23:50 | JPY | Bank Lending Y/Y Mar | 0.50% | 0.50% | 0.40% | |
| 23:50 | JPY | PPI Y/Y Mar | 9.50% | 9.30% | 9.30% | 9.70% |
| 01:30 | AUD | NAB Business Confidence Mar | 16 | 13 | ||
| 01:30 | AUD | NAB Business Conditions Mar | 18 | 9 | ||
| 06:00 | GBP | Claimant Count Change Mar | -46.9K | -41.1K | -48.1K | |
| 06:00 | GBP | ILO Unemployment Rate (3M) Feb | 3.80% | 3.80% | 3.90% | |
| 06:00 | GBP | Average Earnings Including Bonus 3M/Y Feb | 5.40% | 5.70% | 4.80% | |
| 06:00 | GBP | Average Earnings Excluding Bonus 3M/Y Feb | 4.00% | 3.70% | 3.80% | |
| 06:00 | EUR | Germany CPI M/M Mar F | 2.50% | 2.50% | 2.50% | |
| 06:00 | EUR | Germany CPI Y/Y Mar F | 7.30% | 7.30% | 7.30% | |
| 06:45 | EUR | France Trade Balance (EUR) Feb | -10.3B | -9.3B | -8.0B | |
| 09:00 | EUR | Germany ZEW Economic Sentiment Apr | -41 | -48 | -39.3 | |
| 09:00 | EUR | Germany ZEW Current Situation Apr | -30.8 | -35 | -21.4 | |
| 09:00 | EUR | Eurozone ZEW Economic Sentiment Apr | -43 | -46.5 | -38.7 | |
| 10:00 | USD | NFIB Business Optimism Index Mar | 93.2 | 95 | 95.7 | |
| 12:30 | USD | CPI M/M Mar | 1.20% | 1.10% | 0.80% | |
| 12:30 | USD | CPI Y/Y Mar | 8.50% | 8.30% | 7.90% | |
| 12:30 | USD | CPI Core M/M Mar | 0.30% | 0.50% | 0.50% | |
| 12:30 | USD | CPI Core Y/Y Mar | 6.50% | 6.60% | 6.40% |
Without an ECB Hawkish Turn, EURUSD Could Go Below 1.0
In Germany, the final consumer price index data confirmed that inflation reached 7.3% y/y in March – the highest since 1981. This is a worrying reading, but it is already priced in as it coincided with the preliminary estimates released at the end of March.
Much more worrying is the jump in wholesale prices in March by 6.9% m/m and 22.6% y/y. The highest price jump since 1969 promises even more upward pressure on consumer prices by a considerable margin.
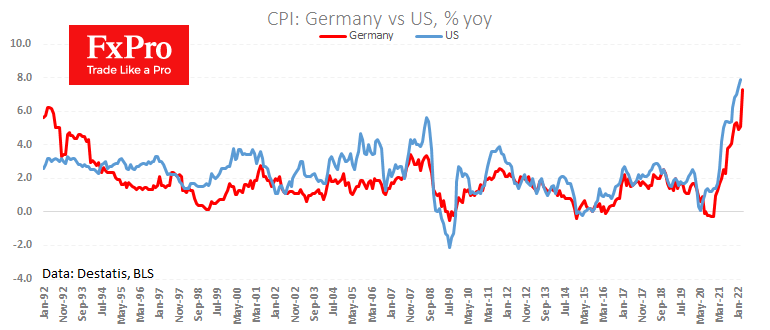
German representatives have taken one of the most hawkish stances against inflation. Record inflation figures and the potential for further acceleration will probably force the ECB to shift from pro-growth to anti-inflationary.
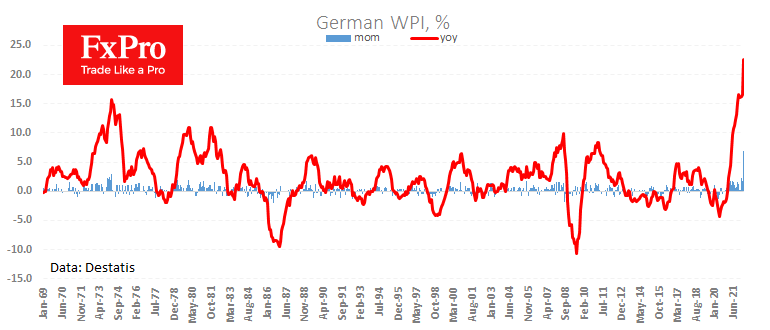
It is worth paying increased attention to the change in the tone of ECB head Lagarde’s comments following tomorrow’s meeting. While no policy changes are expected, all eyes will be on the willingness to raise rates in the coming months. Markets are laying down two hikes before the end of the year.
The latest inflation data could precipitate a hawkish reversal by the ECB and deliver this to the public as early as tomorrow, triggering a reassessment of the outlook in the euro. If that doesn’t happen, we could witness an imminent capitulation of the buyers of the single currency and see EURUSD below 1.0 in the next six months.
New Zealand Dollar Eyes RBNZ
The New Zealand dollar is finally in positive territory on Tuesday, after posting five consecutive losing sessions.
RBNZ rate decision looms
The RBNZ is widely expected to increase rates from the current 1.00% at the Wednesday meeting, but by how much? Pundits are calling the rate decision a “coin toss” between a 0.25% and a 0.50% increase. Most analysts expect a 0.25% move, but the markets are clamouring for a super-size 0.50% move, given soaring inflation. If investors don’t get the 0.50% move, we could see the New Zealand dollar take a tumble. With the RBNZ well into its rate-hike cycle, the markets will be combing through the rate statement, with the expectation that the Bank will be hawkish in its forward guidance.
The central bank finds itself caught between a rock and a hard place ahead of this key rate decision. There is strong pressure to contain inflation, which could hit 7%, and the most effective inflation-busting tool is one or more 0.50% rate hikes. At the same time, a sharp rise in interest rates could cause the economy to stall and result in a recession. With the unexpected Ukraine war causing plenty of turbulence in the markets and consumer and business confidence at low levels, the RBNZ has good reasons to avoid a 0.50% hike.
NZIER Business Confidence dropped sharply in Q1, falling from -28 to -40. The retail sector was particularly pessimistic, as the Omicron wave caused many consumers to stay home, even with relaxation in health restrictions. The survey found that businesses are concerned about spiralling inflation and expect the RBNZ to continue raising interest rates. As well, businesses are struggling with continuing labor shortages. It’s not a pretty picture, and the survey found that firms plan to scale back on investment due to the heightened uncertainties facing businesses.
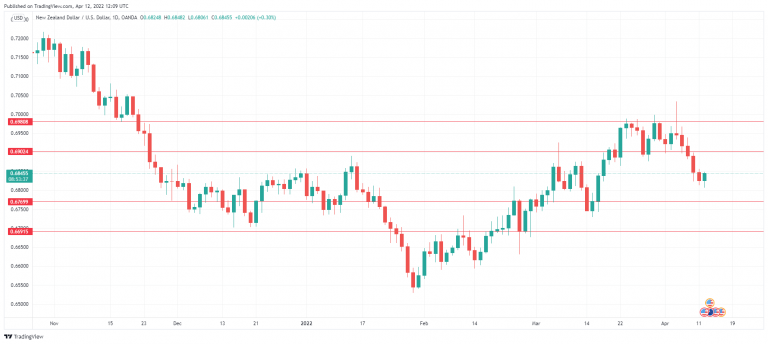
NZD/USD Technical
- There is resistance at 0.6902, followed by 0.6980
- NZD/USD has support at 0.6769 and 0.6691
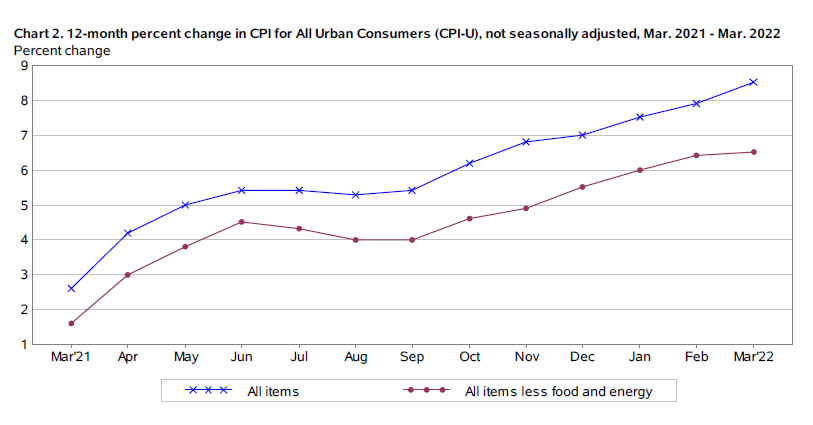
US CPI rose to 8.5% yoy, core CPI rose to 6.5% yoy, highest since early 80s
US CPI rose 1.2% mom in March, above expectation of 1.1% mom. CPI core rose 0.3% mom, below expectation of 0.5% mom.
For the 12-month period, CPI accelerated from 7.9% yoy to 8.5% yoy, above expectation of 8.3% yoy. That's the highest annual rate since December 1981.
CPI core ticked up from 6.4% yoy to 6.5% yoy, below expectation of 6.6% yoy. That's the fastest 12-month increase since August 1982.
Energy index rose 32.0% yoy while goods index rose 8.8% yoy, largest 12-month increase since May 1981.
Natural Gas Futures Hit 13-Year High in Overbought Zone
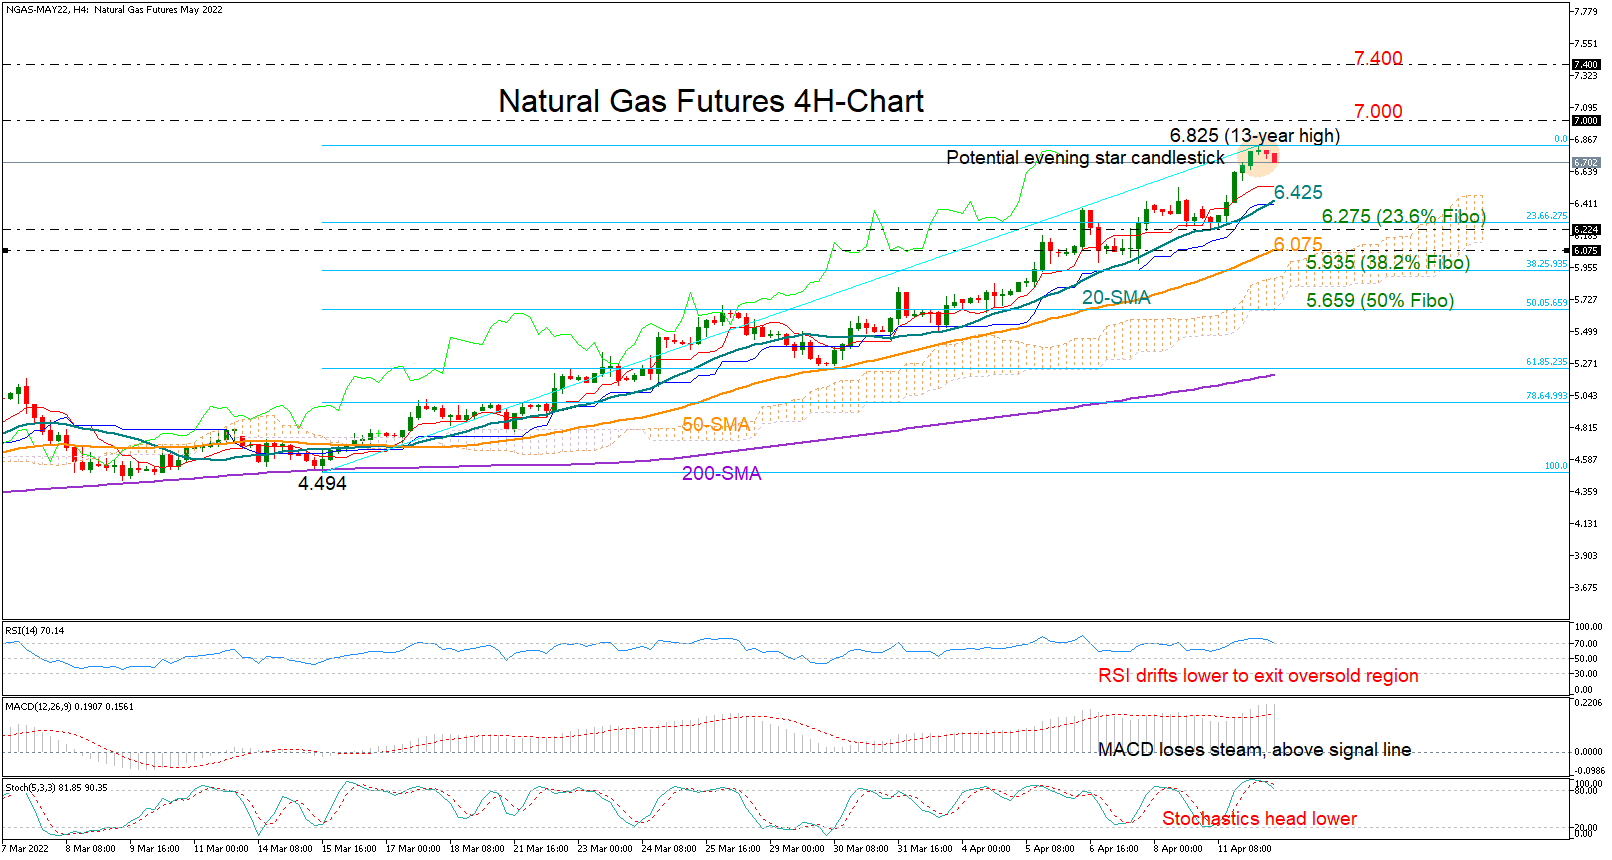
Natural gas futures (May delivery) further brightened their long-term bullish outlook on Tuesday, stretching their impressive five-week rally to a new 13-year high of 6.825.
Despite the clear positive pattern in the market, which is well endorsed by the upward-sloping simple moving averages (SMAs), some signs of weakness are already evident on the four-hour chart. The price has started to decelerate after printing a squeezed evening star candlestick earlier today, reflecting fading buying appetite. Likewise, the RSI and the Stochastics seem to have found a peak in the overbought area, suggesting that the bullish action is overdone. The MACD has started to lose steam, backing the above narrative as well.
A downside correction, however, would not cause any serious concerns unless the price dips below the supportive 20-period SMA currently at 6.425. Then, a decisive close below the 23.6% Fibonacci retracement of the 4.494 – 6.825 upleg at 6.275 would violate the bullish trend, likely sending the price straight to the 50-period SMA at 6.075. Another failure near the 38.2% Fibonacci of 5.935 may produce a sharper decline towards the 50% Fibonacci of 5.659.
Otherwise, if the bulls retake control above 6.825, resistance could next develop around the 7.000 round level. A successful penetration at this point could shift attention to the 7.400 – 8.000 zone last active during the 2004 – 2009 period. Running higher, the price could pause around the 9.00 psychological mark.
In brief, natural gas futures are expected to give up some ground as the market is hovering within the overbought zone. A pullback, however, would still be part of an uptrending market unless the price strikes a new lower low below 6.275.