Sample Category Title
GBP/USD Extends Decline, Gold Visits $2K
Key Highlights
- GBP/USD followed a bearish path below 1.3280.
- Gold price extended gains and tested the $2,000 resistance.
- Crude oil price surged to $130 before correcting lower.
- AUD/USD and NZD/USD performed better than GBP/USD and EUR/USD.
GBP/USD Technical Analysis
The British Pound started a major decline after it failed to clear 1.3420 against the US Dollar. GBP/USD traded below the 1.3320 support to enter a bearish zone.
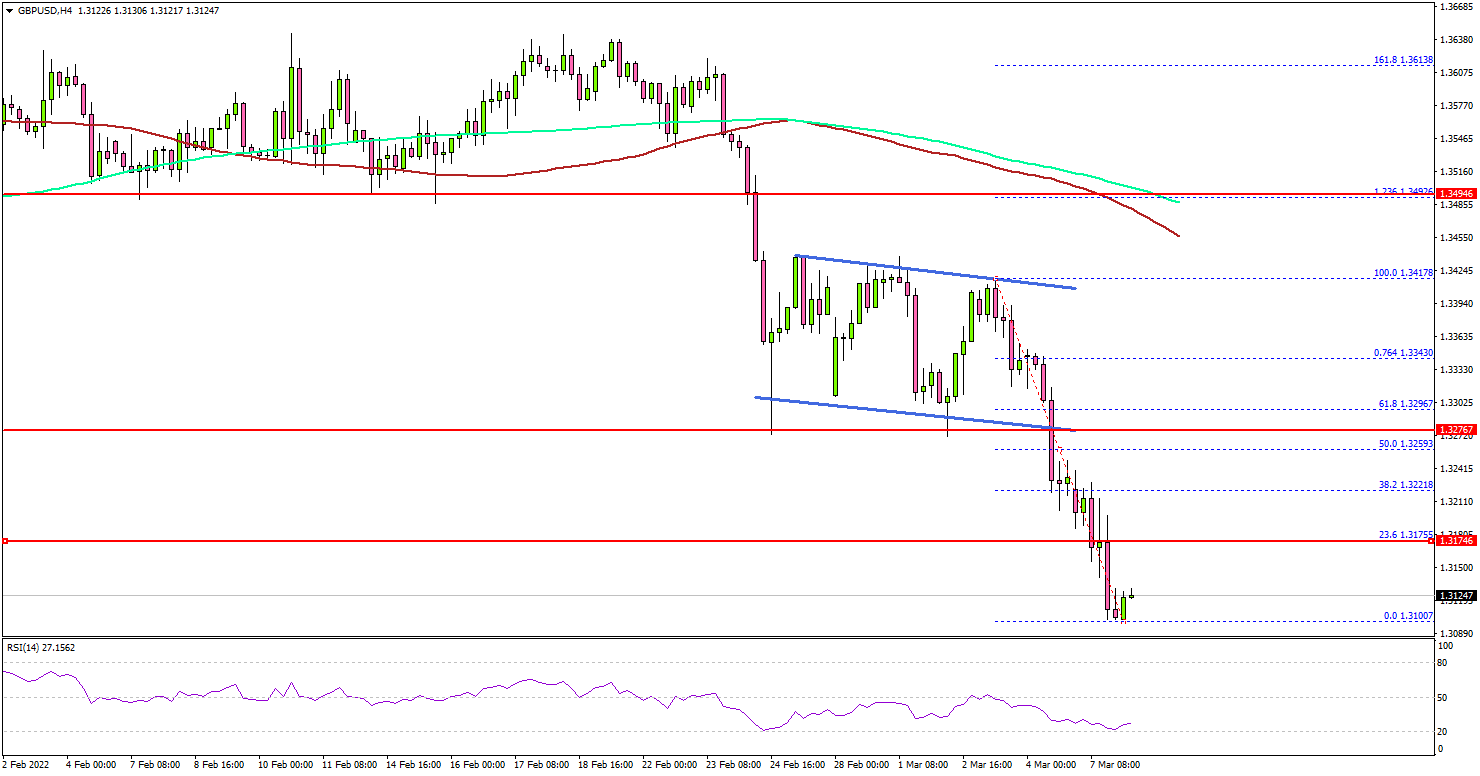
Looking at the 4-hours chart, the pair settled below the 1.3250 level, the 100 simple moving average (red, 4-hours), and the 200 simple moving average (green, 4-hours).
There was a clear move below the 1.3200 support zone. A low was formed near 1.3100 and the pair is now consolidating losses. If there is a recovery wave, the pair could face resistance near the 1.3200 level.
The next major resistance is near the 1.3280 level. A successful close above the 1.3250 resistance might start a steady increase. In the stated case, the pair could rise towards the 1.3400 resistance zone in the near term.
If not, the pair might continue to move down below the 1.3100 support zone. The next key support is near 1.3080 level, below which there is a risk of a move towards the 1.3000 handle.
Looking at EUR/USD, the pair extended decline below the 1.0850 support level. Conversely, gold price rallied to $2,000 and crude oil price spiked to $130 before correcting lower.
Economic Releases
- UK BR Like-for-Like Retail Sales for Feb 2022 (YoY) - Forecast +15.2%, versus +8.1% previous.
- Euro Zone Gross Domestic Product for Q4 2021 (QoQ) - Forecast 0.3%, versus 0.3% previous.
- Euro Zone Gross Domestic Product for Q4 2021 (YoY) - Forecast 4.6%, versus 4.6% previous.
Elliott Wave View: Pullback in Gold Should Remain Supported
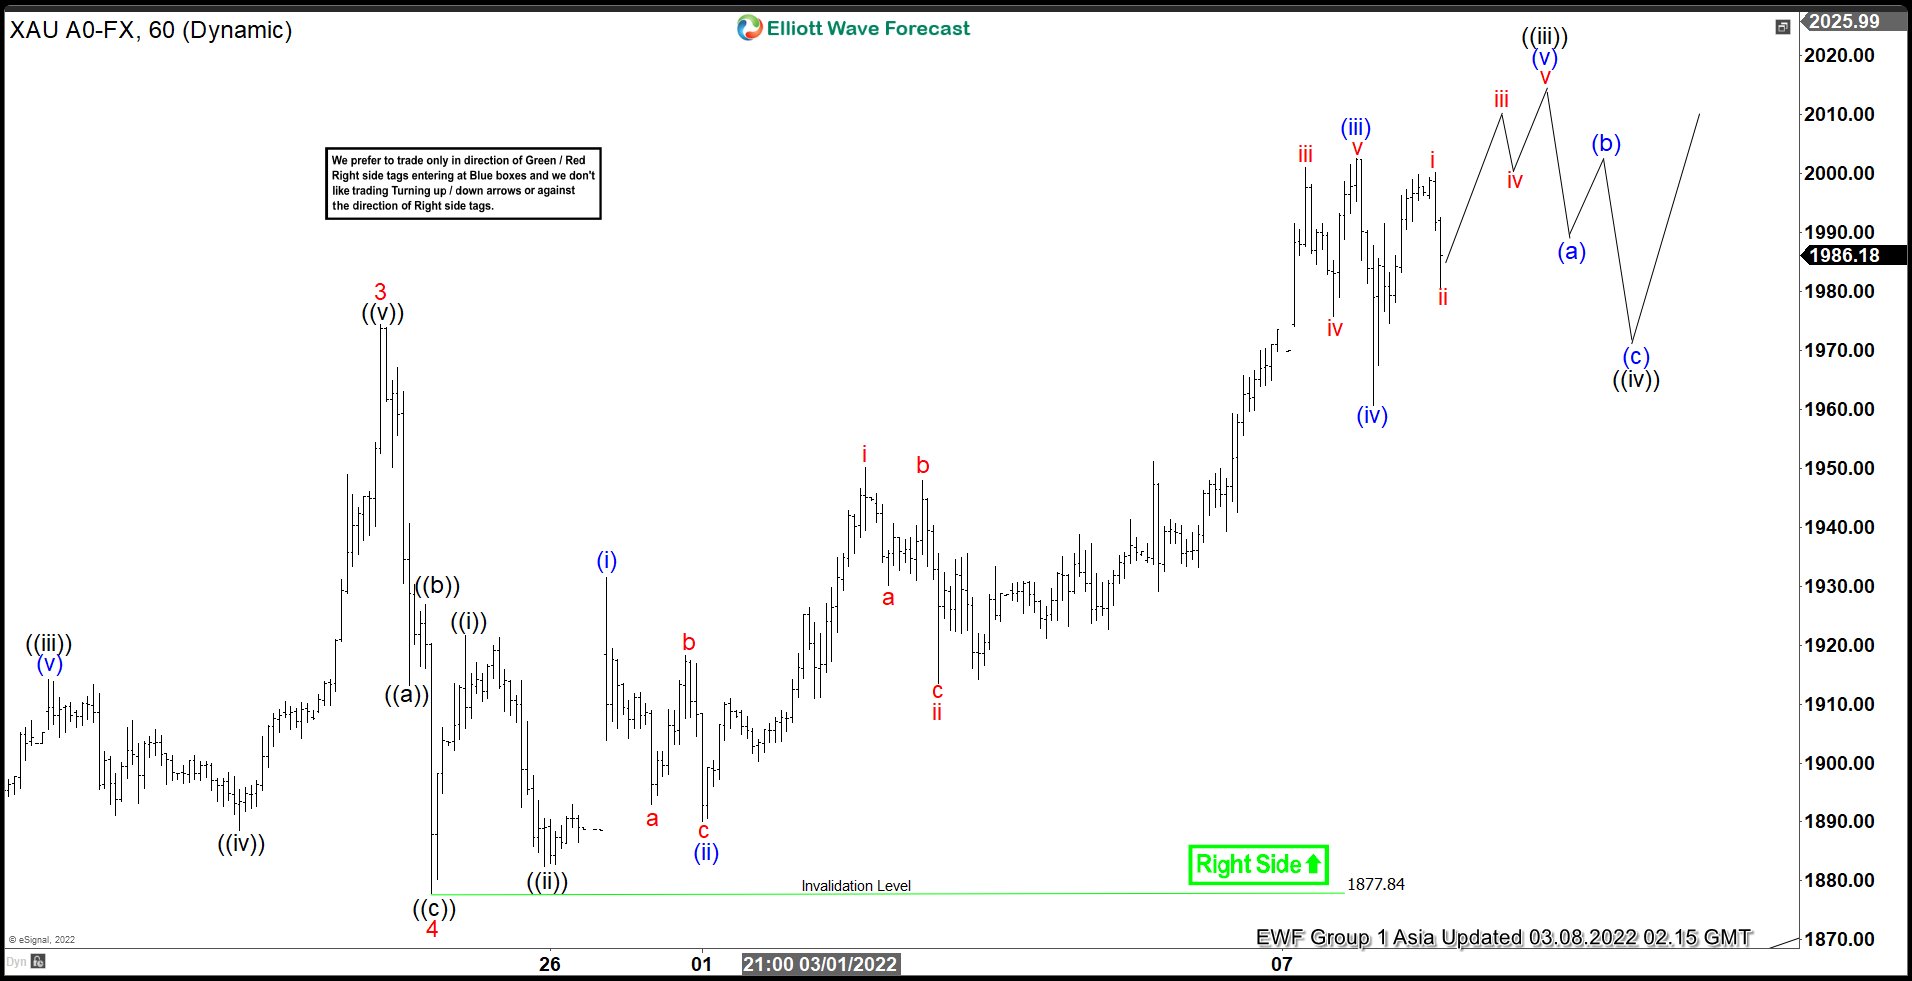
Short Term Elliott Wave View in Gold (XAUUSD) suggests that cycle from September 30, 2021 low is unfolding as a 5 waves impulse Elliott Wave structure. Up from September 30 low, wave 1 ended at 1877.15 and pullback in wave 2 ended at 1753.10. The metal then rallied higher in wave 3 towards 1974.40 and dips in wave 4 ended at 1877.84. Wave 5 higher is currently in progress with subdivision as another impulse in lesser degree.
Up from wave 4, wave ((i)) ended at 1921.59 and pullback in wave ((ii)) ended at 1882.50. Wave ((iii)) is nesting with wave (i) ended at 1931.47 and wave (ii) ended at 1890. The yellow metal then resumed higher in wave (iii) which ended at 2002.57, and wave (iv) pullback ended at 1960.70. Expect the yellow metal to extend higher to end wave (v) and this should complete wave ((iii)) in higher degree. Afterwards, it should pullback in wave ((iv)) before the next leg higher in wave ((v)) of 5. Near term, as far as pivot at 1877.84 low stays intact, expect pullback to find support in the sequence of 3, 7, or 11 swing for further upside.
Gold 1 Hour Elliott Wave Chart
GBP/USD is Down But Not Out
War in Ukraine led GBP/USD to sell off for a third consecutive day on Monday. The pair has dropped by c. 3.26% since the conflict in the Ukraine began on 24 September to recently trade near 1.3106. No doubt exists that price could drop even more substantially in coming days, but a key question is whether GBP/USD can withstand falling below, or potentially completely avoid the 1.30065 price region.
If it does, market confidence in GBP/USD could easily be restored as continuation of the August 2020 trend upwards would look more promising. The 1.30065 region is at the bottom of a downward flag pattern, the type associated with a bullish reversal.
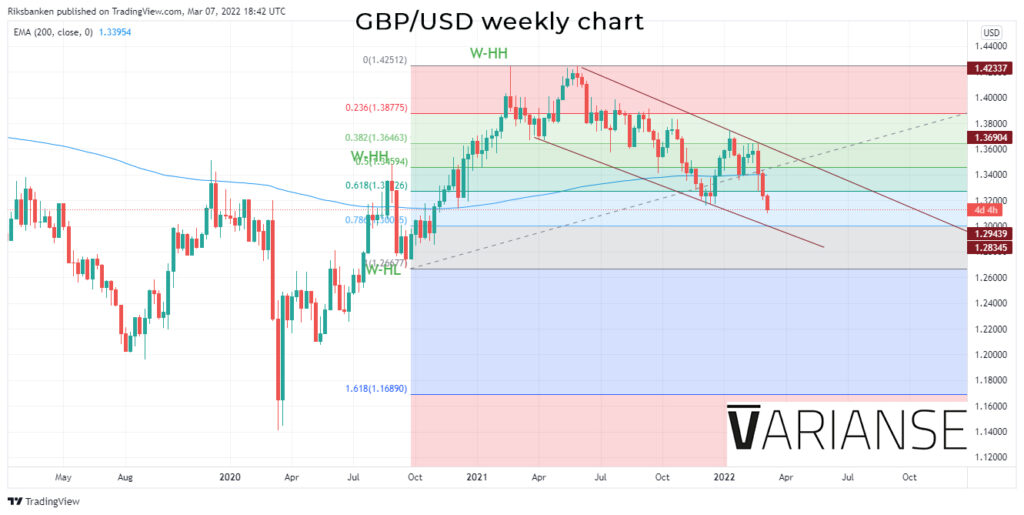
Should GBP/USD fail to hold close to the 1.30065 region, the prospects of a further drop to the 1.2700 region become closer to a reality. Further below, serious support doesn’t appear until the 1.2500 level. Therefore, keep in mind that 1.30065 also acts as an important barometer of future market sentiment. Traders could be swayed on which side GBP/USD ends up.
For the moment, however, the potential for an upside for GBP/USD should give traders food for though that at some point the market will view GBP/USD as cheap and price isn’t all that far away from a potential level. That is certainly different than having no hope of a respite in recent selling.
Dollar Index : Dollar Continues to Advance on Risk Aversion and Rising Hopes for Fed Rate Hikes
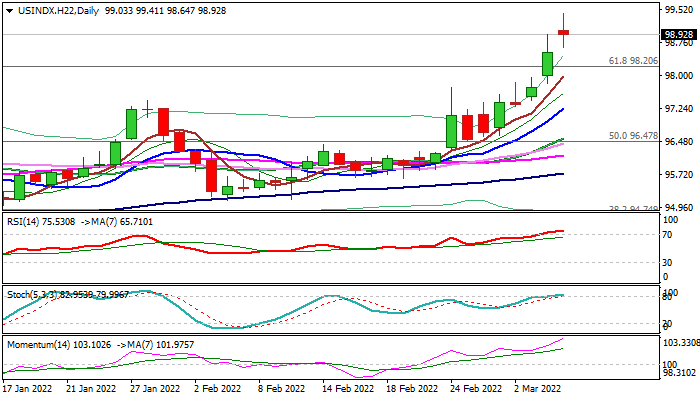
The dollar maintains firm tone against of basket of its major counterparts and extended gains to the highest since May 2020 on Monday.
High uncertainty over the war in Ukraine and pessimistic tone on soaring energy prices and expectations for further negative impact from the sanctions imposed on Russia, particularly on the EU, keep investors in defensive, with strong migration into safety, dominating in the markets at the beginning of the week.
Upbeat February US jobs data, released on Friday, further brightened the outlook for the US economic growth and added to expectations of Fed’s several rate hikes this year, with the first step expected on central bank’s policy meeting next week.
This additionally supports the greenback, which maintains strong bullish momentum and targets pivotal barriers at 100.00 and 100.34 (psychological / Fibo 76.4% of 103.80/89.15 fall), violation of which would generate fresh bullish signal for further advance, if market conditions remain dollar-favorable.
Res: 99.41; 100.00; 100.34; 101.00.
Sup: 98.93; 98.64; 98.20; 97.82.
Sunset Market Commentary
Markets
A month ago ECB president Christine Lagarde flagged the ECB would take a close look at the inflation scenario. If necessary, the review could lead to a reassessment of the ECB’s policy roadmap that was set out in December. One month later, inflation has developed in a way that probably the ECB deemed almost impossible. Today, the 10-y EMU inflation swap touched 2.80%, nearing the peak level of March 2008. In the current environment, this still might still result in the ECB holding a wait-and-see bias on Thursday, but that’s a different story. As such, the EMU inflation swap is catching up fast with the US measure which tested the 3.00% level. Today’s moves evidently was the result of another sharp rise in commodity prices as the weekend provided little perspective on the solution of Russian-Ukraine conflict and as the US signaled that it was considering a ban on Russian oil imports. Brent oil (currently $121 p/b) almost touched $140. European gas at some point jumped 75%+ compared to Friday’s close. More ‘modest’ but still exceptional rises were visible in a wide range of other commodities. Persistent geopolitical uncertainty combined with this new tax on (especially European) consumers and firms worldwide triggered a new sharp equity sell-off in Asian and early European dealings with the Eurostoxx 50 losing about 4.75% soon after the open. However, risk assets later in the session succeded a remarkable rebound (short squeeze?). Commodities also reversed part of the initial spike. Headlines on new talks between Ukraine and Russia maybe played a role, even as Russia is holding to the position that Ukraine should meets its demands. Germany rejecting the idea of a ban on Russian oil and gas maybe also helped. European indices currently reversed most of this morning loss (Eurostoxx + 0.25%). US indices are losing about 0.75%. Interest rate markets to some extent copied the gyrations in global risk sentiment. Even so, early declines in yields were modest given the sharp risk-off and core yields in the meantime even rebounded sharply. The US yield curve bear flattens with yields rising between 5 bps (2-y) and 1.5bps (30-y). German yields are moving between unchanged (30-y) and 5 bps for the 2-10 y sector. For the German 10-y yield a new test of the -0.1% area was again rejected (currently -0.015%). Interestingly, even intra-EMU spreads overcame initial risk-off and narrow slightly (Greece/Spain -2 bps).
Similar story on FX markets. The euro initially again felt heavy selling pressure with EUR/USD coming close to the 1.08 big figure. However, in line with the ‘risk rebound’, the pair currently again trades near 1.09. EUR/CHF temporarily dropped below parity, but is currently changing hands in the 1.01 area. Despite overall volatility, USD/JPY is holding a tight sideways range (115.23). Elevated commodity prices apparently prevent the yen from fully playing its safe haven role. Sterling staged a unconvincing performance today. Cable (1.3180) temporarily dropped below the December 2021 low and the intraday rebound lacks momentum. EUR/GBP (0.828) even trades marginally stronger compared to Friday’s close. In Central Europe the zloty and the forint touched new all-time lows against the euro. EUR/PLN even briefly touched the 5.00 mark. EUR/HUF halted just shy of the 400 barrier. At EUR/PLN 4.97 and EUR/HUF 393 the CE intraday rebound remains modest. EUR/CZK (25.70) held south of the 26.00 barrier as the CNB last week indicated to use its huge currency reserves to address unwarranted CZK weakness.
News Headlines
Some European Union countries are pushing back against giving Ukraine the so-called candidate status this week. Especially countries in the western part including the Netherlands and Germany first want the Commission to deliver its opinion on Ukraine’s readiness for such membership before taking any political decision. Focus in first instance should be on delivering practical support and ending the war instead of kicking off a process that could take a decade to finish. Ukrainian president Zelenskiy formally applied to join the EU end of last month. Nine countries, led by Poland and the Baltic nations have voiced their support to grant candidate status and start the lengthy process of admission. EU leaders will discuss Ukraine’s request when they meet on Thursday near Paris.
Aussie Coming Off Sizzling Week
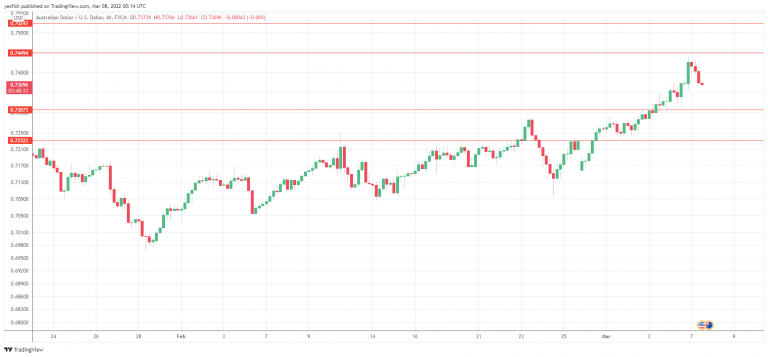
The Australian dollar has taken a breather, as it trades just slightly below the 0.74 line. AUD/USD has posted small losses on Monday, after posting impressive gains of 2% last week.
The war in Ukraine has dampered risk appetite, which in normal times would hurt the risk-sensitive Australian dollar. These are, of course, far from normal times, and the surge in commodity prices has boosted the Aussie despite the lack of risk appetite on the part of investors.
The Australian economy continues to recover and the markets are expecting the RBA to embark on a rate-hike cycle in order to curb rising inflation. The RBA has said it wants to see inflation remain sustainably in its 2%-3% target and would like to see wage growth accelerate. There is a good chance that the RBA will hike rates in June or shortly after, and expectations of higher rates have also boosted the Australian dollar.
The week started on a positive note, a rose to 60.0 in February, up from 56.6 a month earlier. This points to strong expansion in the services sector, which is benefitting from pent-up demand after Covid lockdowns were removed. The employment market continues to show a shortage of workers, as ANZ Job Advertisements jumped by 8.4% in February, after two straight negative readings.
On Tuesday, we’ll get a look at NAB Business Confidence and Westpac Consumer Sentiment reports. Consumer confidence has been weak, with the past three releases all below zero, which indicates pessimism. Will we see a rebound in the upcoming release? RBA Governor Philip Lowe will speak at a business summit, and investors will be listening closely for a any clues with regard to rate policy.
AUD/USD Technical
- There is weak resistance at 0.7393. This is followed by a resistance line at 0.7502
- AUD/USD has weak support at 0.7313. Below, there is support at 0.7204
GBP/USD Outlook: Cable Hits a 15-month Low on Probe through Key Supports
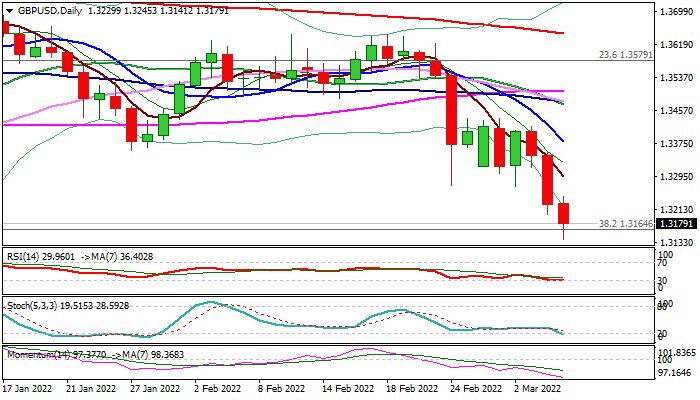
Cable remains firmly in red on Monday and extends steep fall into third straight day, dragged by fresh risk aversion that pushed global stocks lower.
After last week’s strong upside rejection and weekly close below pivotal 1.33 support (the pair was down 0.7% for the week), bears cracked next significant supports at 1.3164/61 (Fibo 38.2% of 1.1409/1.4249/Dec 8 low), marking full retracement of 1.3161/1.3748 upleg and pressuring another key level at 1.3121 (200WMA).
Earlier completion of failure swing pattern on daily chart added to strong bearish stance, with firm break of 1.3161 pivot to complete larger failure swing pattern on weekly chart and generate stronger bearish signal for extension towards 1.3000 (psychological) and 1.2829 (50% retracement of 1.1409/1.4249.
Firmly bearish daily studies support scenario, however bears may face headwinds on oversold condition and hold for consolidation before resuming.
Bears are expected to remain in play as long as price action stays below broken 1.3300 support, now reverted to strong resistance.
Res: 1.3245; 1.3272; 1.3300; 1.3320.
Sup: 1.3161; 1.3141; 1.3106; 1.2950.
USD/JPY Mid-Day Outlook
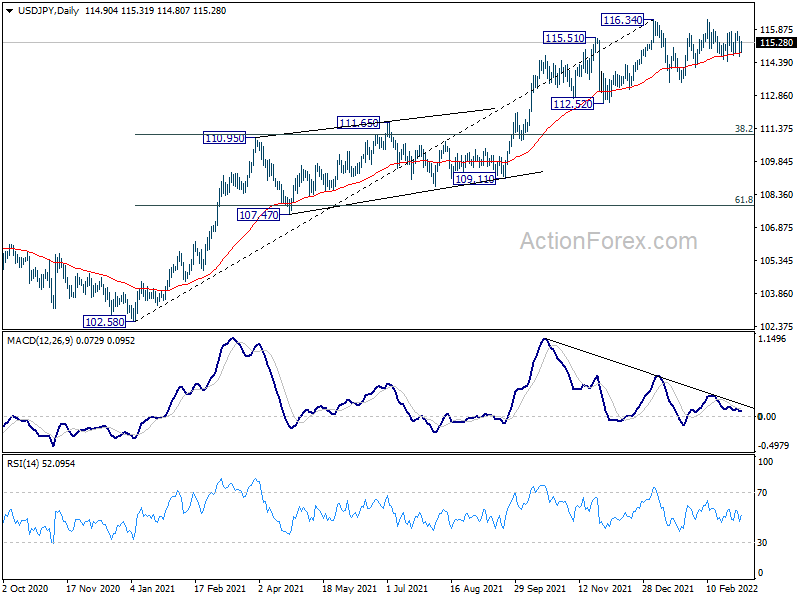
Daily Pivots: (S1) 114.49; (P) 115.02; (R1) 115.40; More...
Intraday bias in USD/JPY remains neutral as sideway trading continues. On the upside, firm break of 116.34 will resume larger up trend from 102.58 to 118.65 long term resistance next. On the downside, though, break of 114.40 will continue the corrective pattern from 116.34 with another fall to 113.46 support.
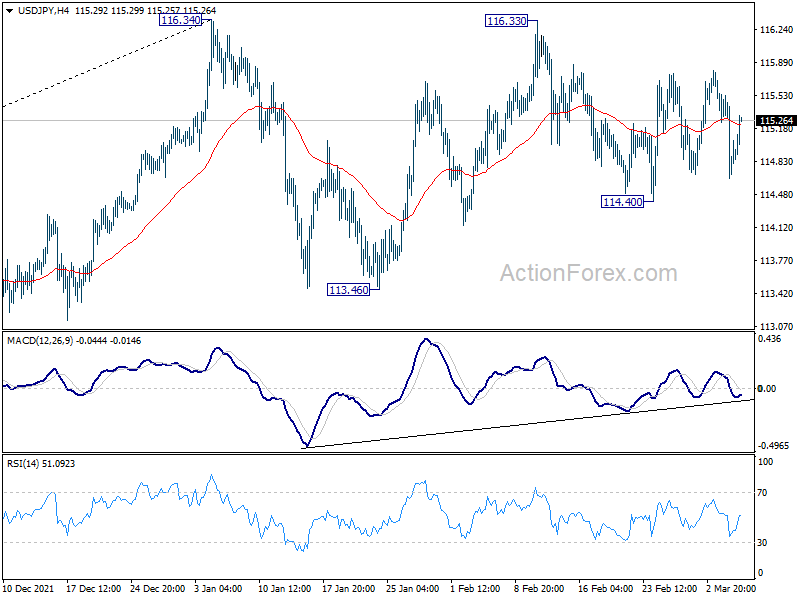
In the bigger picture, no change in the view that rise from 102.58 is the third leg of the up trend from 101.18 (2020 low). Such rally should target a test on 118.65 (2016 high). Sustained break there will pave the way to 120.85 (2015 high) and raise the chance of long term up trend resumption. This will remain the favored case as long as 55 week EMA (now at 111.64) holds.
USD/CHF Mid-Day Outlook
Daily Pivots: (S1) 0.9152; (P) 0.9181; (R1) 0.9198; More....
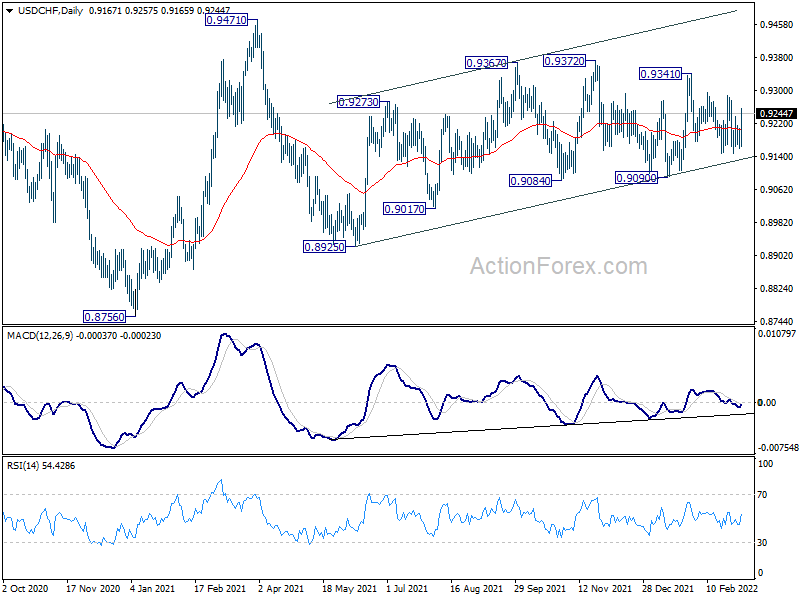
Range trading continues in USD/CHF and intraday bias remains neutral for the moment. Choppy rise from 0.8925 would still be in favor to extend higher as long as 0.9090 support holds. Break of 0.9341 will target 0.9372 resistance and then 0.9471. On the downside, however, break of 0.9090 will bring deeper fall back to 0.8925 support.
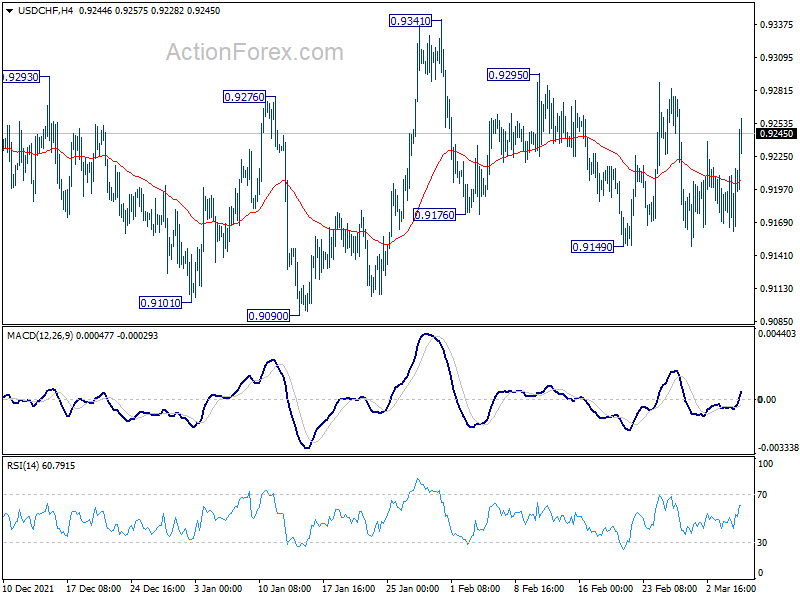
In the bigger picture, medium term outlook will be neutral at best as long as 0.9471 resistance holds. Larger down trend could still extend through 0.8756 (2021 low). However, firm break of 0.9471 will argue that the trend has already reversed and rebound the rally from 0.8756 with another impulsive move.