Sample Category Title
First Impressions: RBNZ Monetary Policy Statement
First impressions of the RBNZ's February 2022 Monetary Policy Statement.
RBNZ Monetary Policy Statement, February 2022
- The Reserve Bank’s decision to increase the OCR by 25 basis points to 1% was as expected.
- However, the overall tone of the statement was notably more hawkish.
- The Committee noted that the decision between a 25bp and a 50bp increase was finely balanced.
- The RBNZ lifted its projected OCR track to a peak of around 3.4% in 2024, compared to a 2.6% peak in its November review.
- Furthermore, it announced a plan to reduce the size of its Government bond holdings over time through sales as well as maturities. This would presumably put some upward pressure on longer-term interest rates, adding to the overall tightening in financial condition.
- The RBNZ expects inflation to remain above the 1-3% target range through to early next year, and to linger in the upper half of the range in the following years.
Implications
The biggest surprise in today’s statement was the extent of the lift in the projected OCR track – higher even than our top-of-the-market forecast of 3%. The RBNZ’s activity and inflation forecasts are similar to ours in many respects, so the difference in view seems to lie in a judgement about what monetary policy settings will be needed to achieve those outcomes.
The RBNZ clearly faces a challenge in bringing inflation pressures under control. But as we noted in our latest Economic Overview, the housing market is already cooling in response to higher interest rates, and border restrictions and the spread of Omicron will weigh on the overall demand impulse over this year. As a result, we think the risks around our forecast of a 3% peak OCR are starting to look more two-sided.
For now, we continue to expect a series of 25bp hikes at upcoming policy reviews. However, given how much work the RBNZ believes it has ahead of it, the risk of a 50bp move at any given meeting remains live.
Full RBNZ statement
More tightening needed
The Monetary Policy Committee today increased the Official Cash Rate (OCR) to 1 percent. The Committee also agreed to commence the gradual reduction of the Reserve Bank’s bond holdings under the Large Scale Asset Purchase (LSAP) programme - through both bond maturities and managed sales.
The Committee agreed it remains appropriate to continue reducing monetary stimulus so as to maintain price stability and support maximum sustainable employment.
The level of global economic activity is generating rising inflation pressures, exacerbated by ongoing supply disruptions. The pace of global economic growth has slowed however, due to the general elevated uncertainty created by the persistent impacts of COVID-19, and clear signals that monetary conditions will tighten over the course of 2022.
In New Zealand, underlying economic strength remains in the economy, supported by aggregate household and business balance sheet strength, fiscal policy support, and continued strong export returns. However, some short-term economic disruption is expected given the current growing COVID-19 health challenge. The high vaccination rates across New Zealand will assist significantly to reduce this disruption.
Economic capacity pressures have continued to tighten. Employment is now above its maximum sustainable level, with a broad range of economic indicators highlighting that the New Zealand economy continues to perform above its current potential.
Headline CPI inflation is well above the Reserve Bank’s target range, but will return towards the 2 percent midpoint over coming years. The near-term rise in inflation is accentuated by higher oil prices, rising transport costs, and the impact of supply shortfalls. These immediate relative price movements risk generating more generalised price rises, especially given the current domestic capacity constraints.
The Committee agreed that further removal of monetary policy stimulus is expected over time given the medium-term outlook for growth and employment, and the upside risks to inflation.
Gold Price Faces Big Challenge Near $1,920
Key Highlights
- Gold price rallied above the $1,880 and $1,900 resistance levels.
- A key bullish trend line is forming with support near $1,875 on the 4-hours chart.
- EUR/USD is still struggling to clear the 1.1400 resistance zone.
- GBP/USD corrected lower after it was rejected near 1.3640.
Gold Price Technical Analysis
Gold price formed a base above the $1,780 level and started a fresh increase against the US Dollar. The price broke the $1,800 and $1,820 resistance levels to move into a positive zone.
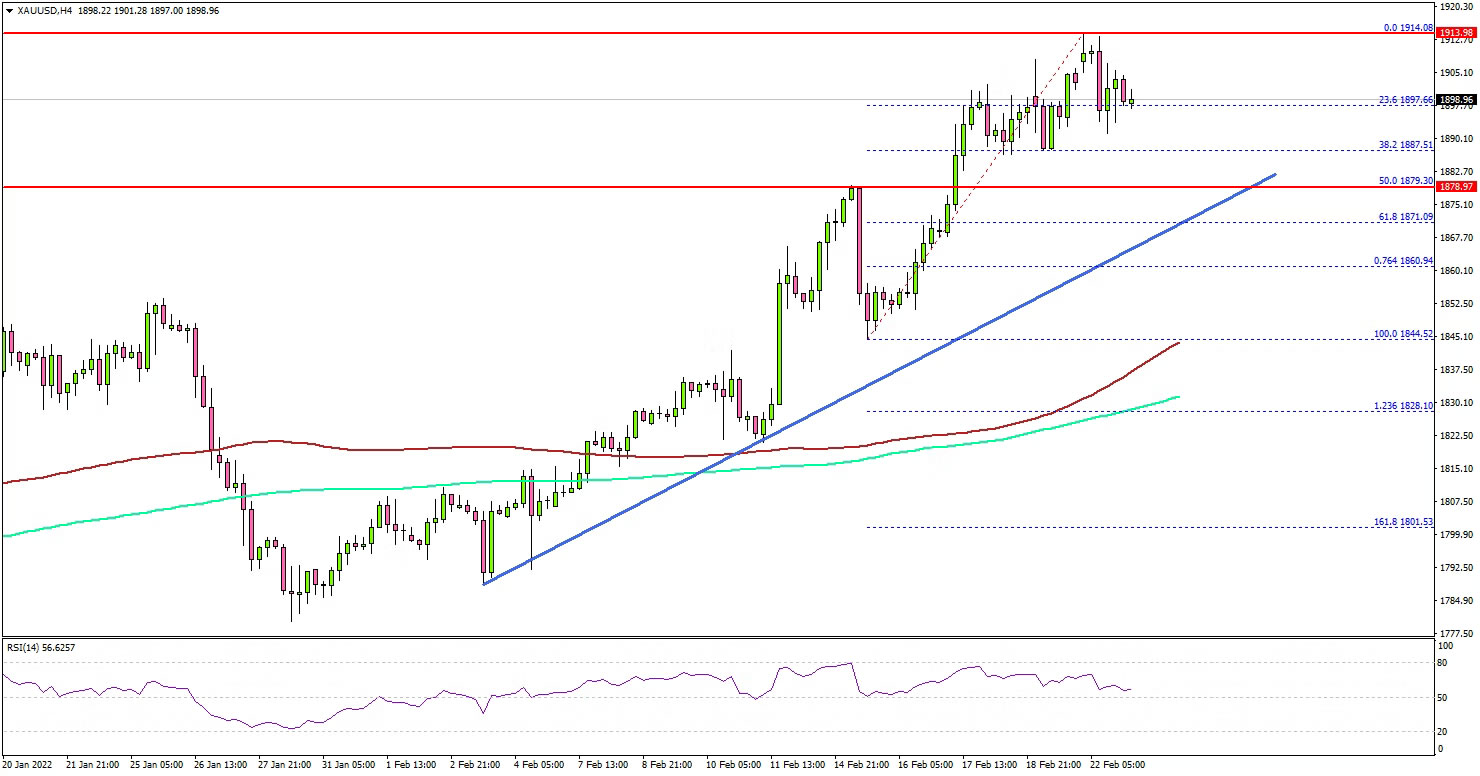
The 4-hours chart of XAU/USD indicates that the price was able to settle above the $1,880 resistance, the 100 simple moving average (red, 4-hours) and the 200 simple moving average (green, 4-hours).
It even climbed above the $1,900 level. A high is formed near $1,915 and the price is now consolidating gains. On the upside, the bulls are facing a major hurdle near $1,915 and $1,920. A close above $1,920 might set the pace for a move to $1,950.
If not, the price might correct lower and trade below the $1,885 level. The next major support is near $1,875 and a key bullish trend line on the same chart. Any more losses might send the price towards $1,850.
Fundamentally, the US Manufacturing Purchasing Managers Index (PMI) for Feb 2022 (Prelim) was released yesterday by the Markit Economics. The market was looking for a rise from 55.5 to 56.0.
The actual result was positive, as the US Manufacturing Purchasing Managers Index (PMI) increased from 55.5 to 57.5. Besides, the US Services PMI increased from 51.2 to 56.7.
Looking at EUR/USD, the pair is still facing a strong resistance near 1.1380 and 1.1400. Besides, GBP/USD reacted to the downside after the bears protected the 1.3640 resistance.
Economic Releases to Watch Today
- Germany’s GfK Consumer Confidence for March 2022 – Forecast -6.3, versus -6.7 previous.
What is Gold’s Rise Telling Us Indirectly?
The Gold market presented significant strength moving upwards in the most recent daily sessions. Gold has moved in positive territory for the past 3 consecutive weekly sessions, while it is currently trading at a new 2022 high as a result of the recent bullish interest from traders. The global interest for the Gold market remains at extremely high levels especially at times such as the current, where geopolitical uncertainty seems to be the main focus. In this report we will be looking into the most important news moving Gold prices at the moment. We will finalize with our Gold technical analysis and provide a complete report for traders to work with.
In the past days and in the past week, Gold’s largest daily movement was carried out on the 17th of February. Gold strengthened in the European session on Thursday the 17th with no significant economic releases to validate the movement except the FOMC meeting minutes that took place the previous night. Through the report it was confirmed that inflationary pressures in the US have broadened in the second half of 2021 and may have now impacted sectors that were not affected by the pandemic in the first place. We must also highlight that US Inflation rates for January 2022 increased further possibly paving the road for the FOMC to start enacting interest rate hikes. Furthermore, analyst speculations on the path the central bank may select, can be strengthening or weakening the USD depending on how hawkish or bearish the sentiment is. At the moment, the FOMC seems to follow a more cautious or patient approach which may be restraining the US dollar but pushing Gold prices higher. In the past week, the USD Index gained marginally while Gold surged remarkably, implying the correlation between them remains weak yet positive. Understanding when Gold’s volatility increases can provide hints as to what may be motivating traders in the short term.
The main attraction for the Gold market and the global media scene at the moment, remains the developments on the Russia Ukraine subject. In the past week and specifically on the 18th of February the Donbass area in Ukraine announced evacuations, with people moving into Russian territory. Gold seems to be absorbing positive volatility from developments in Ukraine due to the fact that the tensions could be intensifying but also because it can lead to further economic risk. Europe’s trade relations to Russia in terms of energy sources can be tarnished while the subject could add up to already worrying inflationary pressures. As noted in our previous week’s report, in the scenario of escalation of tensions we may see Gold prices picking up while in a de-escalation scenario Gold prices may return lower.
As a final note, the upcoming economic releases from the US in the days to come, have the potential of moving Gold prices and caution is advised if traders are to place orders prior, during or after the releases. On Wednesday the 24th of February we get the GDP 2nd Estimate rate for Q4, the weekly Initial Jobless Claims figure and the New Home Sales-Units for January. On Thursday the 25th we get the Consumption Adjusted and Durable Goods rates for January while the Final University of Michigan Economic sentiment figure for February will also be released. On Tuesday the 1st of March we get the important ISM Manufacturing PMI figure for February.
Technical Analysis
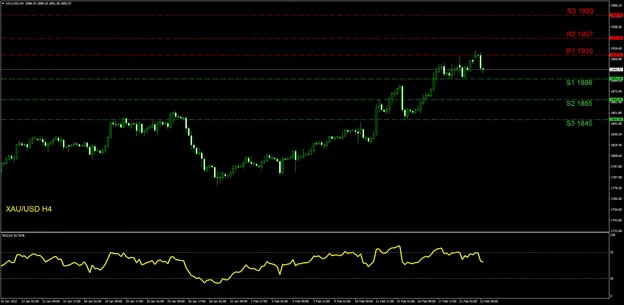
XAU/USD H4
The price action has recently reached and tested the (R1) 1910 resistance level but returned to lower grounds eventually. Note the (R1) 1910 is the highest level Gold has reached since June 2021. If this level is surpassed upwards then the (R2) 1927 line is in our view the most probable stop for traders. However, as our fundamental subjects seem to remain intact we have added also the (R3) 1950 level which can become a target in a strong bullish interest scenario. In case the precious metal is undertaken by a selling interest, the (S1) 1886 level can be reached first while the (S2) 1865 level is our next level, if the selling is to continue. Our final support level stands at the (S3) 1845 hurdle which can be reached in an extensive bearish trend line. Please note the RSI indicator has dropped below 70 implying some selling has taken place in the most recent hours. Overall Gold has breached new yearly high levels consistently thus we tend to support an upward bias, as our personal view.
Elliott Wave View: Nasdaq (NQ) Looking to Do Bigger Pullback
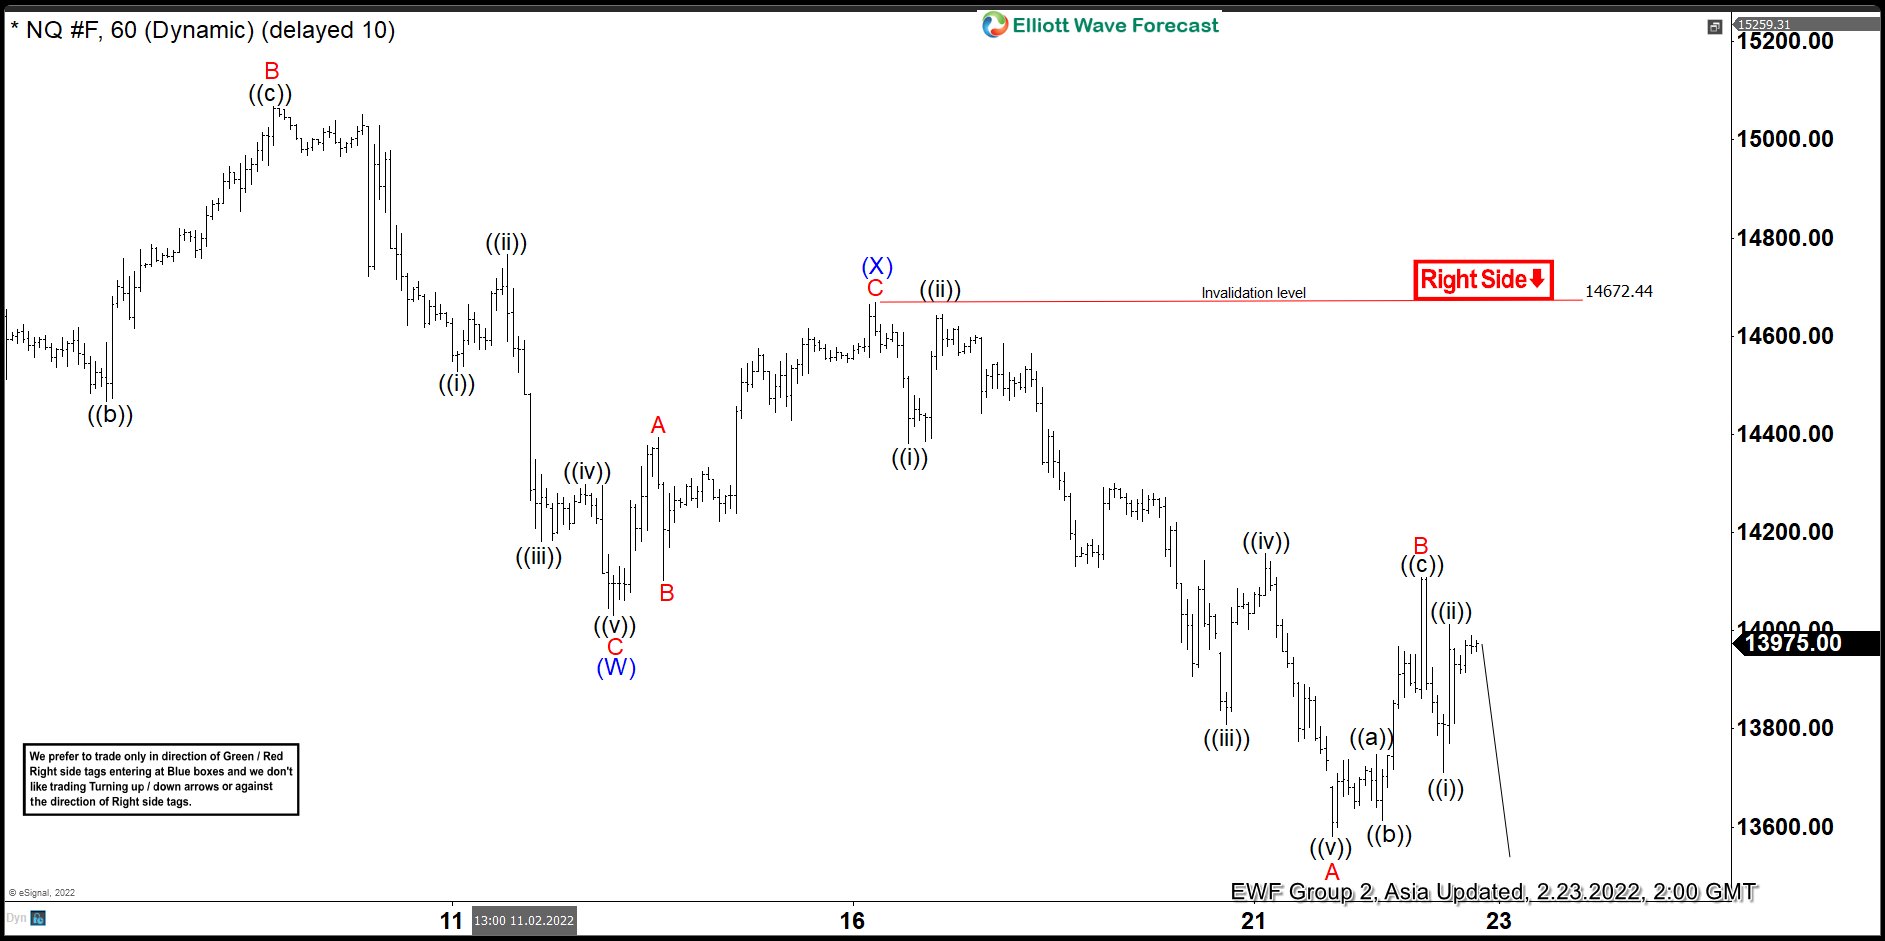
Short Term Elliott Wave in Nasdaq (NQ) suggests that the decline from February 2, 2022 peak is unfolding as a double three Elliott Wave structure. Down from February 2, wave A ended at 14362.75, and rally in wave B ended at 15068. Index then resumes wave C lower towards 14031. This completed wave (W) in higher degree. Corrective rally in wave (X) ended at 14672.44 with internal subdivision as a zigzag structure.
Up from wave (W), wave A ended at 14394 and pullback in wave B ended at 14102. Wave C higher ended at 14672.44 which completes wave (X) in higher degree. Wave (Y) lower is in progress with internal subdivision as a zigzag. Down from wave (X), wave ((i)) ended at 14381 and wave ((ii)) ended at 14645, Wave ((iii)) ended at 13809.75, wave ((iv)) ended at 14157.50, and final leg lower wave ((v)) ended at 13580.25. This completed wave A of (Y). Wave B of (Y) rally is proposed complete at 14108.25 and Index has turned lower. Near term, as far as pivot at 14672.44 high stays intact, expect rally to fail in 3 or 7 swing for further downside.
Nasdaq (NQ) 60 Minutes Elliott Wave Chart
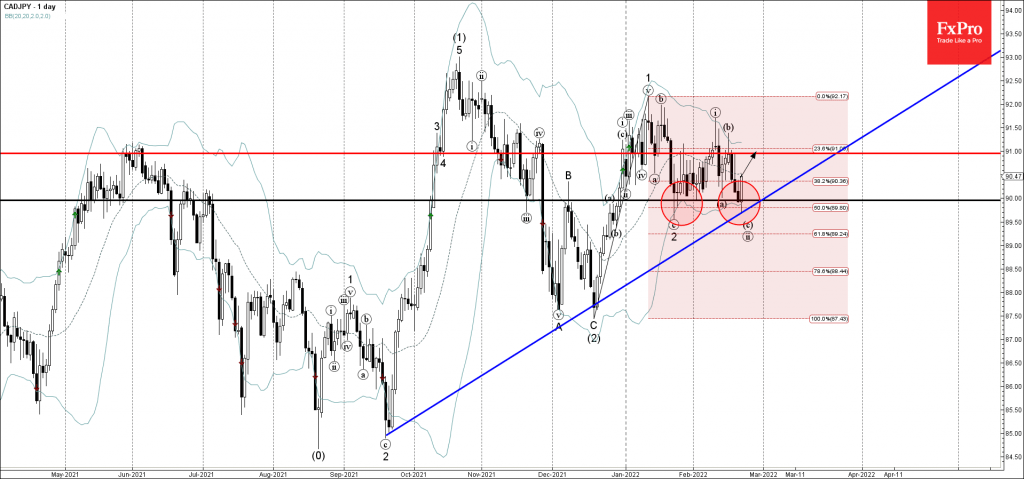
CADJPY Currency Pair Wave Analysis
- CADJPY currency pair reversed from support area
- Likely to rise to resistance level 91.00
CADJPY currency pair earlier reversed up from the support zone located between the round support level 90.00 (which has been reversing the pair from the middle of January), support trendline from September, lower daily Bollinger Band and the 50% Fibonacci retracement of the previous sharp upward impulse wave 1 from December.
The upward reversal from this support area stopped the earlier minor ABC correction (ii).
Given the strong yen outflows – CADJPY currency pair can be expected to rise further toward the next resistance level 91.00.
Sunset Market Commentary
Markets
Markets have been preparing for the worst case scenario in the Ukrainian conflict and remarkably breathed a sigh of (short term) relief as it played out. The Russian “peace-keeping” mission in the self-declared separatist republics in the Donbas region met with outrage by the west who is preparing sanctions against the country. These include halting the German certification process to exploit the NordStream 2 pipeline and preparing some sort of financial embargo. The Russian ruble crashed the past couple of days towards the 2020 lows around USD/RUB 80 and is trading there volatile today. Brent crude set an intraday high at $99.5/b. It has been since the summer of 2014 since we’ve seen 3 digits for the black gold. The real precious metal closes in on $1916/ounce resistance which is the June 2021 top. On broader markets, main European equity indices recovered from steep opening losses to currently trade flat on the day. US stock markets lose around 0.5% at the start, but keep in mind that they were closed yesterday in observance of President’s Day. Core bonds showed the biggest momentum turnaround, feeling new selling pressure. Likely as higher commodity prices resulting from the conflict risk amplifying inflationary dynamics and hence speed up policy responses. The US yield curve bear flattens with yields rising by 5.2 bps (2-yr) to 0.4 bps (30-yr). The optical European underperformance against US Treasuries is again partly result from yesterday’s action. German yields add 8.4 bps (3-yr) to 4 bps (30-yr) in a daily perspective. Peripheral bonds perform relatively well, tightening up to 3 bps for Italy. EUR/USD retraced on yesterday’s steps, trading again a little bit higher in well-known 1.13 big figure. The pair is currently changing hands around 1.1340. Sterling is today’s underperformer with EUR/GBP surging from 0.8310 towards 0.8370. UK Gilts today outperform German Bunds. Hawkish BoE governor Ramsden said that some further modest tightening in monetary policy is likely to be appropriate in coming months, but pushed back against aggressive market pricing. The eco calendar contained improving German Ifo investor sentiment – in line with PMI’s yesterday – but didn’t impact trading.
News Headlines
The Belgium Business Barometer (slowly) declined further from 2.7 in January to 2.3 in February, according to monthly business survey published by the National Bank of Belgium. It was the third consecutive monthly decline. Especially sentiment in business related services deteriorated as the managers’ outlook for general demand faced a substantial downwardly revision. The decline in the manufacturing industry was limited (0.3 from 0.8) and was due to a less favourable assessment in total order books and stock levels. After three consecutive falls, sentiment in trade improved from -4.8 to -2.6 due to positive demand forecasts and projections of orders placed with suppliers. Sentiment in the building industry improved from 0.2 to 2.3. The overall smoothed synthetic curve, reflecting the underlying trend, continued to drop slightly.
The National Bank of Hungary today as expected raised the corridor of its policy rates by 50 bps. In order to anchor inflation expectations and mitigate second-round inflation risks, the central bank raised the base rate and the overnight deposit rate to 3.40%. The overnight and the one-week collateralized lending rates were increased to 5.40%. The MNB will continue to set the one-week deposit rate at weekly tenders. The MPC indicates that risks to the outlook for inflation have increased and continue to be on the upside, which necessitates the continuation of the base rate tightening cycle on a monthly basis. Deputy governor Virag was quoted that inflation might rise to 8.0%/8.5% in February. After initially losses due to regional geopolitical tensions, the forint intraday rebounded to the EUR/HUF 355.80 area.
GBP/USD Outlook: Cable Turns South on Dovish Comments from BoE Policymaker
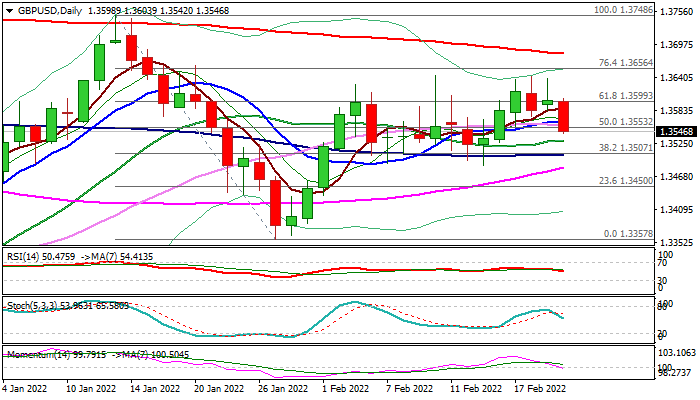
Cable lost traction on Tuesday and fell to four-day low, following repeated failure to sustain break above key 1.36 barrier (Fibo 61.8% of 1.3748/1.3357 descend).
Near-term sentiment softened on renewed tensions over Ukraine and relatively dovish comments from BoE Hawk Ramsden, who said that some further modest tightening is likely to be appropriate, deflating expectations for more aggressive action from BoE after he asked for 0.5% hike on Feb 3 policy meeting as the only internal MPC member.
Fresh dip weakens near-term structure and pressuring pivotal supports at 1.3539/33 (daily cloud top/Fibo 38.2% of 1.3357/1.3642 upleg), with firm break here to further soften the tone and risk drop towards next strong supports at 1.3500 zones (100DMA/50% retracement of 1.3357/1.3642).
South-heading 14-d momentum on daily chart is breaking into negative territory and support fresh bears, but the action might be slowed or even contained by the top of relatively thick daily cloud.
Res: 1.3564; 1.3600; 1.3615; 1.3642.
Sup: 1.3533; 1.3509; 1.3500; 1.3486.
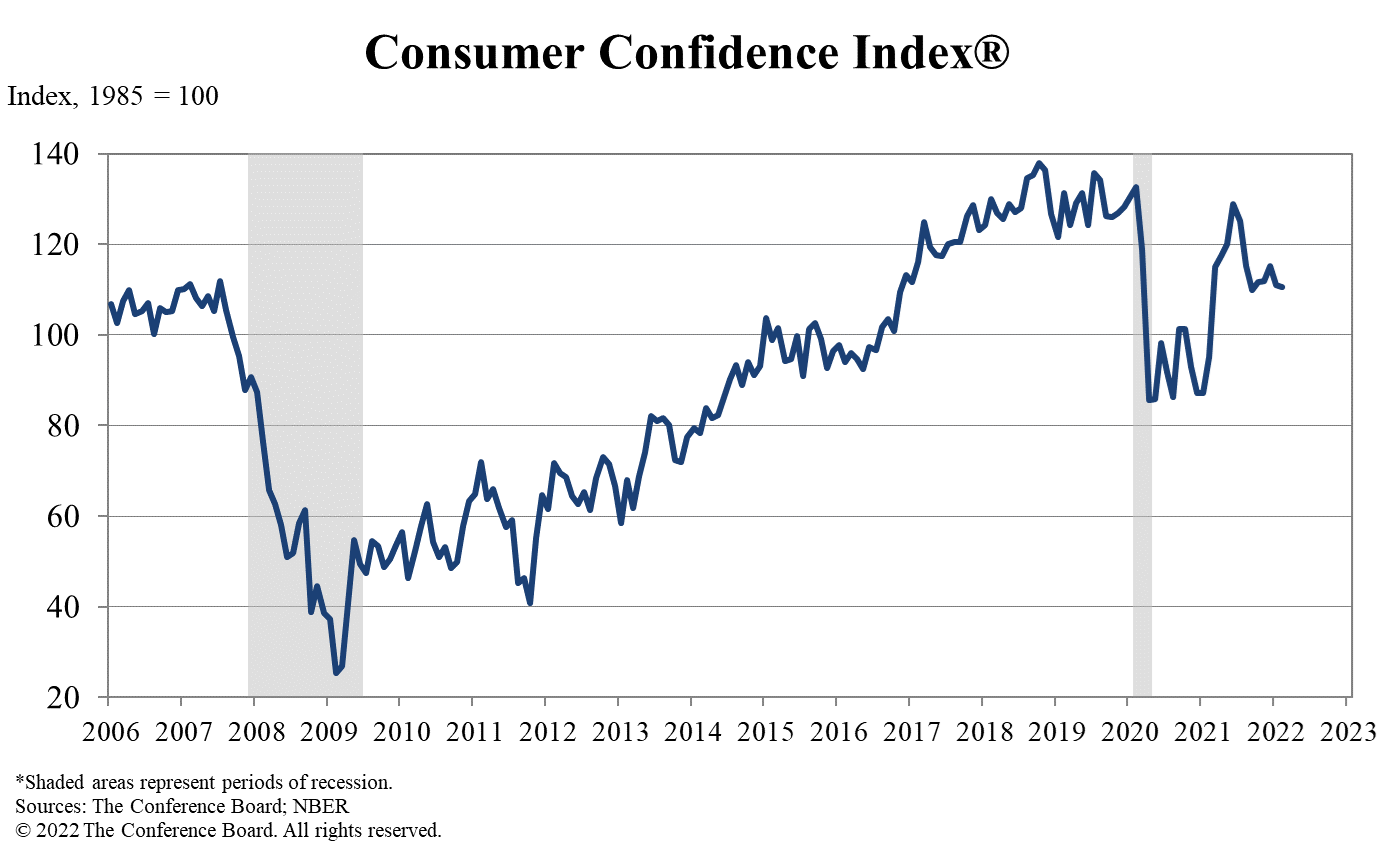
US consumer confidence dropped to 110.5, down slightly for a second consecutive month
US Conference Board Consumer Confidence index dropped from 113.8 to 110.5 in February, above expectation of 110.2. Present Situation Index improved from 114.5 to 145.1. Expectations Index dropped from 88.8 to 87.5.
"Consumer confidence was down slightly for a second consecutive month in February," said Lynn Franco, Senior Director of Economic Indicators at The Conference Board.
"The Present Situation Index improved a touch, suggesting the economy continued to expand in Q1 but did not gain momentum. Expectations about short-term growth prospects weakened further, pointing to a likely moderation in growth over the first half of 2022. Meanwhile, the proportion of consumers planning to purchase homes, automobiles, major appliances, and vacations over the next six months all fell."
"Concerns about inflation rose again in February, after posting back-to-back declines. Despite this reversal, consumers remain relatively confident about short-term growth prospects. While they do not expect the economy to pick up steam in the near future, they also do not foresee conditions worsening. Nevertheless, confidence and consumer spending will continue to face headwinds from rising prices in the coming months."
BTCUSD Retains Bearish Structure but RSI Suggest Bullish Move
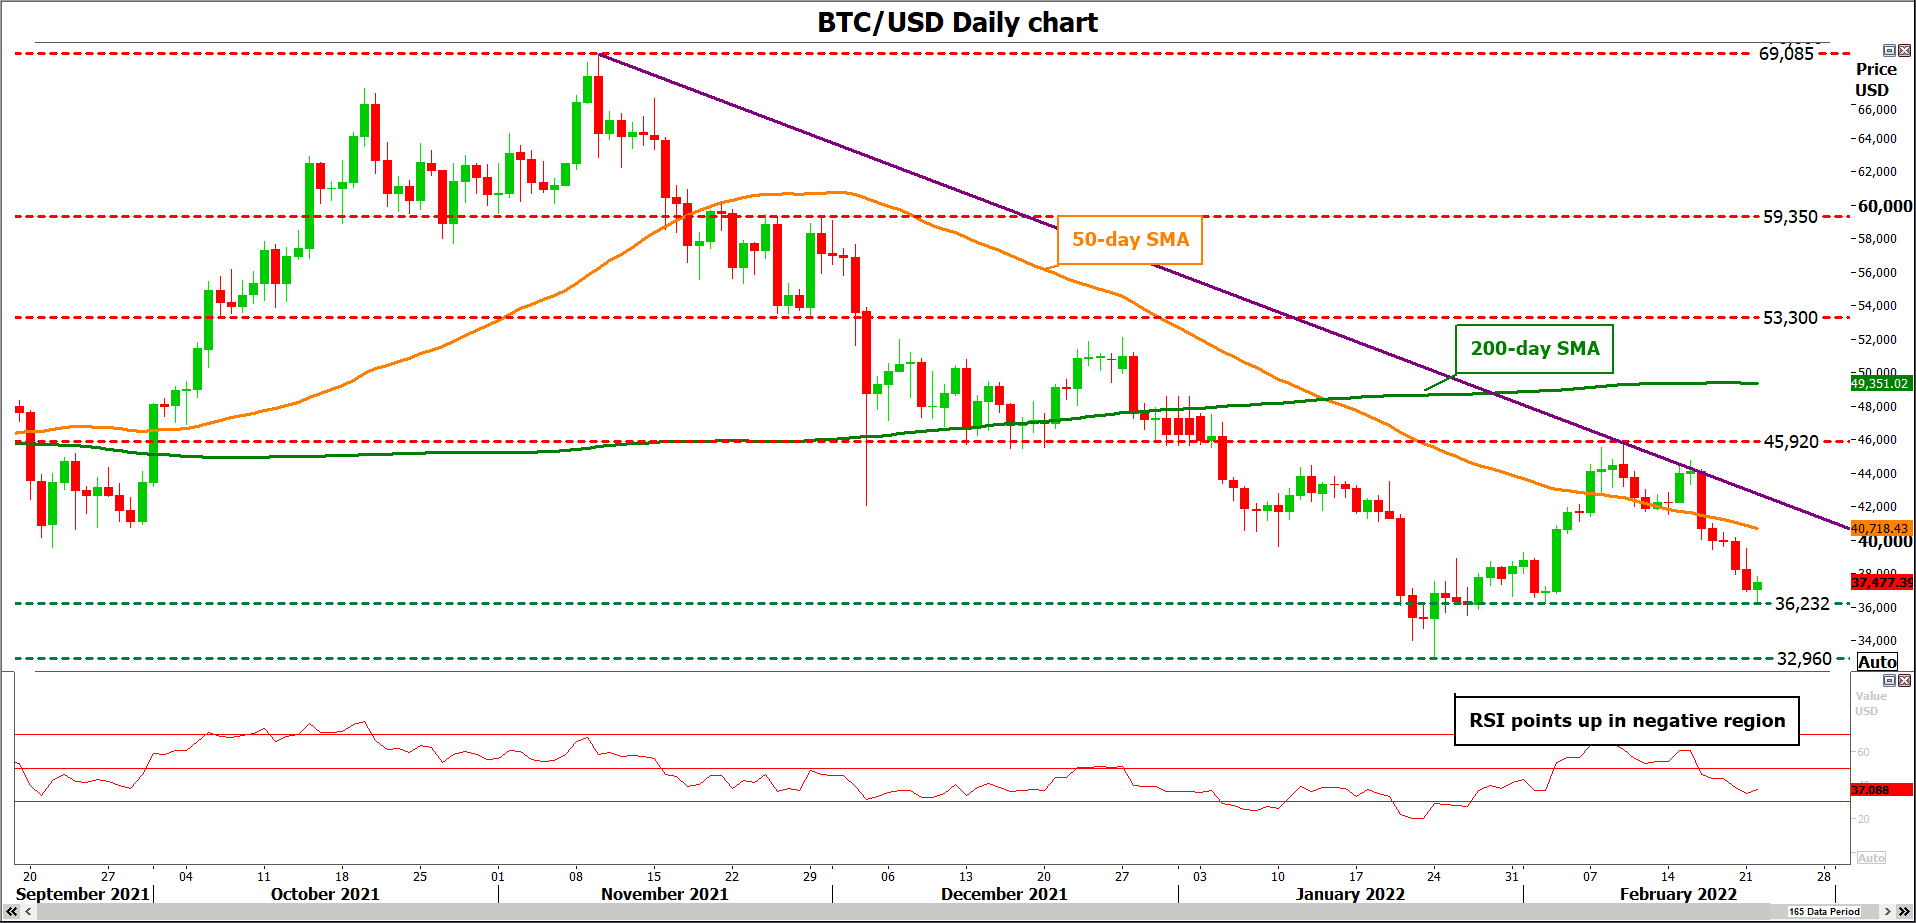
BTCUSD found support at the 36,232 level after the negative movement that started after the pullback off the descending trend line. The RSI indicator is heading upwards in the negative region, suggesting a potential upside recovery.
Should the pair stretch north, the 50-day simple moving average (SMA) could provide immediate resistance before the prices touches the ascending trend line around 42,000. A significant step higher, breaking the diagonal line could bring the bullish sentiment back into play, sending the price probably towards 45,920. If the buying interest extends, attention could then turn to the 200-day SMA at 49,351.
On the flip side, immediate support could come from the 36,232 level which may halt bearish movements. Steeper decreases could also touch the 32,960 support level, taken from the latest low.
In the medium-term picture, BTCUSD has been trading bearish in the past three months after the drop below the 69,085 high. Still, if the price manages to cross above the 200-day SMA at 49,351, the bearish outlook could switch into a bullish one.