Sample Category Title
Silver Wave Analysis
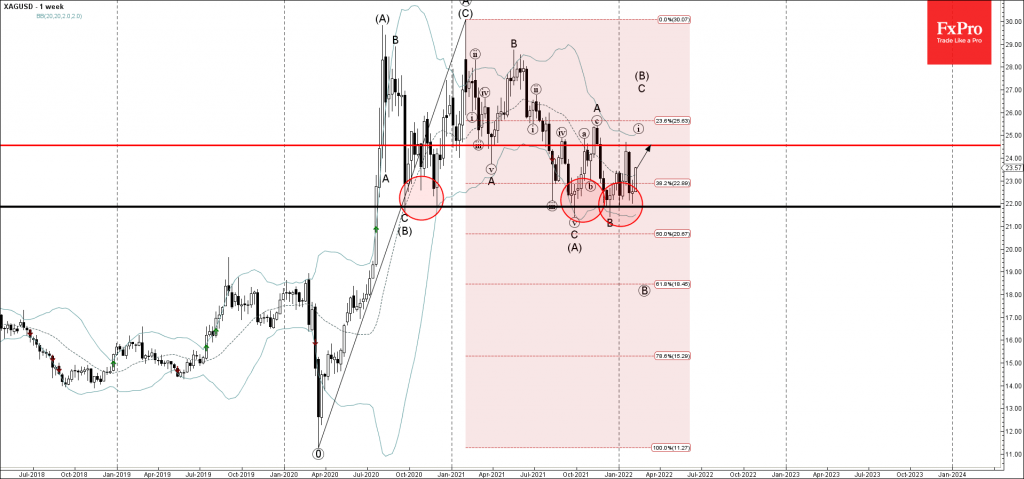
- Silver reversed from support level 22.00
- Likely to rise to resistance level 24.55
Silver recently reversed up from the key support level 22.00 (which has been reversing the price from the end of 2020 as can be seen from the weekly Silver chart below).
The upward reversal from the support level 22.00 continues the active minor impulse wave C of wave (B) from last year.
Given the clear uptrend – Silver can be expected to rise further toward the next resistance level 24.55 (previous reversal point from the start of this year).
Days are Numbered for Gold
Gold is one of the most popular trading assets in the world, with a several age history and an unbelievably large market capitalization of $11 trillion. There are 100 ounces of gold in 1 lot, and it is a $1.8 million order size. Therefore, if you want to control your trades in the FBS trader application or Meta Trader 4/5, you can trade as little as 0.01 lot of gold (which is only 1 ounce of the metal). This article will guide you through the possible outcomes for the current gold movement after the US reveals their economic data and clarifies the amount of future rates hikes. So get yourself comfortable, and let’s start!
What moves the gold?
Gold had dozens of fruitful movements in both 2020 and 2021. When the world thought the economy was about to recover, our shiny friend lost 19% of its capitalization in several months. But then, another coronavirus strain emerged. So it doesn’t matter whether you are a bull or a bear trader; gold movements in 2021 gave opportunities to everyone, with 13% surges and 11% plunges.
Next week we will have a couple of events that will affect the gold price. The first is the US core retail sales on February 16, 15:30 GMT+2. It shows a change in the total sales value at the retail level, excluding automobiles. High numbers mean economic strength. Thus, gold might slide lower after the release. The second is FOMC meeting minutes, where we will get more information on rate hikes and monetary tightening. The record will be available on February 16, 21:00 GMT+2. Hawkish tones from the Fed members will press on the gold. You can get the data first in FBS economic calendar; it is fast, convenient, and easy to use.
Forecast for gold
Expectations of rate hikes, inflation concerns, and coronavirus pressure the gold price. The market is about to decide the fate of the metal for 2022. As far as we know, this year, five rate hikes are expected to fight inflation both in the US and in other countries. Due to relatively slow economic recovery, money flows not to the gold but to even more defensive assets, like the Japanese Yen and Swiss Franc. We expect that if the inflation stops at current levels (7-8%), XAU/USD will struggle to rise and may slide down to 2020 levels ($1700-1600).
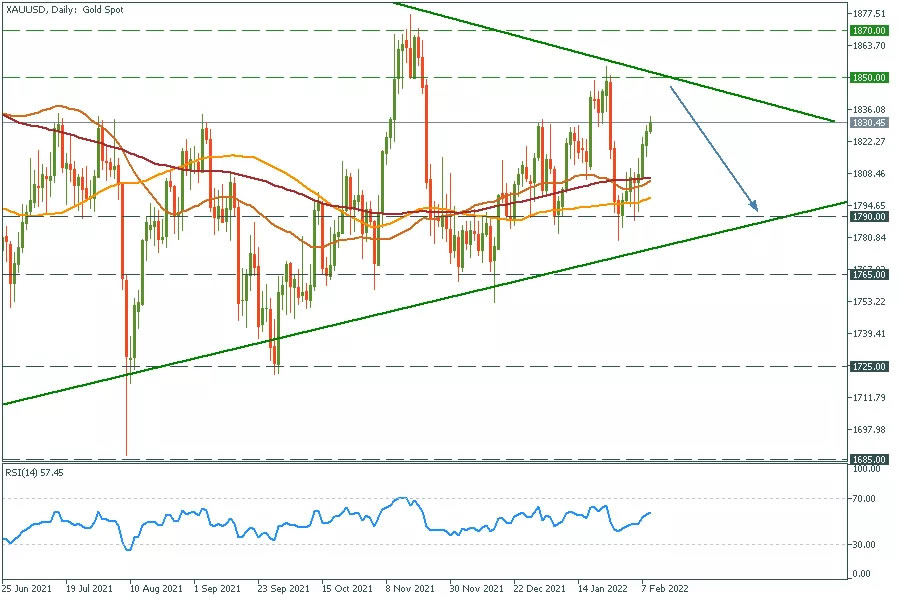
As for February, gold may reach the upper border of the descending trendline at $1855, and it is the perfect opportunity to wait for a reversal or a breakout of this level. (Enter the trade only after the confirmation from the chart).
XAU/USD daily chart
- Resistance: 1850; 1870
- Support: 1790; 1765; 1725
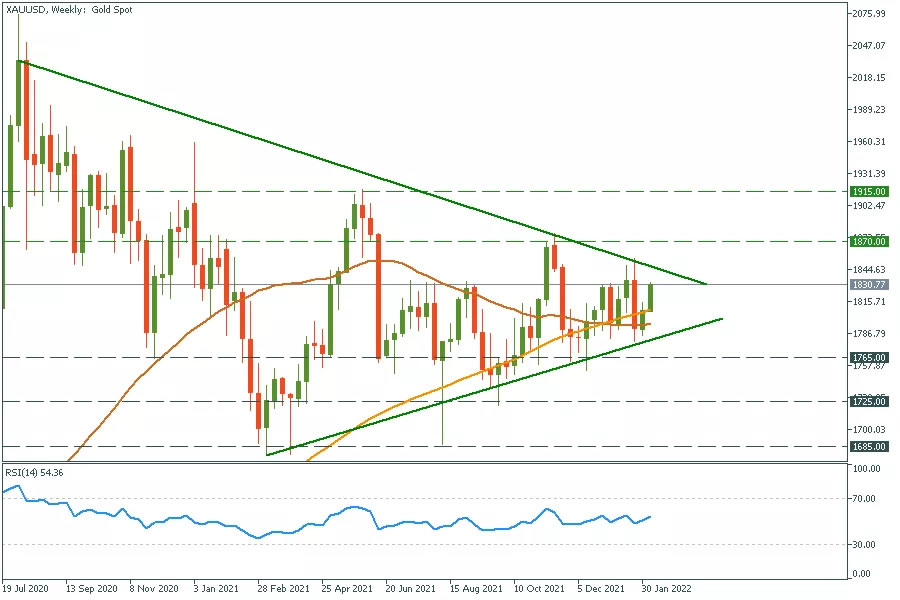
On the bigger timeframe, gold is moving sideways in the symmetrical triangle. Triangles are tricky price formations as they often work poorly. The best way to predict the future price movement is to wait for a breakout and then trade in the breakout direction. Apart from technical indicators, we think gold will be weak for the next several months due to rates hikes and economic recovery. We expect the metal to reach $1725 and $1685 levels in the 2-3 months. To learn more about technical analysis and get trade ideas daily, visit the FBS website; we post our daily thoughts on the market and are sure you’ll find them helpful.
XAU/USD weekly chart
- Resistance: 1870; 1915
- Support: 1765; 1725; 1685
You can trade XAU/USD contract for difference with FBS. It doesn’t matter whether you are buying or selling; you have the same sweet conditions for all your trading desires. And the best time to open a trade is now. Good luck!
US Inflation to Force the Fed into Action
The US inflation report noted higher-than-expected price rises, triggering a boost to the dollar and a pullback in US major index futures.
The price index for January rose 0.6% to an annual rate of 7.5%. The report dashed hopes that the monthly price increase was slowing, as analysts expected a slowdown to 0.4% after December’s 0.5% jump.
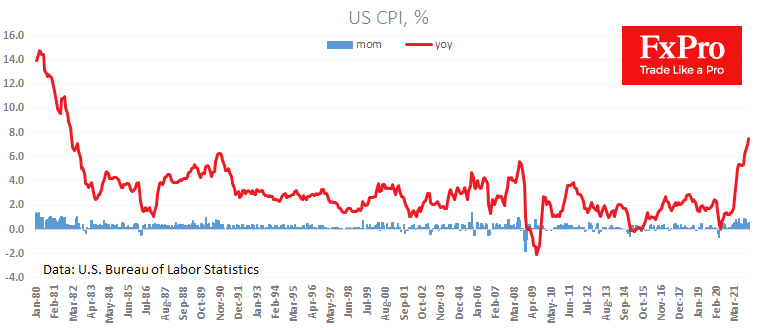
The core index added another 0.6% last month, accelerating to 6.0% y/y, the highest level since August 1982.
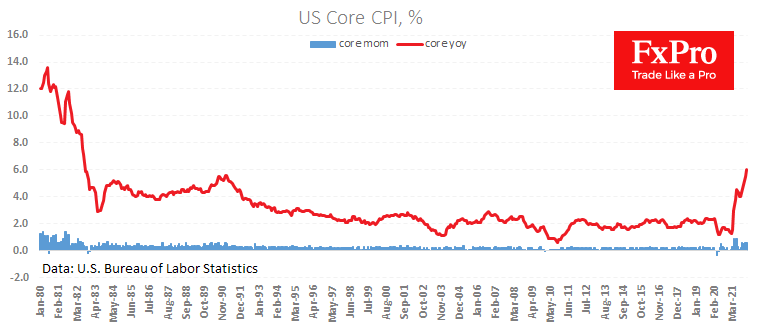
Thus far, there are few signs of a slowdown in inflation which requires the Fed to take active steps to tighten monetary policy. As might be expected, the stronger-than-expected rise in prices caused a sell-off in US equity futures, with the Nasdaq100 losing 2% and the S&P500 1.3%.
The dollar index immediately gained 0.4%. For the dollar, the current inflation report could be the starting point for a new upward momentum as it virtually unleashes the Fed for a high-profile first move with a key rate hike of 50 points in five weeks.
Gold – Running Out of Steam?
Rally continues after US inflation data
Gold is continuing to rally on Thursday and is on course to register an eighth day of gains in the last nine.
That’s not bad considering markets are continuing to price in more and more rate hikes from central banks around the world this year.
But perhaps that’s also the problem. This isn’t a gradual tightening process. It’s being driven by inflation that was considered to be transitory but has continued to surprise us every month and January was no exception, with the headline rate rising to 7.5%. That’s not only well above expectations and the highest for many years, it’s almost four times the Fed’s target rate.
So while markets are continuing to price in more hikes – now up to six this year, one at almost every meeting – gold is still feeling the love as inflation-fearing traders seek safety in the traditional hedge.
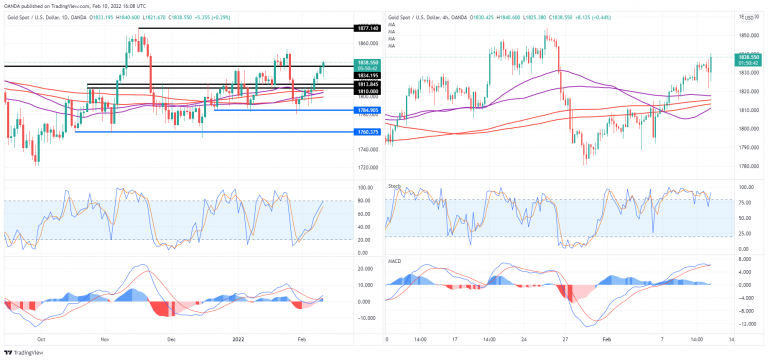
But can the repeated shocks continue to propel gold higher? And how long will they keep coming? Gold could feasibly remain well supported in the short-term without making staggering gains until we start to see evidence of inflation peaking, which shouldn’t take long.
The 4-hour chart seems to suggest that, despite gold marching higher every day, momentum has actually been waning. And today’s spike on the back of the inflation data hasn’t changed that.
It appears to have overcome the $1,830 hurdle finally but is there enough there to see it through $1,850? We’ll soon see but if that’s going to happen, we could see some corrective moves first which may allow for momentum to pick up again.
Pound Jumps as US Inflation Jumps
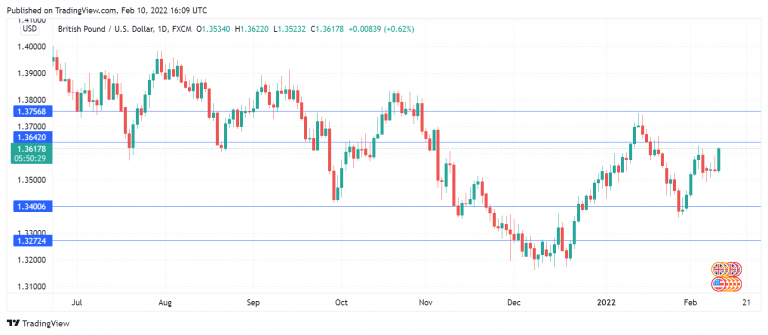
The British pound finally woke up this week and has punched past the 1.36 level. GBP/USD is trading at 1.3615, up 0.78% on the day.
The highly anticipated US inflation reading did not disappoint, coming in a 7.5% y/y for January. This beat the forecast of 7.3% and was up from 7.0% in December. US inflation continues to climb, but the US dollar couldn’t take advantage and was broadly lower against the majors today, with the exception of the yen. Perhaps investors are getting accustomed to red-hot inflation, and the fact that the Fed rate hike in March is a foregone conclusion may have dampened any urge to rush and buy US dollars. The markets are in the dark after March, with no clear guidance from the Fed as to how many hikes we’ll see in 2022.
The Fed will not be pleased with the latest CPI report, as it puts pressure on policymakers to seriously consider a drastic 0.50% hike in order to put a leash on surging inflationary pressures. The January CPI report was not only the highest since February 1982, but also showed broad-based strength, leading to the conclusion that the Fed may have to be aggressive in its tightening campaign, despite some Fed members saying that 3 or 4 hikes should be sufficient to tame inflation.
Across the pond, financial markets shrugged off last week’s BoE quarter-point hike, which raised rates to 0.50%. The meeting was significant in that the vote was a tight 5-4 decision, with four members of the Monetary Policy Committee (MPC) voting to raise rates by 50 basis points. This points to deep divisions at the MPC and will complicate the BoE’s task of providing clear guidance to the markets, which could result in volatility for the pound. BoE Governor Bailey has a credibility problem after the markets badly misread his rate moves late last year, and the close vote demonstrates that a large minority of the MPC are not towing the line on monetary policy.
GBP/USD Technical Analysis
- GBP/USD is putting pressure on resistance at 1.3642. Above, there is resistance at 1.3756
- There is support at 1.3400 and 1.3272
Will the Stock Market Crash? Maybe Not
The threat of rising interest rates has returned to haunt stock markets. With the Fed going to war against inflation, traders are worried the era of easy money is coming to an end. As a result, volatility has gone through the roof and valuation multiples have compressed, decimating the most ‘bubbly’ pockets of the market. The turbulence is likely to continue, but with the economy still in good shape and buybacks going strong, this storm could ultimately be a gift to investors with long time horizons.
Fed giveth, Fed taketh away
Funny as it sounds, the pandemic turned out to be a blessing for equity markets. Governments and central banks joined forces to fight the crisis, and when extravagant fiscal spending is combined with rock bottom interest rates, that is rocket fuel for riskier assets.
An easy way to think about it is from a cross-asset perspective. With central banks slashing rates and buying truckloads of government bonds, the yields on those bonds crumble and investors searching for juicy returns have to look elsewhere. That pushes money managers to take on more risk in the stock market, pushing valuations higher.
Now this process is going into reverse. Spiraling inflation has changed the game, sending central banks scrambling to raise interest rates to combat inflationary pressures. And with most economies healing so quickly, governments have started to roll back their own spending to control debt levels.
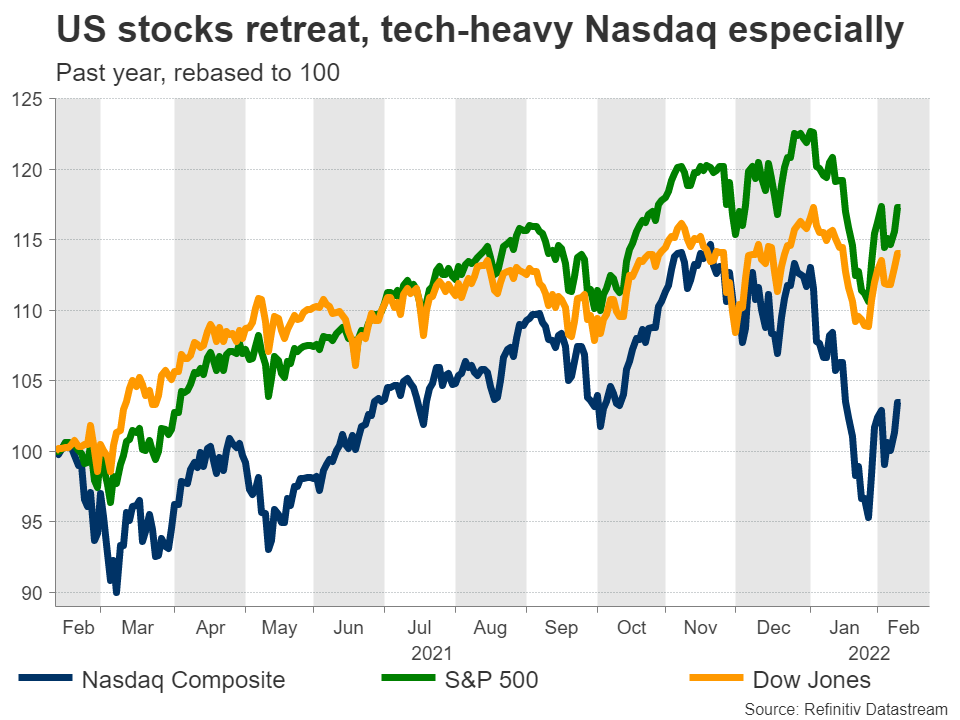
Consequently, markets suffered a sharp selloff. Tech and ‘growth’ stocks have been the biggest casualties, as higher rates generally inflict more damage on shares of companies that are unprofitable or barely profitable. Anything with an expensive valuation has essentially been taken to the cleaners.
The good news
On the bright side, there are several reasons to be optimistic here. First and foremost, the global economy is quite strong. What we’ve seen lately wasn’t a reaction to shifting economic fundamentals but rather traders pricing in tighter monetary policy, precisely because most economies are strong enough to handle that.
In fact, investors may have gone too far already. Money markets are currently pricing in six rate increases by the Fed this year, which is probably on the optimistic side of what is possible. There's a real possibility the yearly US inflation rate will peak soon as government spending fades, supply chains finally begin to normalize, and tougher year-over-year comparisons kick in from March onwards.
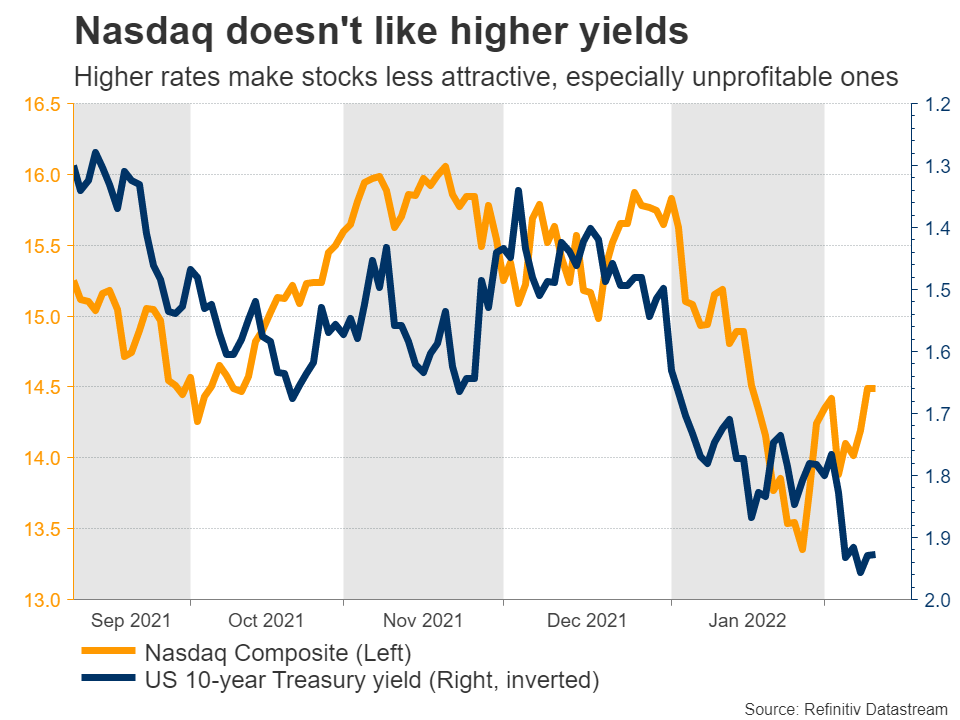
When investors see the first signs of ‘peak inflation’, these ultra-aggressive Fed bets could be dialed back, pushing yields back down and breathing new life into equity markets. Politics point to a similar conclusion. The Democrats will probably lose Congress in November’s midterm elections, which means there won’t be any tax increases over the next couple of years.
Another encouraging sign is that many of the ‘excesses’ in the market have been washed out. Companies trading at crazy valuation multiples have been demolished and a sense of sobriety has returned. Just look at pandemic winners like Zoom that have seen their shares retreat 70% from record highs. It’s a similar story for meme stocks, blank-cheque companies (SPACs), and even some quality businesses like Netflix and Facebook.
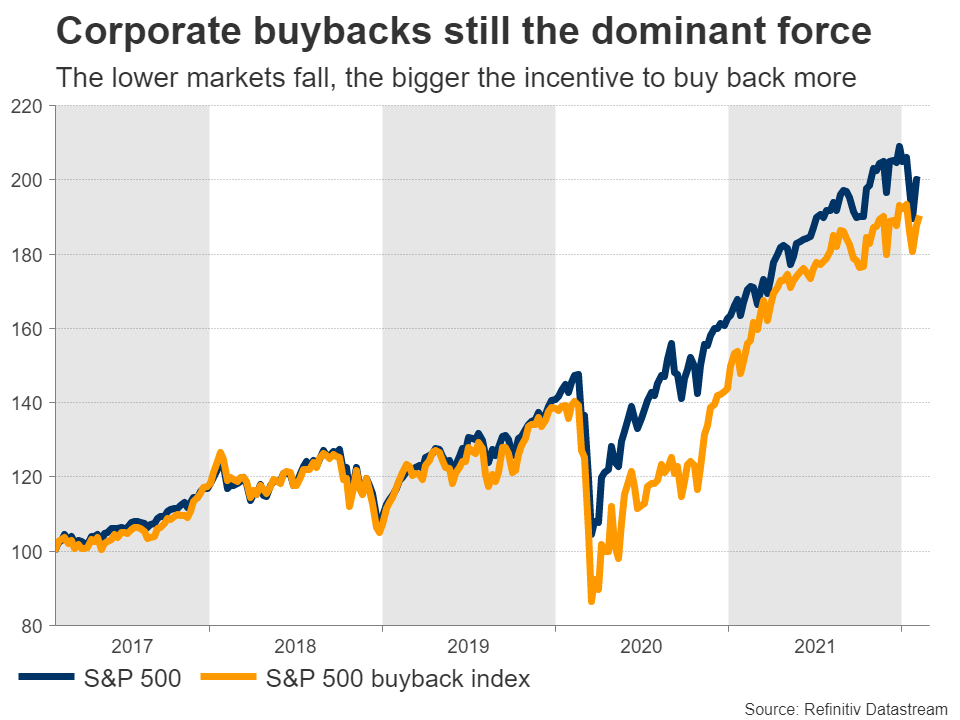
Finally, let’s not forget about buybacks. Companies bought back their own stock at a record pace in 2021, essentially reducing the total number of shares available and improving earnings per share, a process that ultimately pushes prices higher. With most stocks now trading at a discount relative to last year, corporate treasuries could accelerate this process, providing a powerful and consistent source of demand.
The bad news
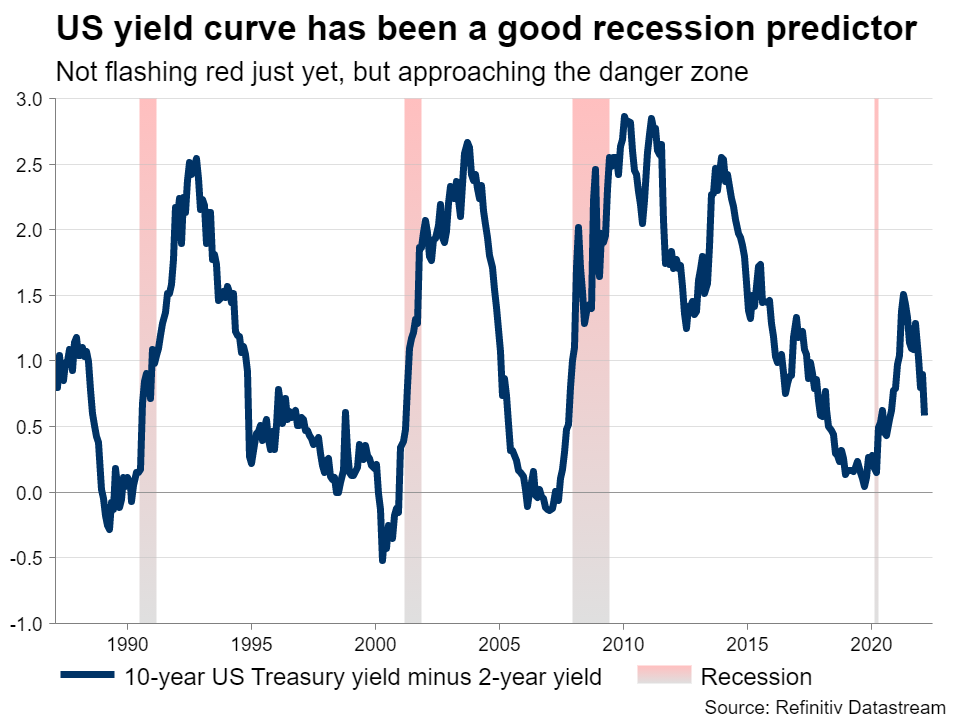
Of course to provide a holistic view, we have to outline the bear case as well. The biggest downside risk is that inflation remains persistently high even after supply chains normalize, forcing central banks to raise rates with even greater force. That would propel yields higher and put the risk of a policy-induced recession on the map.
The other primary risk is that economic growth just grinds to a halt now that the fiscal juice is running out, again putting investors on recession watch, although in that case the Fed would also back off from aggressive rate hikes, negating some of the negative impact.
Earnings growth could be another troublespot. While earnings are still growing at a healthy clip, the percentage of companies beating analyst estimates has declined in this reporting season and those that beat do so with a smaller margin. This could be a problem when combined with valuations that are still historically ‘expensive’.
Geopolitics are back on the radar too with the tensions around Ukraine and Taiwan, although markets generally don’t care much about that as long as it’s just political muscle flexing.
The big picture
All told, markets are going through a painful readjustment period as central banks and governments wind down their stimulus. This implies that volatility episodes and sharp drawdowns could become a more frequent phenomenon as Wall Street learns to live without endless liquidity.
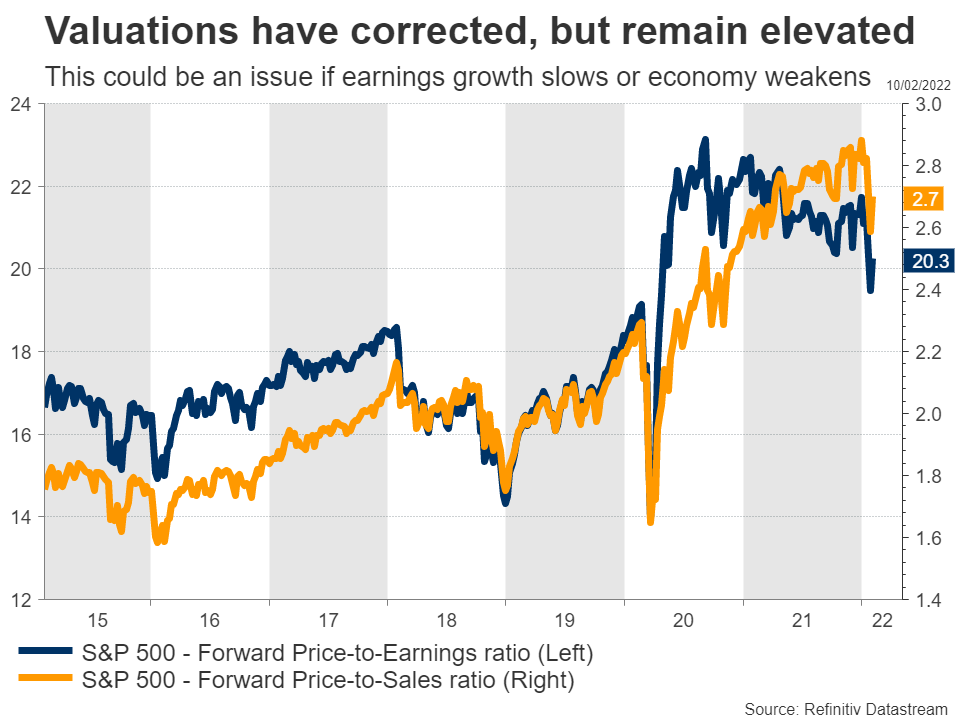
But the economy is not falling off a cliff, the amount of rate increases that have been baked into asset prices might already be excessive, and corporate buybacks will remain a dominant force that intensifies the lower the market falls, keeping a soft floor under prices.
The bottom line? Investors willing to stomach the volatility can take advantage of the violent pullbacks to scale into positions for the long term, preferably in high quality companies trading at a discount.
Markets will kick and scream before taking their medicine but as long as a recession is not imminent, they can probably handle slightly higher rates without breaking down. After all, there is still no real alternative.
Sunset Market Commentary
Markets
The European Commission’s Winter 2022 economic forecasts were today’s appetizer in the run-up to January US inflation numbers. The EC updated the 2021 growth figure to 5.3%, triggering mechanical revisions to the 2022 (4% from 4.3%) and a lesser extent 2023 (2.7% from 2.4%) predictions compared to the Autumn 2021 release. The balance of risks to the growth outlook is broadly even. The EC shifted its inflation path significantly higher: 2.6%-3.5%-1.7% for the 2021-2023 period, coming from 2.4%-2.2%-1.4%. The inflation projections are subject to upside risks if cost pressures are passed on from producer to consumer prices to a larger extent, increasing the likelihood of strong second-round effects. Risks to the growth and inflation outlook are aggravated by geopolitical tensions in Eastern Europe. Inflation forecasts probably remain on the lower side of the spectrum. The ECB in December projected 3.2% for 2022 and 1.8% for 2023 and last week labelled these as outdated. An internal debate is also ongoing about the accuracy of the inflation model given last year’s continuous underestimation of both inflation peak and period over which inflation would exceed the ECB’s 2% inflation target.
US inflation again beat forecasts, rising by 0.6% M/M for both headline and core inflation to 7.5% Y/Y and 6% Y/Y respectively. The price rise was broad-based with heavy-weight categories like housing (5.7% Y/Y), food & beverages (6.7% Y/Y) and transport (20.8% Y/Y) showing significant increases. The strong underlying momentum suggests that this isn’t the headline inflation peak yet (because of higher petrol prices in February). In spite of all downplaying efforts by Federal Reserve officials off late, the multi-decade high inflation print strengthens market conviction that the Fed’s rate lift-off will be a 50 bps one. Selling resumes in US Treasuries, bear flattening the curve. US yields add 10.7 bps (2-yr) to 3.1 bps (30-yr). The US 10-yr yield was a whisker away from piercing above the psychological 2% mark for the first time since July 2019. German Bunds followed US Treasuries lower though the curve steepened, adding up to 4 bps in the 5-yr to 10-yr bucket. The US dollar profits from the beneficial relative yield dynamics with EUR/USD sliding back below the 1.14-handle for the first time since the ECB pivot. USD-gains could have been bigger though. USD/JPY tests the cycle and multi-year high at 116.35. The trade-weighted dollar tries to regain the 96-handle. US stocks sell-off in lockstep with bonds (-1.5%).
News Headlines
The Swedish Riksbank (RB) left the policy rate unchanged at 0%. It didn’t signal any imminent recalibration of its accommodative policy stance. The RB wants to keep the holdings of its asset portfolio to remain approximately unchanged in 2022 and before decreasing them gradually. Three governors preferred a faster reduction of asset purchases. The Riksbank expects a first rate increase only in H2 2024. Swedish CPIF inflation printed at 4.1% in December but this is entirely explained by electricity and fuel prices. Inflation should drop to just over 1% end 2022 and return to 2% mid next year. Inflation excluding energy prices is holding close to 2%. The risk of too low inflation has decreased but it still remains. The Krona lost modest ground to currently trade in the EUR/SEK 10.47 area.
The ECB announced that it won’t extend the capital and leverage relief for banks which was put in place in 2020 and 2021 in order to help them to continue lending to households and business. In this respect the ECB confirmed ‘the initially envisaged timeline for a return to a normal supervision of banks capital adequacy and leverage’. In concreto, banks are again expected to operate above the Pilar 2 guidance from January 2023. Banks also will have to reinclude central bank exposure in the leverage ratio from April 01 2022. The ECB assessed that banks, even considering the uncertainty regarding the impact of the pandemic, have ample headroom above their capital requirements and above the leverage ratio requirement. End of September 2021 the aggregate Common Equity Tier 1 ratio of banks under direct ECB supervision stood at 15.47%. Their aggregate leverage ratio stood at 5.88%.
US: Inflation Hotter than Expected in January
Consumer prices were up 0.6% month-on-month (m/m) in January, matching December's pace, and slightly higher than markets were expecting. The year-on-year (y/y) pace of inflation ticked higher to 7.5%.
Food and energy prices both rose 0.9% m/m, and are up 7% and 27% y/y respectively. Within energy a 4.2% m/m increase in electricity costs was the biggest contributor. Food prices continued to rise at a solid clip, up 0.5% m/m, and are up 6.3% y/y.
Core inflation (ex. food and energy) was also hotter than expected, jumping up 0.6% m/m. As a result, the year-on-year rate of core inflation picked up to 6.0%, from 5.5% in December, and the fastest pace in nearly 40 years.
Shelter costs were still a key contributor to monthly inflation, but increased less than they did in December (+0.3% m/m versus +0.4% m/m). Used vehicle prices also continue to rise (+1.5% m/m), although the price for new vehicles was unchanged. Price pressures for medical care accelerated, rising 0.7% m/m. The increase in core inflation over the past year has been fairly broad-based, with virtually all components seeing price increases over the past 12 months.
Overall within core inflation, goods price increases continue to bring the heat, rising 1.0% m/m. Core services were also up a solid 0.4% m/m. Perhaps surprisingly given the Omicron variant, transportation services costs accelerated in January (+1.0% m/m).
Key Implications
Inflation surprised to the upside once again in January. As discussed in our recent report, higher rates will be required to bring demand and supply back into balance and lower the temperature on inflation. The Fed is set to start raising rates in a few short weeks. With inflation continuing to surprise to the upside, the pace of rate hikes is likely to be faster than expected a few months ago.
We expect the year-on-year pace of inflation to slow from its current high level, as supply chains ease and the composition of demand shifts away from goods. Still, it is likely to take some time and base year effects will remain unfavorable over the next few months. In the meantime, elevated price growth is crimping purchasing power and may already be contributing to greater consumer caution.
EUR/USD Mid-Day Outlook
Daily Pivots: (S1) 1.1402; (P) 1.1425; (R1) 1.1447; More...
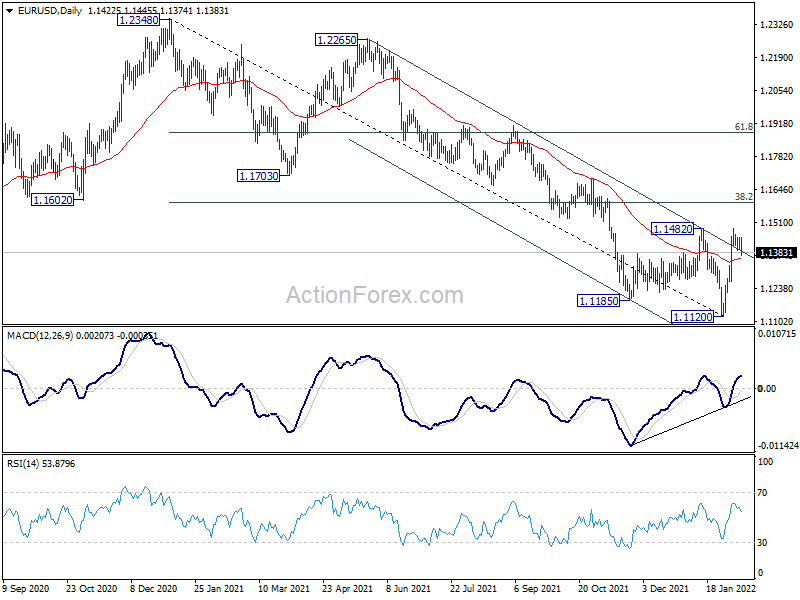
EUR/USD drops notably but stays well above 1.1265 support. Intraday bias remains neutral first and outlook is unchanged. A medium term bottom could be in place at 1.1120, on bullish convergence condition in daily MACD. Break of 1.1482 resistance will target 38.2% retracement of 1.2348 to 1.1120 at 1.1589 next. Sustained break there will argue that whole fall from 1.2348 has completed too and target 61.8% retracement at 1.1879. On the down, however, break of 1.1265 support will dampen this bullish view and bring retest of 1.1120 low instead.
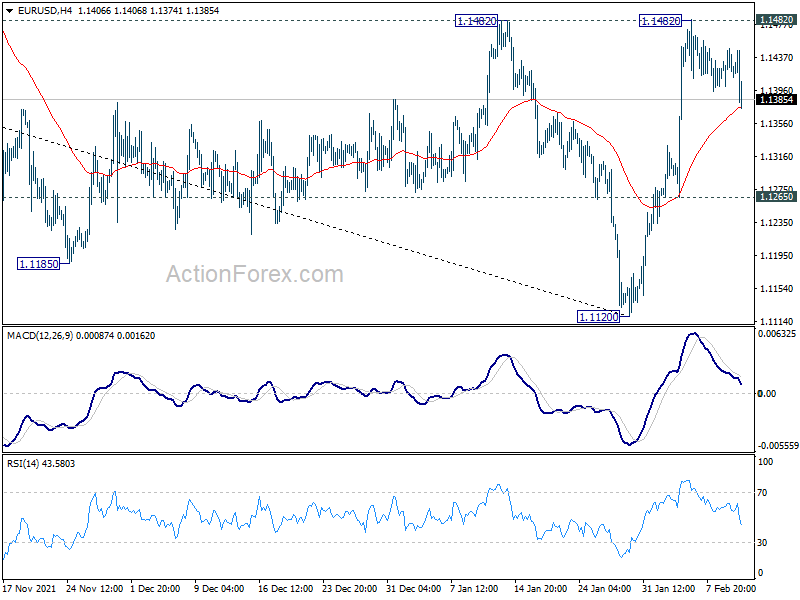
In the bigger picture, the decline from 1.2348 (2021 high) is seen as a leg inside the range pattern from 1.2555 (2018 high). Sustained trading above 55 week EMA (now at 1.1613) will argue that it has completed and stronger rise would be seen back towards top of the range between 1.2348 and 1.2555. However, firm break of 1.0635 (2020 low) will raise the chance of long term down trend resumption and target a retest on 1.0339 (2017 low) next.