Sample Category Title
US Dollar Index Battles with 50-SMA as Positive Momentum Intensifies
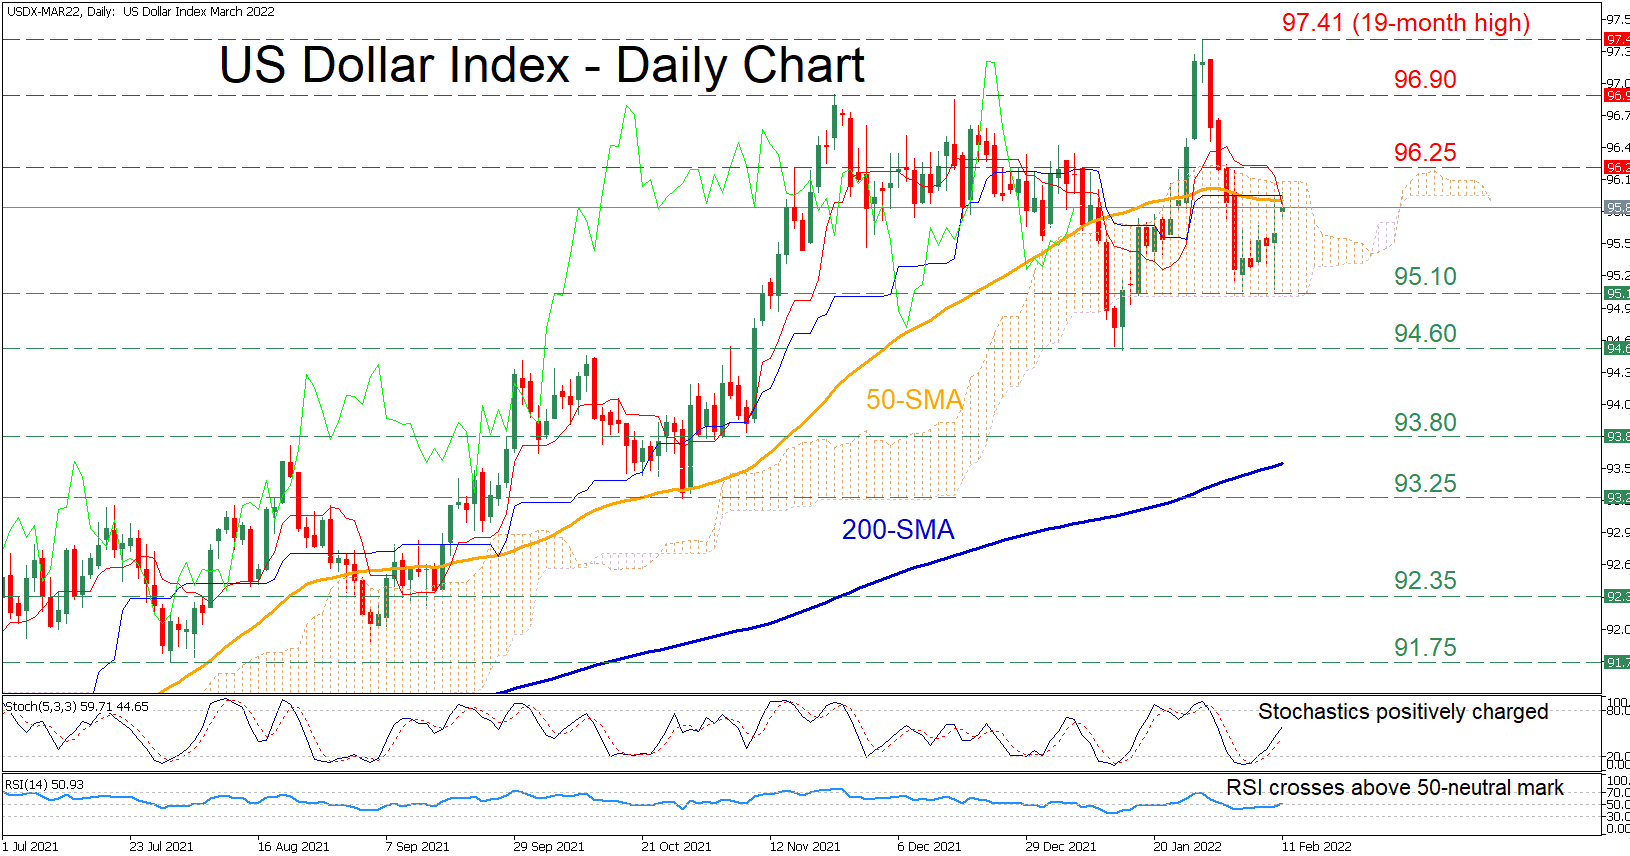
The US dollar index has experienced a minor pullback in the short-term after peaking at the 19-month high of 97.41. However, the price has regained traction since the 95.10 floor rejected a price decline twice, while the 50-day simple moving average (SMA) seems to be capping its upside move.
The momentum indicators reflect that bullish forces have gained the upper hand. The stochastic oscillator is trending upwards, and the RSI is pointing up after crossing above its 50-neutral mark.
Should the buying interest intensify further and the price crosses above its 50-SMA, initial resistance might be encountered at the 96.25 region. Conquering this hurdle, the bulls could then target the November high of 96.90. Crossing above this obstacle, the price ascent may cease at the 19-month high of 97.41 before the price marches higher to create fresh highs.
On the flipside, if positive momentum fades and the price reverses downwards the recent low of 95.10 could act as immediate support. Further downside pressure could send the price to test 94.60 or lower to challenge the 93.80 region. Dipping beneath these levels, the spotlight might turn to the 93.25 barrier.
Overall, the resumption of the US dollar index’s near-term rebound remains the most likely scenario. However, a break below the 95.10 barricade could trigger further selling interest, extending the index’s short-term decline.
GBPJPY trades below 3½-month high but still above uptrend line
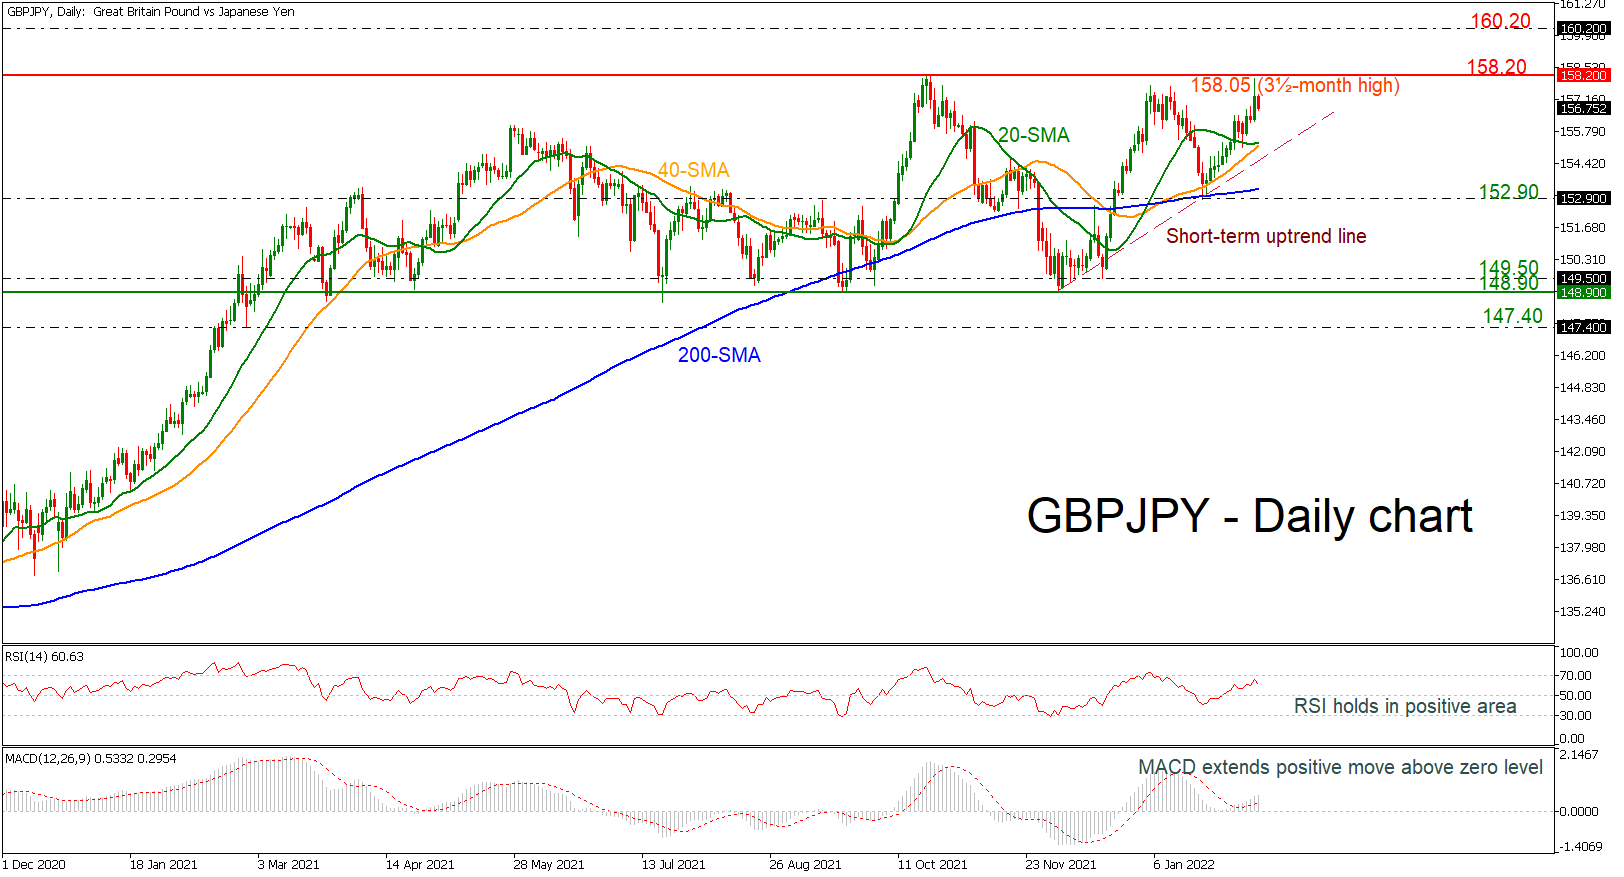
GBPJPY has been trading within an ascending movement over the last two months, with a higher high around the upper band of the long-term trading range of 148.90-158.20. Yesterday, the pair reached a fresh three-and-a-half-month high near 158.05 but today; it is returning some gains.
Regarding the technical indicators, the RSI is pointing marginally south around the overbought region; however, the MACD oscillator is stretching its positive movement above its trigger and zero lines. Moreover, the 20- and 40-day simple moving averages (SMAs) were ready for bearish cross, though, they currently are ticking higher again.
If the bulls continue to buy the pair and surpass the significant 158.20 resistance, they could change the neutral outlook to bullish, meeting the 160.20 barrier, achieved in June 2016. Running higher, the next stop could come from the 162.80 level, taken from the high in April 2016.
In the negative scenario, a drop lower, immediate support could come from the short-term SMAs at 155.20, which stand slightly above the uptrend line near 154.90 ahead of the 200-day SMA to 153.40. Even lower, the short-term bullish bias would turn to bearish, hitting 152.90 and then the 148.90-149.50 support zone.
In brief, in the long-term window, the sideways move would change if there is a direction above 158.20 or below 148.90. In the near-term, the view is positive and only a drop below the 200-day SMA may switch this picture to neutral.
Daily Technical Analysis
EUR/USD
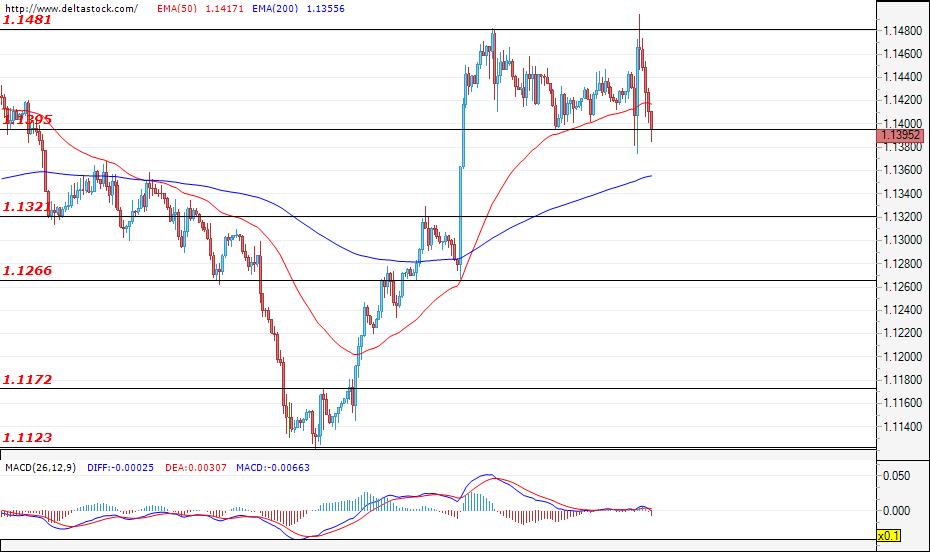
During yesterday’s trading session, the bears took complete control over the market, heading the pair towards a test of the support at 1.1395. In case the bears manage to hold their positions and successfully violate this zone, then we may expect a decline of the European currency towards the support at 1.1320. However, only a confirmed breach of the 1.1395 support area would strengthen the negative expectations for a continuation of the downward movement. In case this level resists the pressure of the sellers, then the trading action would most probably remain in the range of 1.1400 – 1.1480.
USD/JPY
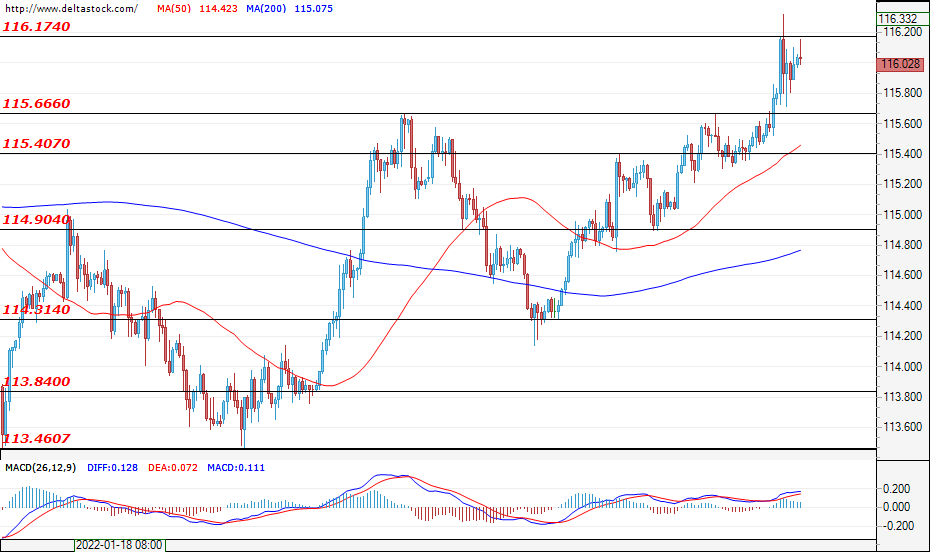
The pair tested the resistance at 116.17, but the bulls couldn’t gain enough momentum to breach this level. The expectations are for another test of this level, and if it is successfully breached, then we may witness an impulsive upward movement towards the next resistance at 116.50. A short consolidation in the range of 115.60 – 116.17 is also a possible scenario for today’s trading session.
GBP/USD
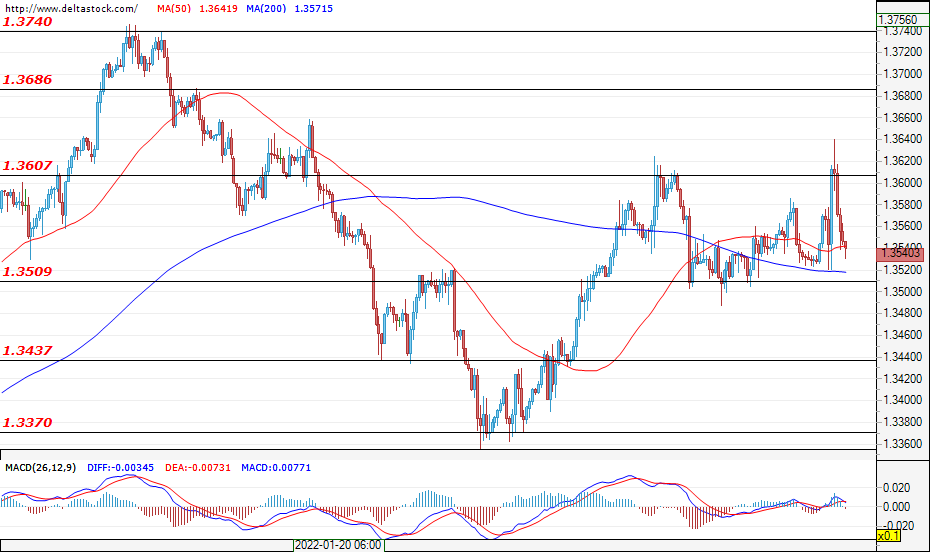
The resistance level at 1.3600 was not violated by the bulls, and during yesterday’s trading session, the bears took complete control over the market, heading the pair towards a test of the support at 1.3500. If this level is successfully breached, then the next target would be the support at 1.3437. On the other hand, if this support resists the pressure of the bears, then the trading action would most probably remain in the range of 1.3500 – 1.3600.
EUGERMANY40
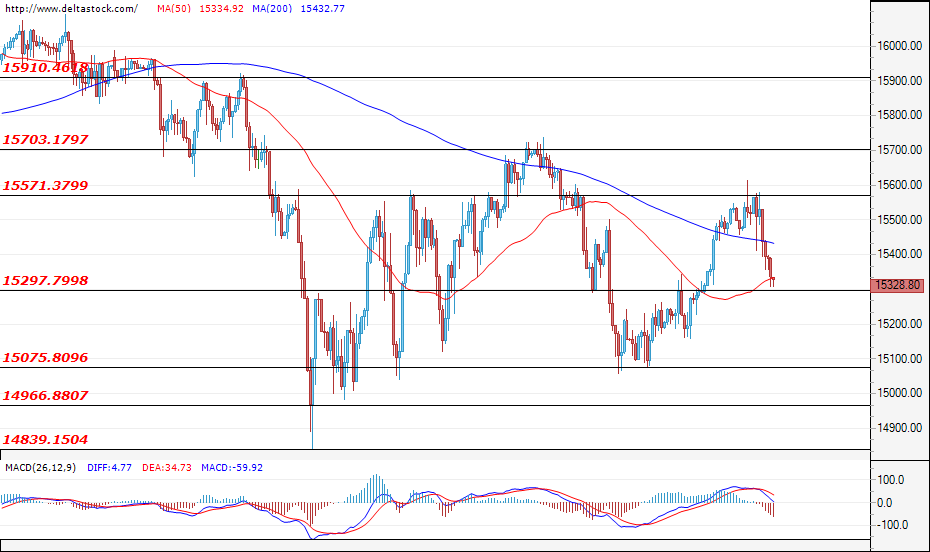
In the early hours of today’s trading session, the sell-off continues and the index is headed towards a test of the support at 15300. A confirmed breach of this zone would strengthen the negative expectations for a downward movement towards the support at 15075. If the bulls re-enter the market and hold the price above 15300, then a short correction towards 15570 may happen.
US30
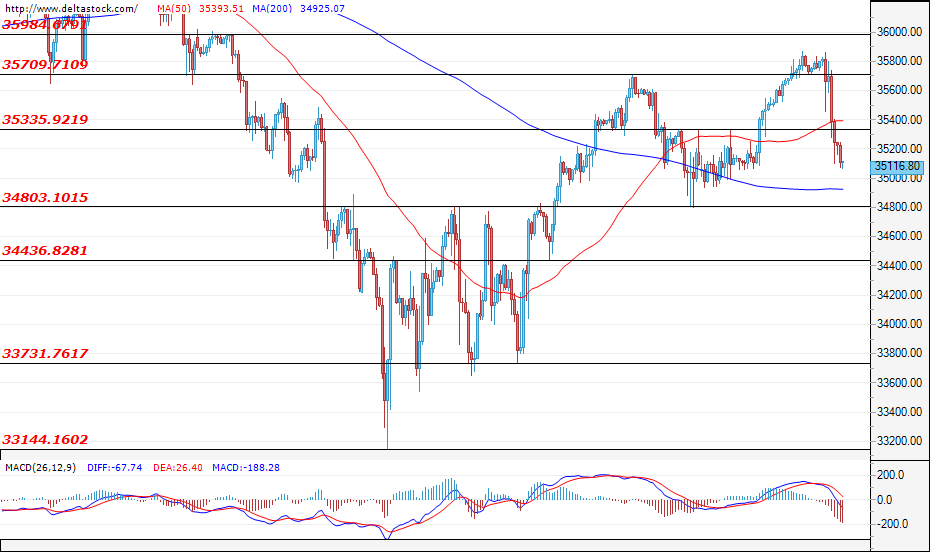
The bears have easily violated the support at 35335 and the downward movement still continues. The bears would most probably try to attack the next support at 34800. However, we may see a short-term upward correction, after which the downtrend may continue. A breach of the support zone at 34800 would significantly boost the sell-off towards 34436.
US CPI Release Triggered Nothing Less than a Real Earthquake
Markets
Over the previous week, ECB Chair Lagarde’s U-turn on the inflation assessment and strong US payrolls caused hefty turbulence on interest rate markets on both sides of the Atlantic. Yesterday’s US CPI release triggered nothing less than a real earthquake. US headline and core inflation respectively jumped to 7.5% and 6.0% Y/Y, the highest readings since 1982. Price rises were broad-based (services 4.6% Y/Y, housing 5.7% Y/Y, transportation 20.8% Y/Y) illustrating that the erosion of consumers spending power is going far beyond an energy driven rise (27 % Y/Y). The M/M dynamics (0.6%) also provides little evidence that a major improvement is around the corner. The data evidently was a major driver for the sharp rise in yields. However, the debate on the Fed reaction function is at least as interesting. Comments from Fed governors Barkin and Daly that a 50 bps hike is no done deal yet, are behind the (market) curve. St Louis Fed Chair Bullard set the debate on a different, more market oriented/ forward looking path. He agreed with market pricing of a 1% combined rate hikes by July 1, stating with 50 bps in March. He is even open to an inter-meeting increase. His comments were the straw that broke the camel's/bond markets back. The 2-y US yields jumped 21.4 bps to close at 1.58%. The 10-y (+8.8 bps) settled well above the psychological level of 2.0% (2.03%). Markets currency almost fully price a 50 bps March increase and 1.75% of increases by the end of the year. The German yield curve rose between 1.8 bps (2-y) and 7.2 bps (10-y) but still has to incorporate Bullard’s comments. The dollar gained sharply immediately after the release but more than returned the gains as US equities showed resilience. EUR/USD even revisited the 1.1485/95 resistance. However, Bullard’s comment gave the USD a lifeline. EUR/USD closed at 1.1428. DXY also closed little changed at 95.55. US equities initially limited the damage, but closed the session with losses between 1.47% (Dow) and 2.1% (Nasdaq).
This morning, Asian markets are losing between 0.5% and 1.75% in the wake of yesterday’s sharp rise in US yields. (Japanese markets are closed). Today’s eco data (U Michigan consumer confidence & Q4 UK GDP) probably will only be of intraday significance. After yesterday’s CPI release and comments from Fed Bullard, markets will unlikely substantially backtrack on a March 50 bps hike. Short-term, the question is whether there will be additional backing for a pre-March intermediate hike. Fed comments fighting this idea might even put further pressure at longer maturities. The 2.0% level for the 10-y soon might become a support. Yesterday’s sharp repositioning again might provide the dollar some kind of short-term ‘policy divergence premium’. After a new rejected test of the high 1.14 area, further return action lower in the 1.13 big figure might be on the cards, but don’t expect a return to the 1.1121 correction low.
News Headlines
Appearing before the House of Representatives, RBA governor Lowe reiterated that a rate hike in 2022 was plausible but that he first wants to see a couple of (quarterly) CPI’s before deciding to. Wage developments will be crucial. Lowe said wage increases currently are no more than “two point something” percent, adding that they are now seeing a steady flow of foreign workers entering Australia. Money markets pulled forward the timing of a first rate hike regardless. They now expect the rate lift-off in June with a total of five hikes discounted. Spill-over effects from the US are at play as well. Australia’s yield curve flattens with yields 14 bps higher at the short end. AUD/USD loses out amid risk-off and a strong USD. The pair falls from 0.716 to 0.711.
The Mexican central bank (Banxico) raised its benchmark interest rate by 50 bps to 6%. The 4-1 decision came as no surprise. Ahead of the meeting, January (core) inflation came in at 7.1% (6.2%) vs. the central bank’s 3% target. The higher-than-expected figures prompted the central bank to lift its forecasts for this year and the next. Risks remain to the upside and Banxico is wary of the rising inflation expectations as a result of the greater and the longer than anticipated inflationary pressures. More (50 bps) rate hikes are likely. USD/MXN rose to 20.57 on dollar-strength.
GBP/JPY Daily Outlook
Daily Pivots: (S1) 156.34; (P) 157.20; (R1) 158.16; More...
Intraday bias in GBP/JPY stays on the upside at this point. Decisive break of 158.19 high will resume larger up trend from 123.94. On the downside, however, break of 155.11 minor support will turn bias back to the downside, to extend the consolidation pattern from 158.19 with another falling leg.
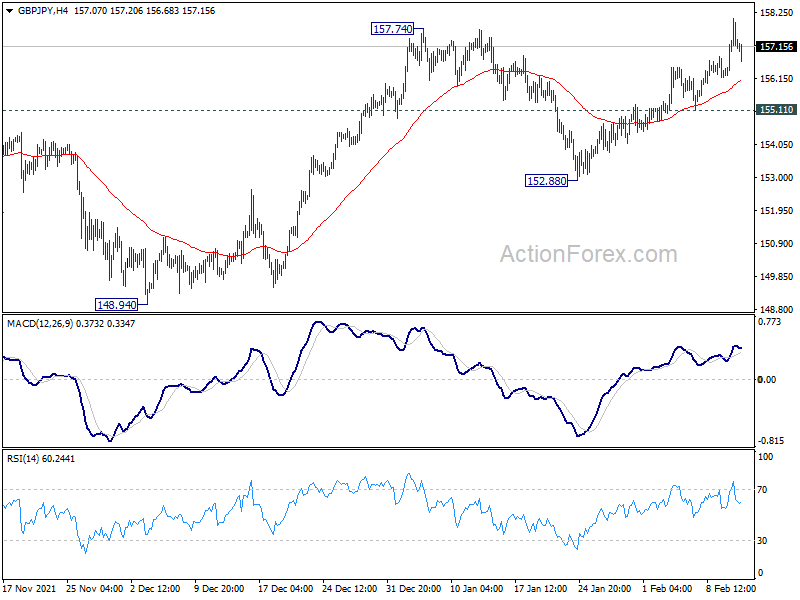
In the bigger picture, price actions from 158.19 are seen as developing into a consolidation pattern to up trend from 123.94 (2020 low). Downside should be contained by 123.94 to 158.19 at 145.10 to bring rebound. Firm break of 158.19 will resume the up trend to long term fibonacci level at 167.93. However, sustained break of 145.10 will raise the chance of trend reversal and target 61.8% retracement at 137.02.
EUR/JPY Daily Outlook
Daily Pivots: (S1) 131.92; (P) 132.53; (R1) 133.20; More....
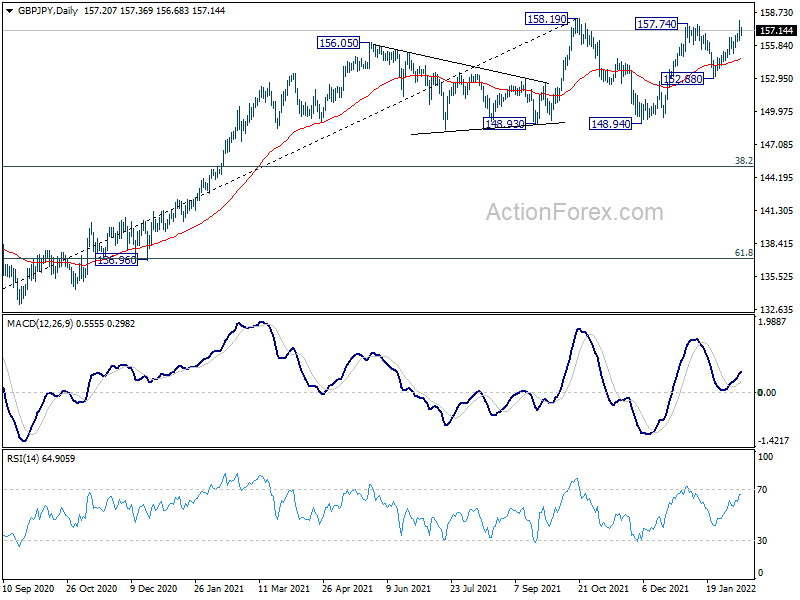
EUR/JPY surged to 133.13 but quickly retreated. Intraday bias is turned neutral first. But outlook is unchanged that corrective pattern from 134.11 should have completed three waves down to 127.36. Firm break of 133.44/134.11 resistance zone will resume larger up trend from 114.42. On the downside, however, break of 131.24 minor support will delay dampen this bullish case and turn bias back to the downside for 128.23 support.
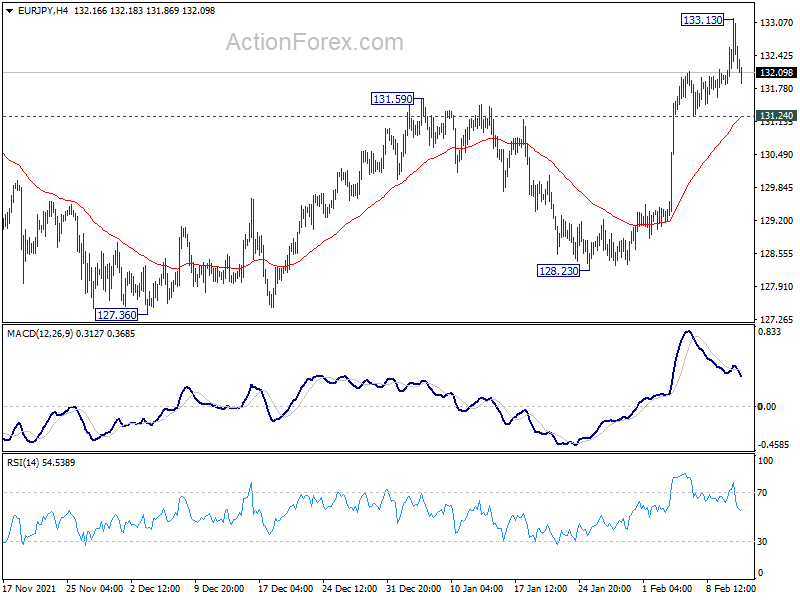
In the bigger picture, price actions from 134.11 are currently seen as a consolidation pattern only. As long as 38.2% retracement of 114.42 (2020 low) to 134.11 at 126.58 holds, up trend from 114.42 is still in favor to continue. Break of 134.11 will target long term resistance at 137.49 (2018 high). However, sustained break of 126.58 will raise the chance of bearish reversal. In this case, deeper decline would be seen to 61.8% retracement at 121.94, and possibly below.
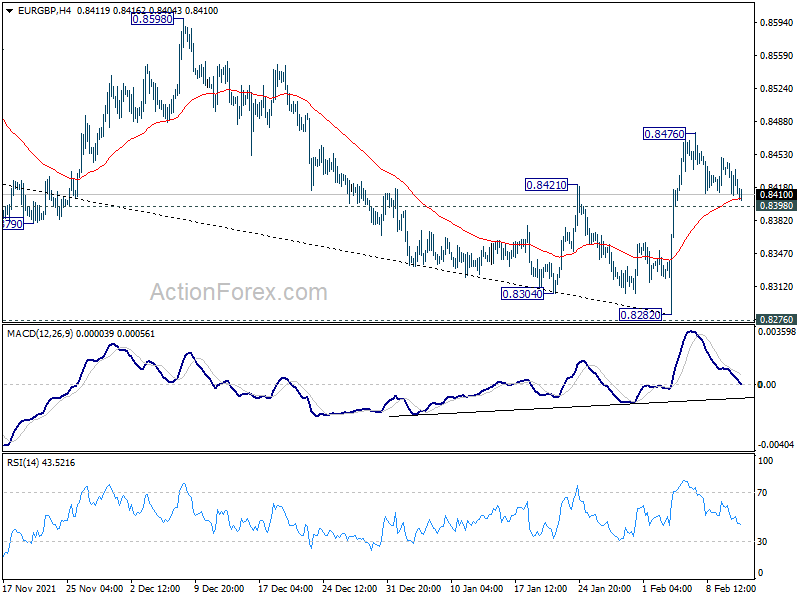
EUR/GBP Daily Outlook
Daily Pivots: (S1) 0.8411; (P) 0.8429; (R1) 0.8446; More...
Intraday bias in EUR/GBP remains neutral first. On the upside, break of 0.8476 will resume the rebound from 0.8282 to 0.8598 resistance. Decisive break there will add to the case of trend reversal and target 38.2% retracement of 0.9499 to 0.8282 at 0.8747 next. However, break of 0.8398 minor support will turn bias back to the downside for retesting 0.8282 low.
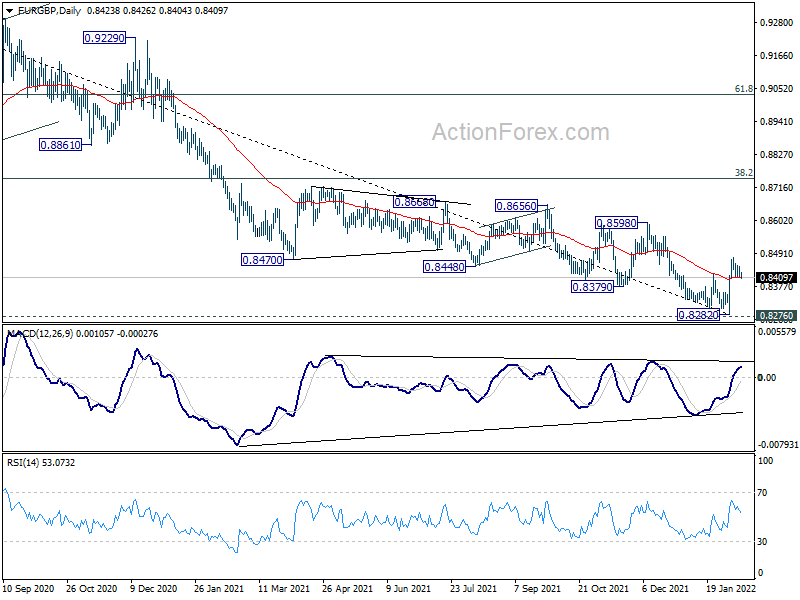
In the bigger picture, price actions from 0.9499 (2020 high) are still see a corrective pattern that should be contained by 0.8276 long term support (2019 low). Bullish convergence condition in daily MACD and break of 55 day EMA raises the chance that it might be completed. Sustained trading above 38.2% retracement of 0.9499 to 0.8282 at 0.8747 will affirm this bullish case and target 61.8% retracement at 0.9034 and above.
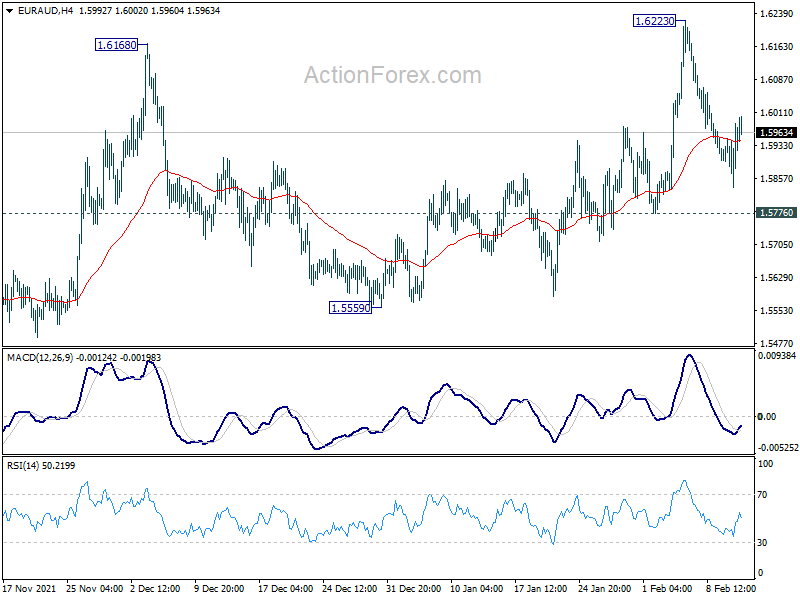
EUR/AUD Daily Outlook
Daily Pivots: (S1) 1.5860; (P) 1.5924; (R1) 1.6007; More...
Intraday bias in EUR/AUD stays neutral for the moment. Further rally will remain in favor as long as 1.5776 support holds. Above 1.6223 will resume whole rise from 1.5354 to 1.6434 resistance first. However, break of 1.5776 will turn bias back to the downside for 1.5559 support instead.
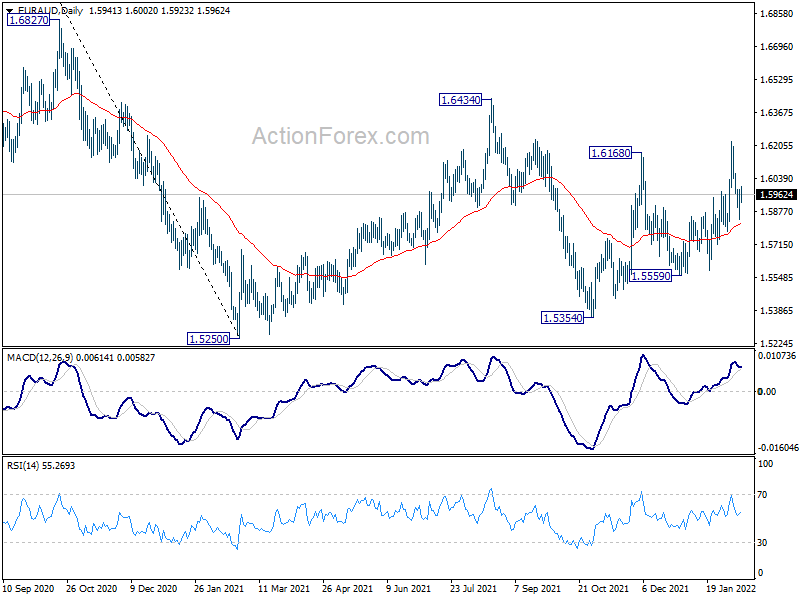
In the bigger picture, rise from 1.5354 is seen as the third leg of the corrective pattern from 1.5250 low. Further rise cannot be ruled out, but even in that case, strong resistance should be seen at 38.2% retracement of 1.9799 to 1.5250 at 1.6988. Larger down trend from 1.9799 is in favor to extend through 1.5250 at a later stage.
EUR/CHF Daily Outlook
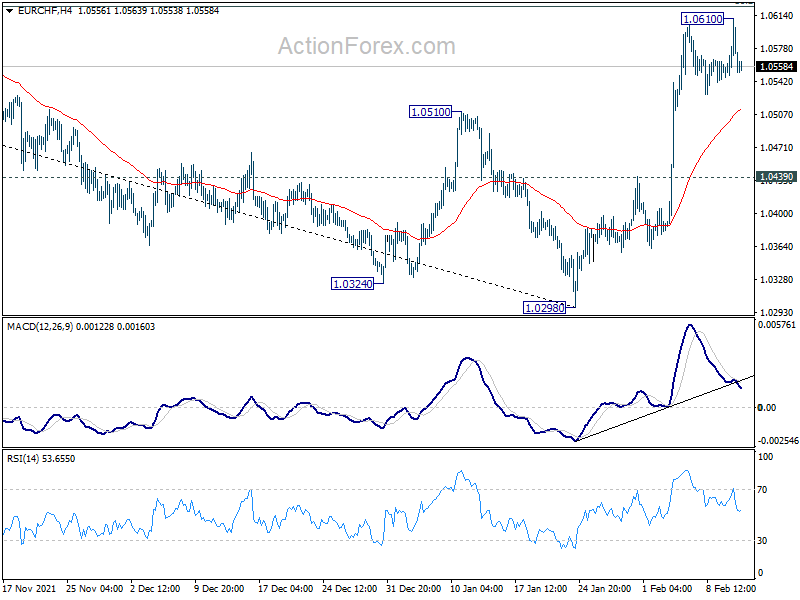
Daily Pivots: (S1) 1.0547; (P) 1.0580; (R1) 1.0608; More....
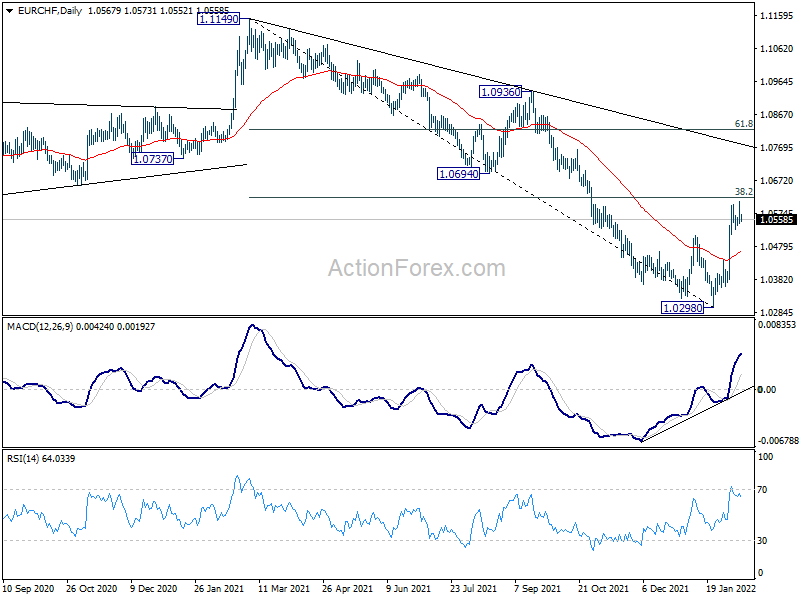
EUR/CHF edged higher to 1.0610 but quickly retreated. Intraday bias remains neutral first. Further rally is expected as long as 1.0439 support holds. A medium term bottom should be in place at 1.0298 already. Sustained trading above 38.2% retracement of 1.1149 to 1.0298 at 1.0623 will raise the chance of trend reversal and target 61.8% retracement at 1.0824 next. However, break of 1.0439 will dampen this bullish view and bring retest of 1.0298 instead.
In the bigger picture, current development suggests that a medium term bottom is formed at 1.0298 on bullish convergence condition in daily MACD. Rebound from there is still tentatively viewed part of a corrective pattern. That is, larger down trend from 1.2004 (2018) could still extend through 1.0298 to 61.8% projection of 1.2004 to 1.0505 to 1.1149 at 1.0223. However, sustained trading above 55 week EMA (now at 1.0673) will argue that the down trend is over, and bring stronger rise back to 1.1149 next.
AUD/USD Daily Report
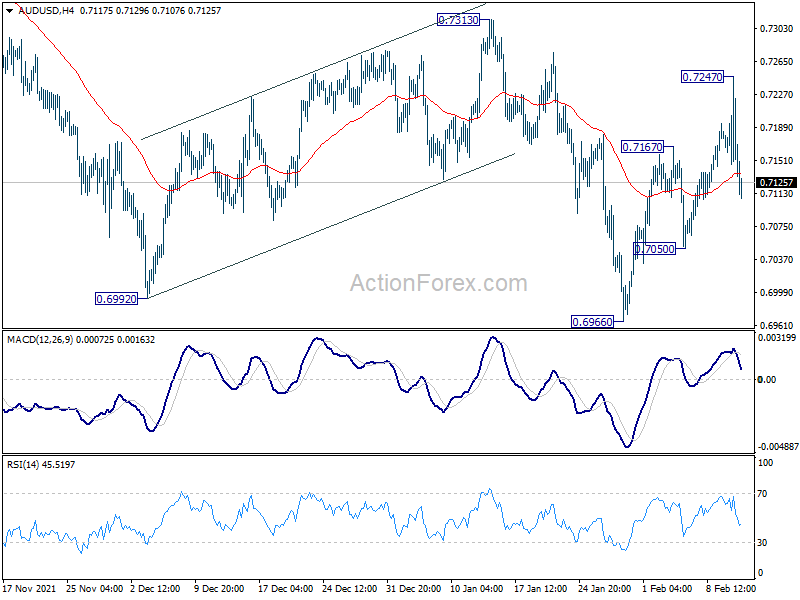
Daily Pivots: (S1) 0.7128; (P) 0.7188; (R1) 0.7229; More...
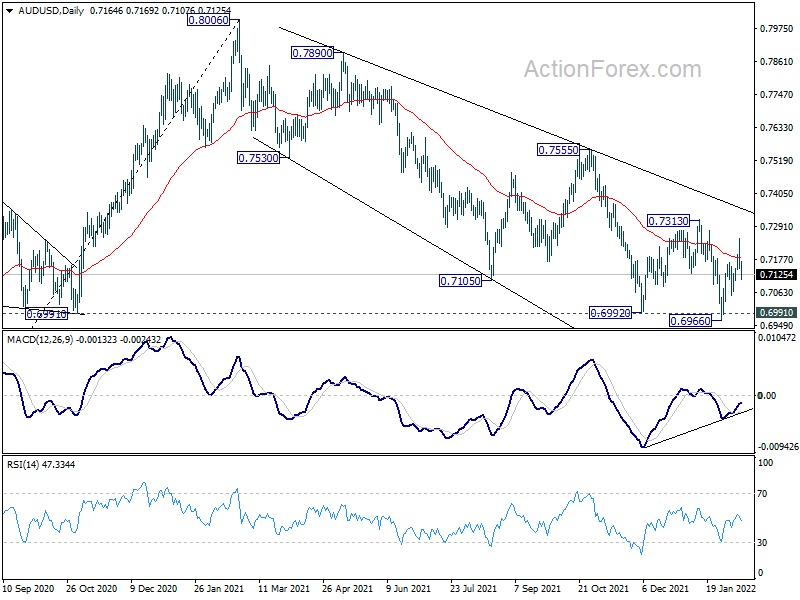
Intraday bias in AUD/USD is turned neutral as it retreated sharply after hitting 0.7247. Further rise is still mildly in favor with 0.7050 minor support intact. Above 0.7247 will target 0.7313 resistance. Decisive break there argue that correction from 0.8006 has completed at 0.6966, after hitting 0.6991 key support. Outlook will be turned bullish for 0.7555 resistance next. On the downside, however, break of 0.7050 support will bring retest of 0.6966 low instead.
In the bigger picture, focus remains on 0.6991 key structural support. Sustained break there will argue that the whole up trend from 0.5506 might be finished at 0.8006, after rejection by 0.8135 long term resistance. Deeper decline would then be seen back to 61.8% retracement of 0.5506 to 0.8006 at 0.6461. Meanwhile, strong rebound from 0.6991 will retain medium term bullishness. That is, whole up trend from 0.5506 is still in progress.