

Sample Category Title
AUDJPY Keeps Bullish Mood Intact with Bounce off 200-MA
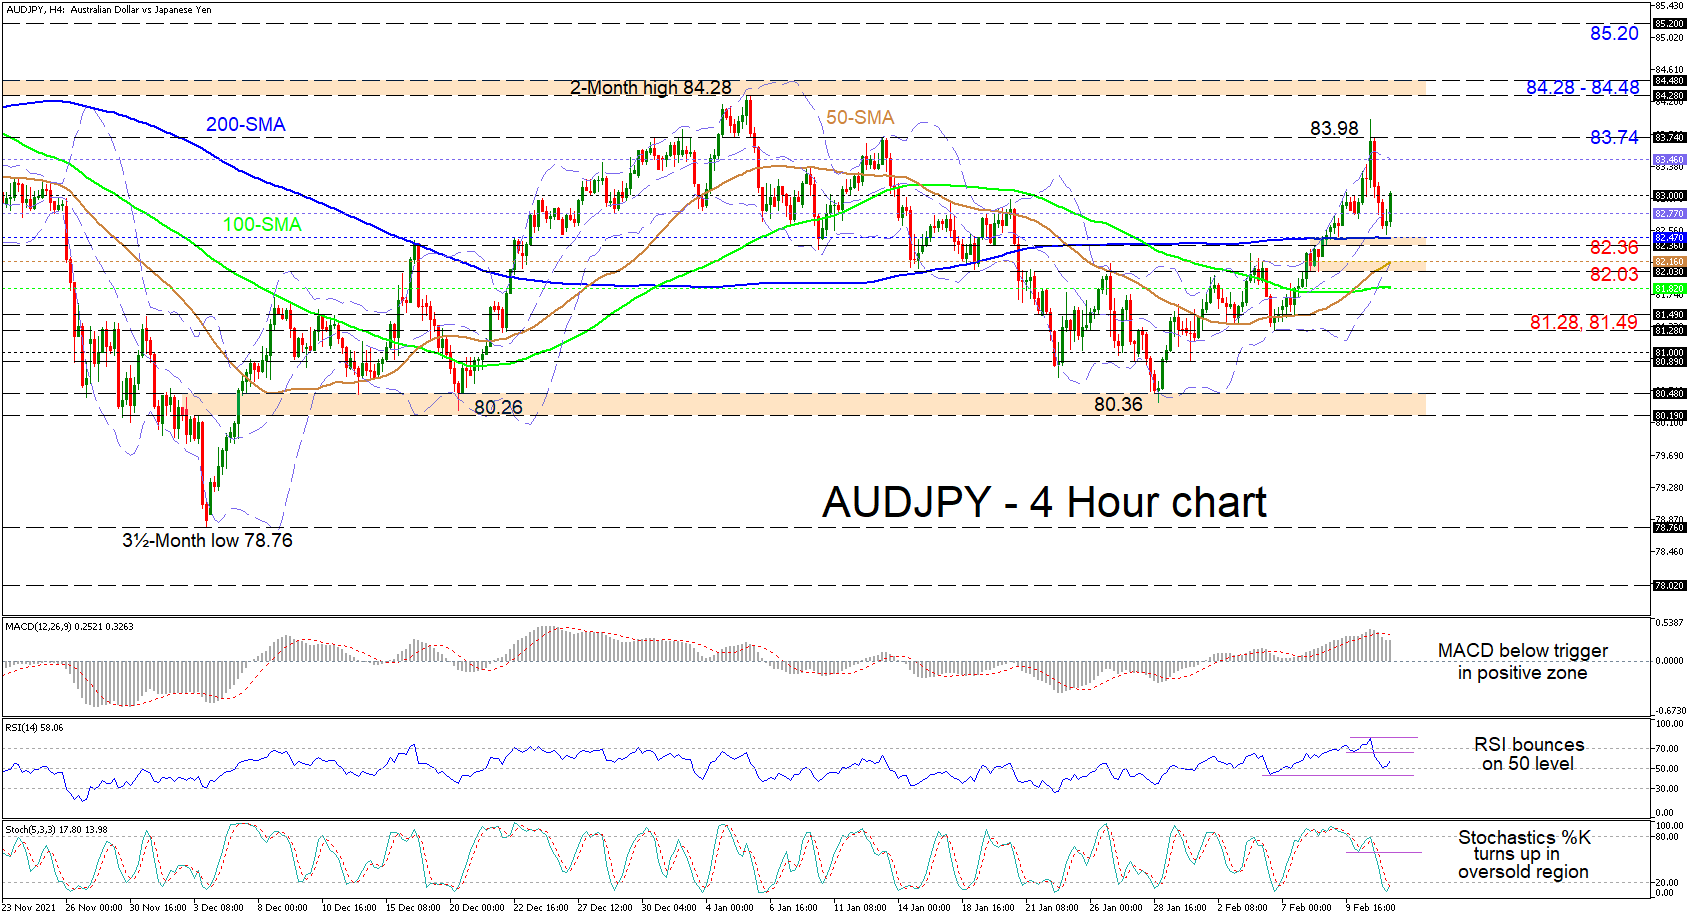
AUDJPY has pushed over the mid-Bollinger band and is confronting the 83.00 handle after gaining some traction from the 200-period simple moving average (SMA). The longer-term horizontal SMAs are endorsing the broader neutral picture, while the climbing 50-period SMA, which is nearing a bullish crossover of the 200-period SMA as well, suggests that the recent upside trend from the 80.36 trough remains active.
The short-term oscillators are reflecting that positive momentum is regaining strength. The MACD, in the positive zone and below its red trigger line, is starting to turn higher, while the RSI has bounced off the 50 neutral threshold. Furthermore, the %K line has made a U-turn and overstepped the %D line in the oversold territory.
If bullish price action develops past the 83.00 mark, the next resistance could emerge at the upper Bollinger band at 83.46. If the price nudges past this barrier too, the tough neighbouring 83.74 border and the 83.98 fresh peak may try to curb advances from acquiring pace. Failing to do so, buyers may have the chance to reinforce a bullish bias should they conquer the 84.28-84.48 resistance ceiling that has held since November 2021. Succeeding could then encourage the bulls to target the 85.20 high, identified at the beginning of November 2021.
If positive powers fade and the price slips back beneath the mid-Bollinger band, a prompt floor may act between the 200-period SMA at 82.47 and the 82.36 obstacle. If this upside defence breaks down, the support band from the 50-period SMA at 82.16 until the 82.03 low could then step into the spotlight. However, if a deeper retreat in the pair evolves, the 100-period SMA at 81.82 may delay the test of the congested lows of 81.49 and 81.28.
Summarizing, AUDJPY’s neutral-to-bullish tone is amping up after finding footing off the 200-period SMA, and a definitive close above the 83.00 hurdle could accelerate it. Yet, for the bias to become bullish, the price would need to propel north of the 84.28-84.48 barricade, while a drop in the pair beneath the 100-period SMA at 81.82 may bolster negative pressures.
UK Posts Mixed Data, But Not Bad for Pound
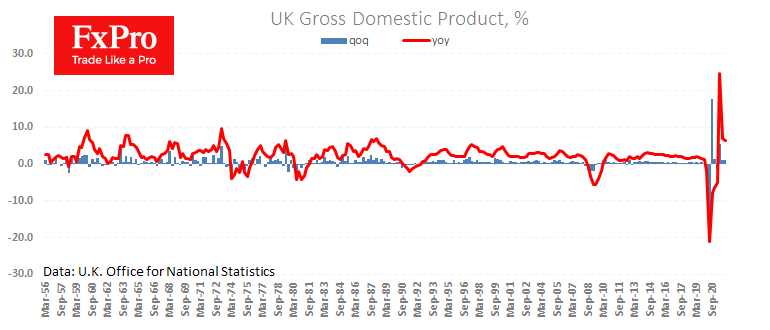
The UK economy added 1% in the fourth quarter last year and is 6.5% higher than a year ago. The annual growth rate is declining as the low base effect fades away.
In December, industrial production added 0.3% and moved into growth territory compared to the same month a year earlier. These are signs that the Bank of England’s interest rate hike cycle has met the UK economy in pretty good shape.
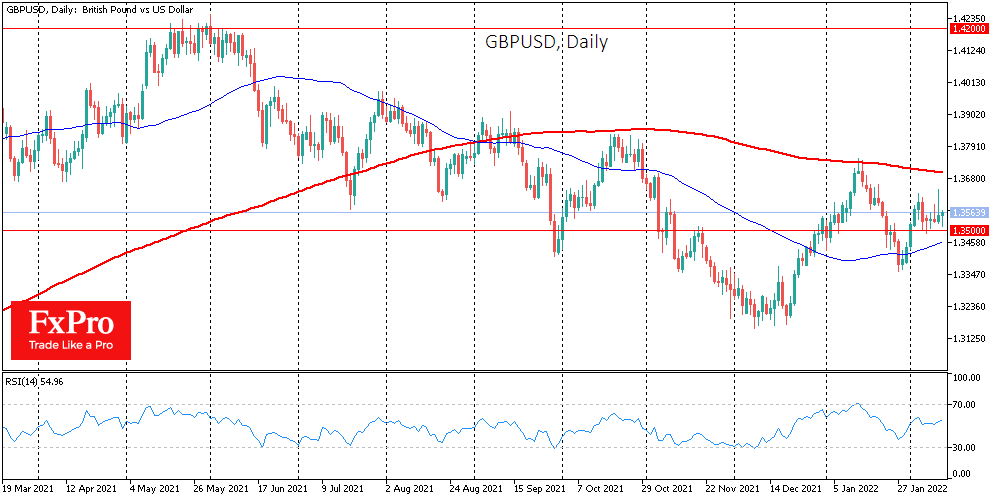
The British pound has been gaining support in the last two days on the declines in the area of 1.35 GBPUSD despite the impressive upward thrust of the dollar. This dynamic is explained by the fact that the Bank of England has as much potential to tighten policy. Locally the pound looks like a decent competitor to the dollar.
The markets are pricing in that the Bank of England may raise the rate by 50 points at one of the following meetings, keeping the policy tightening gap with the Fed. And this is good news for the pound, which could also help reduce inflationary pressures.
EUR/USD Mid-Day Outlook
Daily Pivots: (S1) 1.1371; (P) 1.1433; (R1) 1.1491; More...
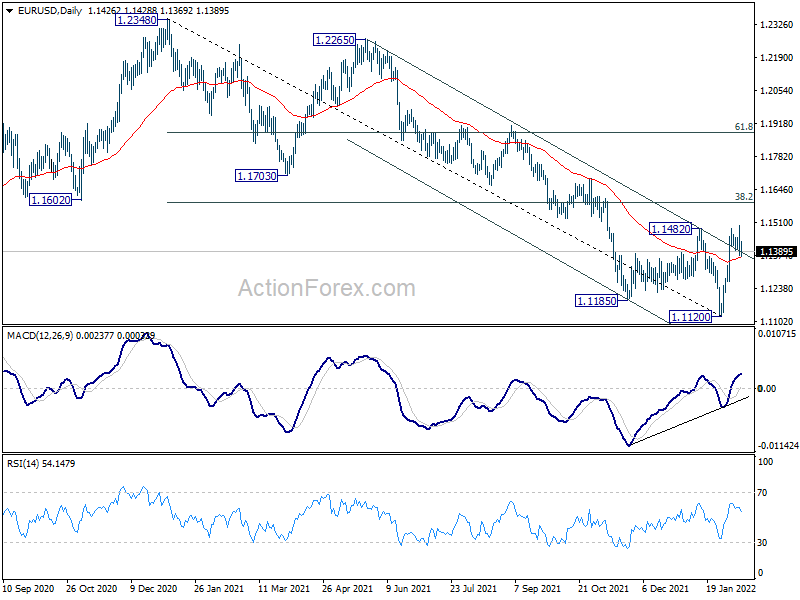
Intraday bias in EUR/USD remains neutral at this point. Further rise is still in favor as long as 1.1265 minor support holds. Sustained break of 1.1482 will target 38.2% retracement of 1.2348 to 1.1120 at 1.1589 next. Sustained break there will argue that whole fall from 1.2348 has completed too and target 61.8% retracement at 1.1879. On the down, however, break of 1.1265 support will dampen this bullish view and bring retest of 1.1120 low instead.
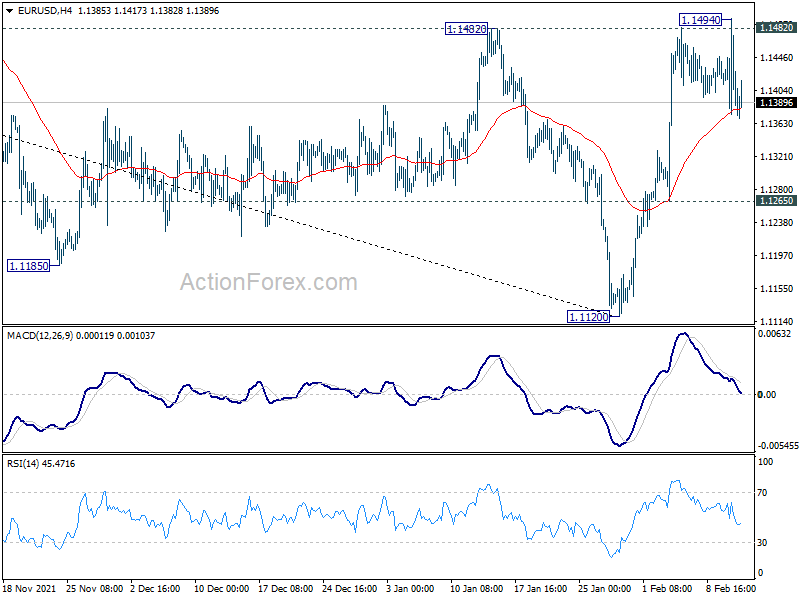
In the bigger picture, the decline from 1.2348 (2021 high) is seen as a leg inside the range pattern from 1.2555 (2018 high). Sustained trading above 55 week EMA (now at 1.1613) will argue that it has completed and stronger rise would be seen back towards top of the range between 1.2348 and 1.2555. However, firm break of 1.0635 (2020 low) will raise the chance of long term down trend resumption and target a retest on 1.0339 (2017 low) next.
USD/CHF Mid-Day Outlook
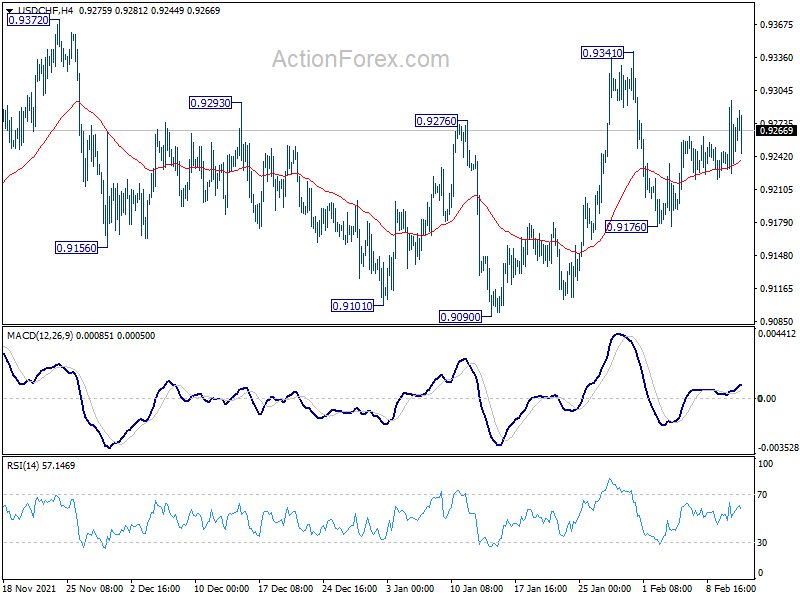
Daily Pivots: (S1) 0.9221; (P) 0.9259; (R1) 0.9291; More....
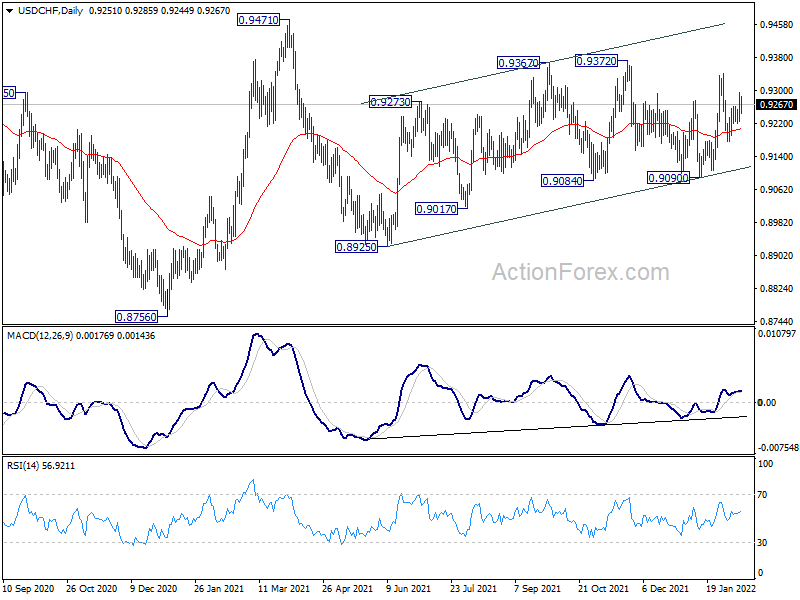
Intraday bias in USD/CHF remains neutral at this point. Further rise will remain mildly in favor as long as 0.9090 support holds. break of 0.9372 will resume the choppy rally from 0.8925 to 0.9471 high. However, break of 0.9090 will turn bias back to the downside for 0.8925 support instead.
In the bigger picture, medium term outlook will be neutral at best as long as 0.9471 resistance holds. Larger down trend could still extend through 0.8756 (2021 low). However, firm break of 0.9471 will argue that the trend has already reversed and rebound the rally from 0.8756 with another impulsive move.
USD/JPY Mid-Day Outlook
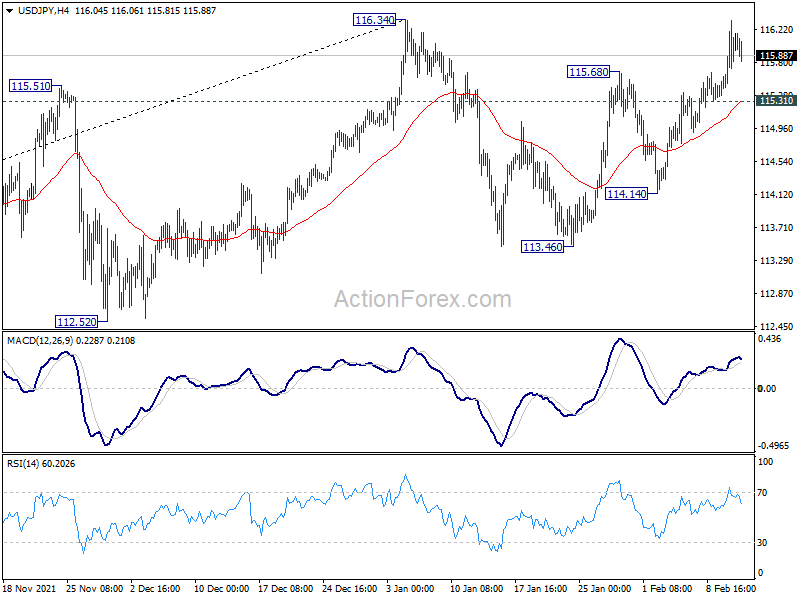
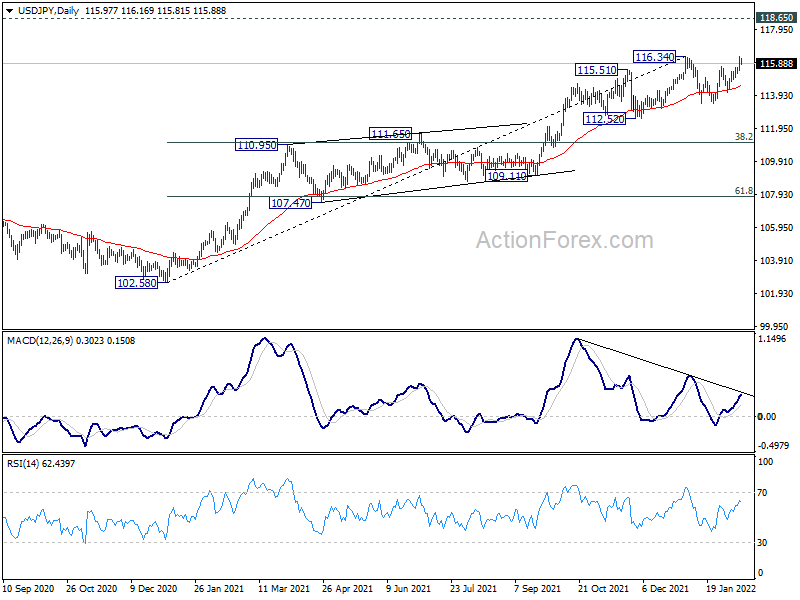
Daily Pivots: (S1) 115.54; (P) 115.94; (R1) 116.40; More...
Intraday bias stays on the upside and focus remains on 116.34 resistance. Firm break there will resume larger up trend from 102.58. Next target is 118.65 long term resistance. On the downside, though, break of 115.31 minor support will extend the corrective pattern from 116.34 with another falling leg, and turn bias back to the downside for 114.14 support and possibly below.
In the bigger picture, no change in the view that rise from 102.58 is the third leg of the up trend from 101.18 (2020 low). Such rally should target a test on 118.65 (2016 high). Sustained break there will pave the way to 120.85 (2015 high) and raise the chance of long term up trend resumption. This will remain the favored case as long as 55 week EMA (now at 111.21) holds.
GBP/USD Mid-Day Outlook
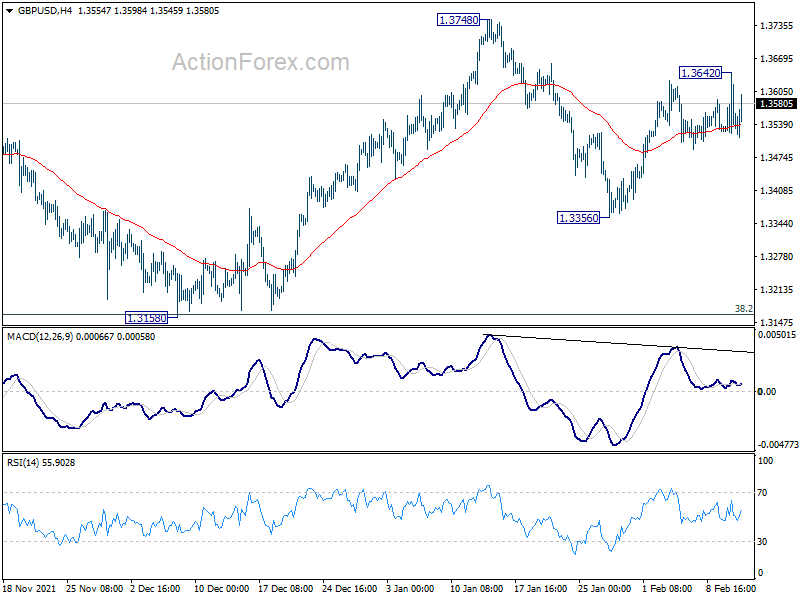
Daily Pivots: (S1) 1.3508; (P) 1.3576; (R1) 1.3628; More...
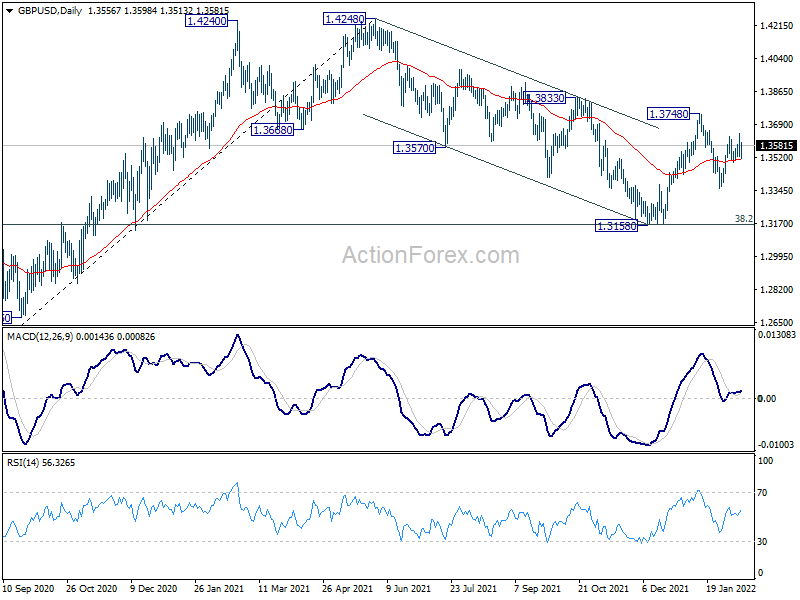
GBP/USD is still bounded in range and intraday bias remains neutral. On the upside, break of 1.3642 will resume the rebound to 1.3748 resistance. Firm break there will revive the bullish case that correction from 1.4248 has completed with three waves down to 1.3158. Further rally should then be seen to retest 1.4248 high. On the downside, however, break of 1.3356 will bring retest of 1.3158 low.
In the bigger picture, as long as 38.2% retracement of 1.1409 to 1.4248 at 1.3164 holds, up trend from 1.1409 (2020 low) is still in progress. On resumption, next target will be 38.2% retracement of 2.1161 to 1.1409 at 1.5134. Nevertheless sustained break of 1.3164 will argue that whole rise from 1.1409 has completed and bring deeper fall to 61.8% retracement at 1.2493.
Sterling Rises after GDP, Dollar Turning Soft Again
Sterling rises broadly today after better than expected GDP data, even though upside momentum is weak so far. Dollar is paring some of the post-CPI gains as over sentiment, while weak, seems to be stabilizing. As for the week, Yen is the worst performing one, followed by Euro and Dollar. Aussie is the strongest one, followed by Kiwi and the Pound. There are still rooms to swap some places, depending on how US stock and bond markets end.
In Europe, at the time of writing, FTSE is down -0.67. DAX is down -0.27%. CAC is down -1.10%. Germany 10-year yield is down -0.025 at 0.260. Earlier in Asia, Hong Kong HSI dropped -0.07%. China Shanghai SSE dropped -0.66%. Singapore Strait Times rose 0.03%. Japan was on holiday.
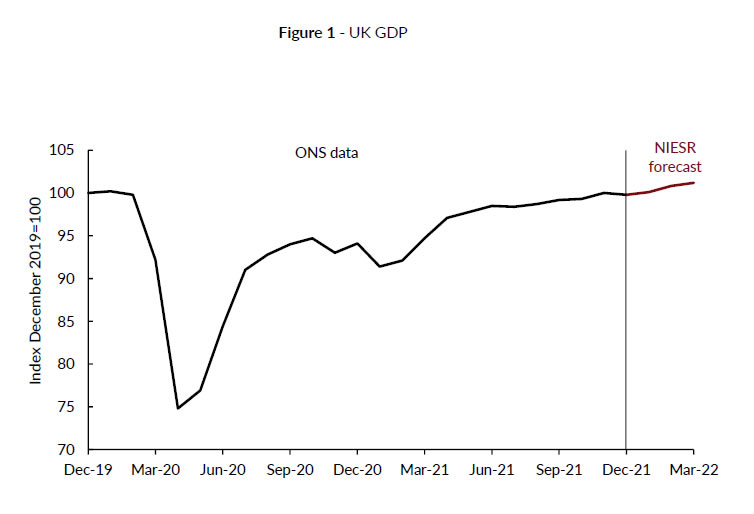
NIESR forecasts 1.0% growth in UK GDP in Q1
NIESR forecast growth of 1.0% in UK GDP in Q1. It said that economic impact of Omicron was "far smaller than" previous two waves. The -0.2% fall in December GDP was also better than consensus forecasts, suggesting the "possibility of a positive reading in January.
"The economic impact of Omicron was far smaller than that of either of the two previous major waves of Covid-19: a mere 0.2 per cent fall in December was even stronger than consensus forecasts, but in line with NIESR's January GDP tracker, suggesting the possibility of a positive reading in January. Unsurprisingly, retail and hospitality contributed the most to December's fall, with the healthcare sector providing the largest positive contribution." - Rory Macqueen Principal Economist, NIESR
UK GDP contracted -0.2% mom in Dec, up 1.0% qoq in Q4
UK GDP contracted -0.2% mom in December, better than expectation of -0.5% mom. Services output dropped -0.5% mom. Production rose 0.3% mom while construction rose 2.0% mom. Services and construction were both above pre-coronavirus levels, by 0.5% and 0.3% respectively, but production remained -2.6% below.
Q4 GDP grew 1.0% qoq, slightly below expectation of 1.0% qoq. The level of GDP in Q4 remained below -0.4% below its pre-coronavirus level in Q4 2019. Nevertheless, monthly GDP was already at its pre-coronavirus level in February 2020.
Also published, manufacturing production rose 0.2% mom, 1.3% yoy in December versus expectation of 0.2% mom, 1.7% yoy. Industrial production rose 0.3% mom, 0.4% yoy, versus expectation of 0.1% mom, 0.6% yoy. Goods trade surplus came in at GBP -12.4B, versus expectation of GBP -13.0B.
DIHK downgrades Germany growth forecasts to 3.0% in 2022
Germany's Chambers of Industry and Commerce (DIHK) lowed 2022 growth forecasts from 3.6% to 3.0%. That is, the economy will probably not reach the pre-crisis level until middle of the year.
"The economy is holding its breath. There is still a cautiously optimistic mood in the companies. However, many do not know how things will continue due to great uncertainty," said DIHK Managing Director Martin Wansleben.
"In addition to the Corona crisis and delivery bottlenecks, the biggest stress factors are above all the sharp rise in energy and raw material prices and the shortage of skilled workers. In addition, there are further expected cost increases due to the transformation in climate protection. It is still an open question, especially for companies that are in international competition how such a compensation should work. Many fear a deterioration of their position on the world markets."
RBA Lowe: We have scope to wait and see
RBA Governor Philip Lowe told a parliamentary committee that it is "too early" to conclude that inflation is "sustainably in the target range". He added, "in underlying terms, inflation has just reached the midpoint of the target band for the first time in over seven years".
The board is "prepared to be patient" and "we have scope to wait and see how the data develop and how some of the uncertainties are resolved. Countries with higher inflation rates have less scope here."
RBNZ survey: Another rate hike expected in Q1, 4-5 hikes in a year
In the latest Survey of Expectations of RBNZ, OCR expectations continued to rise in the short, medium and long term. OCR is expected to rise from current 0.75% to 1.05% by the end of Q1. Mean estimate for OCR for one year ahead was 2.11%, indicating four to five 25bps hikes. Mean two-year ahead OCR expectations were at 2.47%
One-year inflation expectations rose from 3.70% to 4.4%, highest since November 1900. Two-year ahead inflation expectations rose from 2.96% to 3.27%, highest since 1991. Five-year inflation expectations also rose slightly from 2.17% to 2.30%, highest since 20-17.
GBP/USD Mid-Day Outlook
Daily Pivots: (S1) 1.3508; (P) 1.3576; (R1) 1.3628; More...
GBP/USD is still bounded in range and intraday bias remains neutral. On the upside, break of 1.3642 will resume the rebound to 1.3748 resistance. Firm break there will revive the bullish case that correction from 1.4248 has completed with three waves down to 1.3158. Further rally should then be seen to retest 1.4248 high. On the downside, however, break of 1.3356 will bring retest of 1.3158 low.
In the bigger picture, as long as 38.2% retracement of 1.1409 to 1.4248 at 1.3164 holds, up trend from 1.1409 (2020 low) is still in progress. On resumption, next target will be 38.2% retracement of 2.1161 to 1.1409 at 1.5134. Nevertheless sustained break of 1.3164 will argue that whole rise from 1.1409 has completed and bring deeper fall to 61.8% retracement at 1.2493
Economic Indicators Update
| GMT | Ccy | Events | Actual | Forecast | Previous | Revised |
|---|---|---|---|---|---|---|
| 21:30 | NZD | Business NZ PMI Jan | 52.1 | 53.7 | 53.8 | |
| 02:00 | NZD | RBNZ Inflation Expectations Q1 | 3.27% | 2.96% | ||
| 07:00 | EUR | Germany CPI M/M Jan F | 0.40% | 0.40% | 0.40% | |
| 07:00 | EUR | Germany CPI Y/Y Jan F | 4.90% | 4.90% | 4.90% | |
| 07:00 | GBP | GDP M/M Dec | -0.20% | -0.50% | 0.90% | |
| 07:00 | GBP | GDP Q/Q Q4 P | 1.00% | 1.10% | 1.10% | |
| 07:00 | GBP | Index of Services 3M/3M Dec | 1.20% | 1.20% | 1.30% | |
| 07:00 | GBP | Manufacturing Production M/M Dec | 0.20% | 0.20% | 1.10% | 0.70% |
| 07:00 | GBP | Manufacturing Production Y/Y Dec | 1.30% | 1.70% | 0.40% | -0.10% |
| 07:00 | GBP | Industrial Production M/M Dec | 0.30% | 0.10% | 1.00% | 0.70% |
| 07:00 | GBP | Industrial Production Y/Y Dec | 0.40% | 0.60% | 0.10% | -0.20% |
| 07:00 | GBP | Goods Trade Balance (GBP) Dec | -12.4B | -13.0B | -11.3B | -12.701B |
| 07:30 | CHF | CPI M/M Jan | 0.20% | 0.10% | -0.10% | |
| 07:30 | CHF | CPI Y/Y Jan | 1.60% | 1.60% | 1.50% | |
| 15:00 | USD | Michigan Consumer Sentiment Index Feb P | 67.6 | 67.2 |
NIESR forecasts 1.0% growth in UK GDP in Q1
NIESR forecast growth of 1.0% in UK GDP in Q1. It said that economic impact of Omicron was "far smaller than" previous two waves. The -0.2% fall in December GDP was also better than consensus forecasts, suggesting the "possibility of a positive reading in January.
"The economic impact of Omicron was far smaller than that of either of the two previous major waves of Covid-19: a mere 0.2 per cent fall in December was even stronger than consensus forecasts, but in line with NIESR's January GDP tracker, suggesting the possibility of a positive reading in January. Unsurprisingly, retail and hospitality contributed the most to December's fall, with the healthcare sector providing the largest positive contribution." - Rory Macqueen Principal Economist, NIESR
Ending the Week in the Red
Stock markets are ending the week in the red after investors were dealt another inflation blow on Thursday which dampened sentiment once more.
We were just starting to see confidence building in the markets, with investors seemingly coming to terms with the prospect of four or five rate hikes this year. But the relentless and broad-based price rises in the US delivered yet another hammer blow and ruined any momentum that had been building into the report.
We're now entering into quite uncomfortable territory and the very real prospect of multiple rate hikes before the summer as well as a 50 basis point increase to kick things off in March.
What's more, the Fed's Bullard even floated the idea of unscheduled meetings to raise rates and respond more quickly to the data, which seems rather radical. But then, inflation is at a 40-year high, almost four times the Fed's target, and is accelerating faster than most continue to anticipate.
A 50 basis point hike in March is now backed quite heavily in the markets - even though a number of policymakers are still unconvinced - with further hikes following at consecutive meetings after that.
What we could see is the Fed take a similar approach to what the Bank of England appears to be doing and line up a series of increases until the summer, then hope inflation peaks late in Q1/early Q2, as they anticipate, and falls significantly enough after to considerably ease the pressure.
Markets are not erring on the side of hope and are pricing in plenty more hikes in the second half of the year on the belief that the central banks will once again prove too optimistic. While that may lead to plenty more instability in the stock markets over the next couple of months, it could become a useful tailwind in the second half of the year if inflation does fall considerably after peaking and allow for some of the interest rate positionings to be unwound.
UK weathers omicron storm well in December
The UK grew at its fastest annual rate since the second world war last year as it rebounded strongly from a sharp downturn the year before. GDP remains slightly below its pre-pandemic peak though, lagging behind a number of other countries including the US, France, and Canada that have since surpassed those levels.
The economy fared better than expected in December while the services sector was naturally hit hard by the onset of omicron. The start of the new year brings its own challenges, with the cost of living crisis - exacerbated by tax increases in March - becoming a drag on the economy, while omicron likely continued to weigh in January.
None of this is likely to influence the Bank of England over the coming months as the central bank tackles high inflation head-on. Two rate hikes at consecutive meetings and a strong hint at more in the months ahead will compound the squeeze on households and businesses this year. Although that is certainly preferable to the alternative.
Oil jumps as IEA confirms tight market conditions
Oil prices are rallying once more as the IEA raised forecasts for demand this year and confirmed that OPEC+ missed its output targets again in January and by an even wider margin of 900,000 barrels. The group acknowledged that the market is tight right now while highlighting that a nuclear deal between the US and Iran could release 1.3 million barrels of supply. There was also a nod to Saudi Arabia, where available spare capacity is apparently concentrated. Not that the White House is having any luck convincing them to unleash it.
Gold slips after inflation data
A jump in yields on Thursday on the back of the inflation data stopped gold from recording the eighth day of gains in nine. The yellow metal gave up initial gains to end the day a little lower as markets priced in a sixth hike this year in the US and yields elsewhere also rose.
Gold has remained a favourite recently even as rate hike expectations have increased, probably benefiting from its inflation hedge reputation, but there's surely going to come a point when so many hikes are priced in that it will lose some appeal. That's not to say it will suddenly tumble but gains may become limited, as we've seen in recent months around these levels.
Bitcoin continues to show resilience
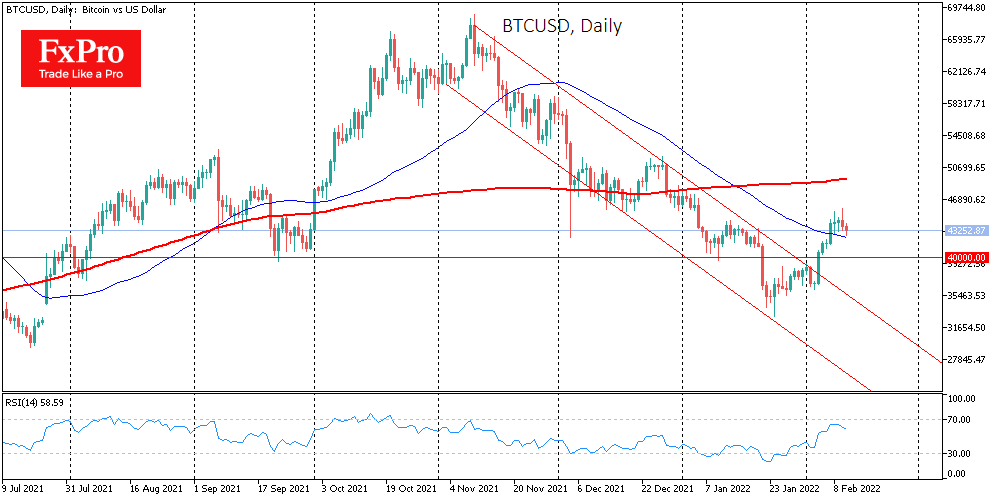
Bitcoin has once again shown some resilience in these volatile markets, as it continues to linger around $45,500 resistance. Its link with risk assets over the last month or so appears to have weakened over the last week or two and we're seeing that again over the last 24 hours. While stocks are coming under heavy pressure, especially the Nasdaq, bitcoin has only slightly pared gains after seeing some profit-taking around key resistance. That could give the crypto crowd plenty of confidence in the coming weeks even if broader risk appetite remains shaky.
Bitcoin Sold Out on US Inflation
Cryptocurrencies were under the pressure of strong data on inflation in the United States on Thursday, which has updated 40-year highs. Such values can force the Fed to raise interest rates faster, which is negative for all risky assets, including cryptocurrencies.
Bitcoin showed high volatility during trading, updating early January highs above $45,800 under the influence of a weakening dollar. However, towards the end of the day, the first cryptocurrency began to decline along with stock indices: the S&P500 lost 1.8%, the high-tech Nasdaq fell 2.1%.
The crypto-currency index of fear and greed for the second day is exactly in the middle of the scale, at around 50 (neutral). However, now the stock markets are having an increased impact on the dynamics of Bitcoin and Ethereum, in which the prospects for monetary policy are being reassessed. The corresponding index is now in the fear territory, near the 37 mark.
Meanwhile, Bitcoin is being bought back on dips towards the 50-day average, which keeps the picture bullish. However, in the event of a prolonged sale of shares, the first cryptocurrency will not hold and risks pulling the entire market with it.
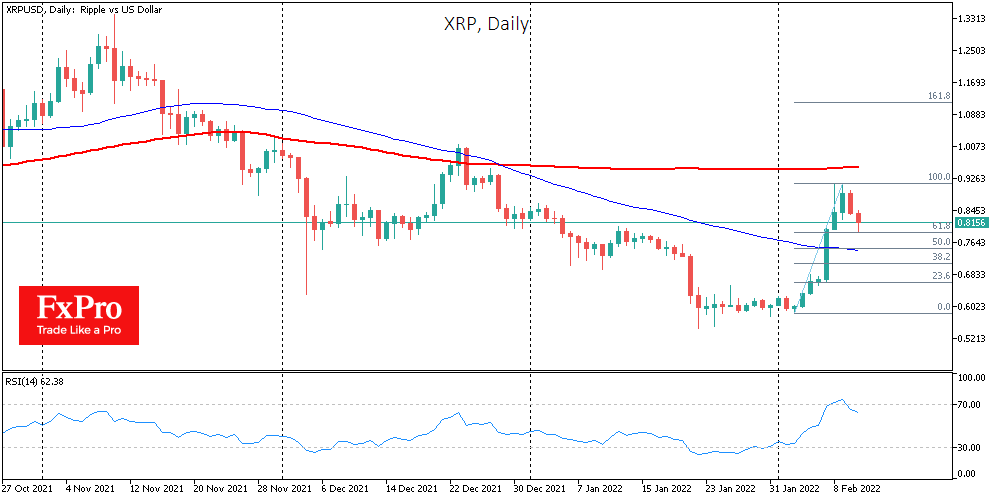
XRP and Solana have both lost around 6% over the past 24 hours, falling amid a general reduction in risk traction in the markets and the two largest cryptocurrencies.
Despite the apparent depth of the pullback, XRP remains 32% above levels from a week earlier, and the current retreat is well within Fibonacci technical correction from the rally of the past eight days.
A drop below $0.78 would signal a deeper correction and open a quick path to $0.75. If all of February’s gains are entirely nullified in the coming week and quotes pull back to below $0.60, it would be safe to speak of a new depressed period with a long-term downside potential of 50% to $0.3.
The technical picture in Solana and Polkadot is worse, as a shadow hangs over them. The rise from January 28th to February 7th looked like a technical rebound after being oversold since November. But this growth momentum is quickly fading. We can say for this coin that without positivity for the overall market, it will continue to lose ground faster than BTC and ETH.