Sample Category Title
EUR/USD and AUD/USD Look for Correction: Elliott Wave Analysis
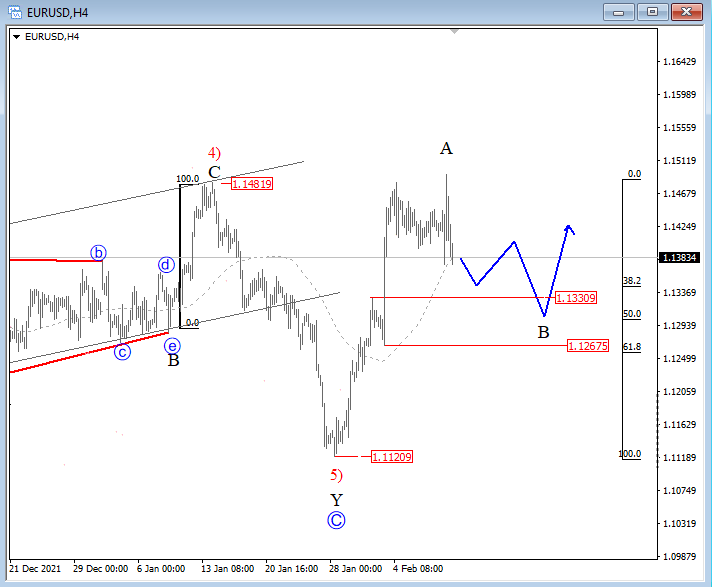
After the first bearish reaction on the USD after US CPI yesterday, the currency turned down later during the US session. Probably it was due to higher 10 year US yields. Stocks also came down, which is supportive for the buck. EURUSD spiked to a new high but then finished the day lower, so it appears temporary top is in place at 1.15 and that new three wave set-back is now underway.
EUR/USD 4h Elliott Wave analysis
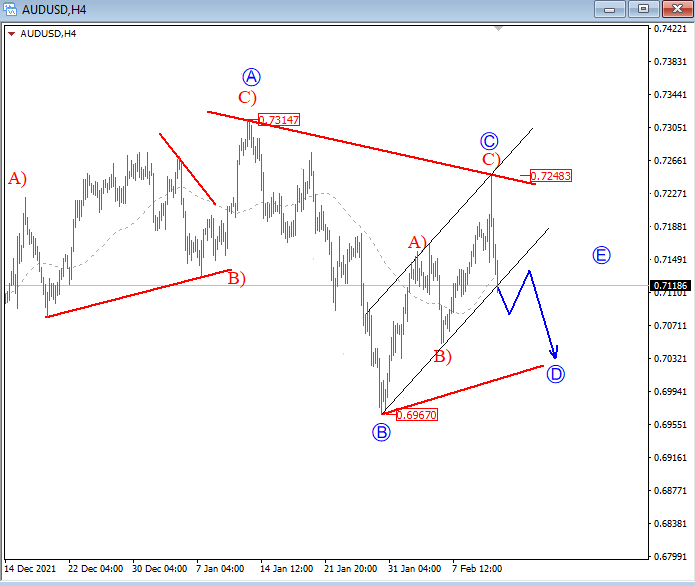
AUDUSD firstly hits new high yesterday and then stopped at 100% Fib equality level. More important, a turndown is now sharp and impulsive so ideally, it's part of a higher degree three-wave structure that can send the pair again close to 0.7
AUD/USD 4h Elliott Wave analysis
NZD Dips as Inflation Expectations Rise
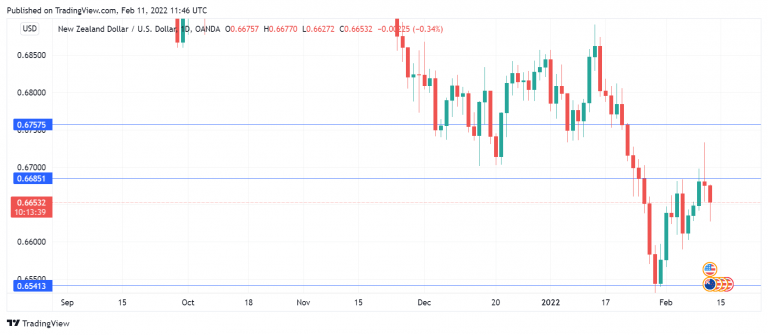
The New Zealand dollar is down 0.38% on the day, as it trades at 0.6650 in the European session.
NZD/USD went for a ride on Thursday, rising close to 1% before retreating and giving up these gains. This was a common thread for most of the major currencies, as the US dollar softened after the hot US inflation report but managed to recover most of these losses by the end of the day.
RBNZ Inflation Expectations rises
New Zealand has not been immune to surging inflation. CPI climbed 5.9% in Q4 YoY, its highest level since 1990. The RBNZ Inflation Expectations survey indicated that consumers expect inflation to continue to rise. This finding is not surprising but will be of concern to the central bank since inflation expectations can manifest into actual inflation. The survey found that one-year ahead inflation expectations rose to 4.4% in Q4, up from 3.7% in Q3. For two years, consumers expected inflation at 3.27%, up from 2.96% previously.
The RBNZ has embarked on a series of rate hikes aimed at normalizing policy, and an increase in inflation expectations will add pressure on the central bank to tighten more aggressively in order to lower inflation to the bank’s target of 1%-3%. The bank holds a policy meeting on February 23rd and is widely expected to hike rates. The recent hikes have been in increments of 25 basis points, but with no signs that surging inflation will ease anytime soon, policymakers may feel that a strong dose of medicine in the form of a half-point rise in rates is warranted.
In the US, inflation has reached 40-year highs and shows no signs of easing, raising speculation that the Fed will need to become more aggressive in its tightening. FOMC member Loretta Mester said on Wednesday that the Fed needed to act to tame inflation, but she didn’t see a compelling case to raise rates by a half-point at the March meeting. The markets disagree, however, and are bracing for a half-point move. CME’s FedWatch indicates has gauged the likelihood of a 0.50% hike in March at 96%, up from just 33% earlier in the week, before the hot US inflation report.
NZD/USD Technical
- NZD/USD has support at 0.6541 and 0.6469
- 0.6685 is a weak resistance line, followed by 0.6757
GBPUSD Trendless Despite Growing Bullish Forces
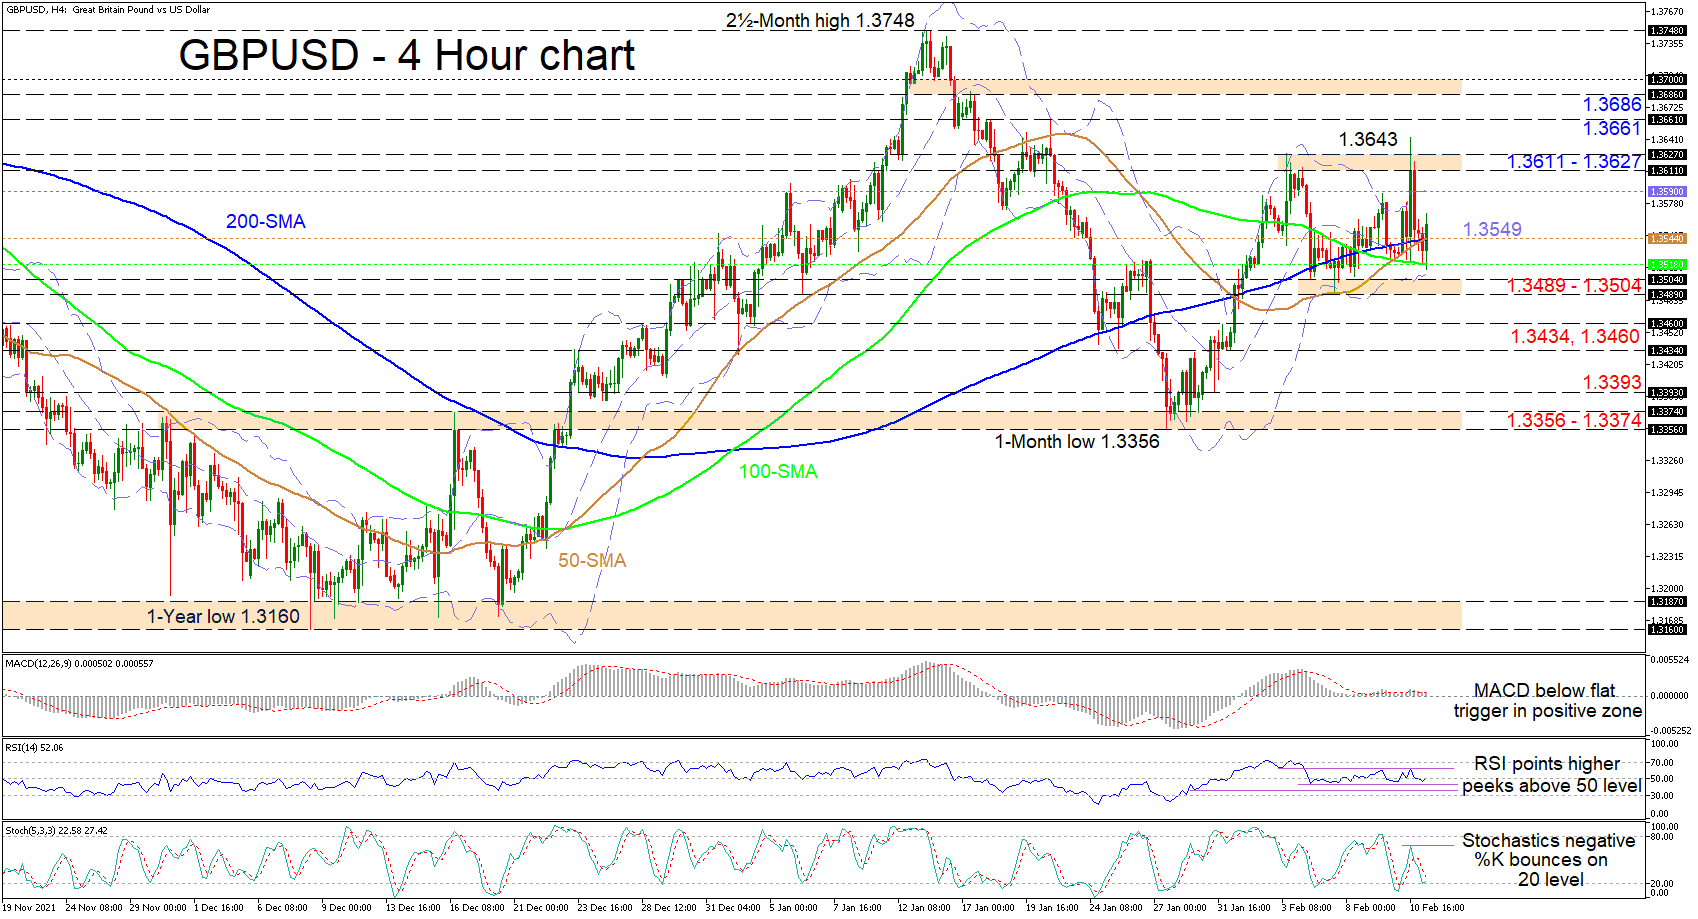
GBPUSD buyers have resurfaced around the 100-period simple moving average (SMA) after the pair’s recent retreat from a 1.3643 spike. Currently, the SMAs have tangled and are not indicating a clear message in terms of a price direction. That said, the 50-period SMA has regained its incline and has just crossed above the 200-period SMA, tilting the directional scale in favour of the upside.
The short-term oscillators are indicating that driving momentum in the pair has practically disengaged. The MACD is sandwiched between its neutral threshold and the flattened red trigger line, which is a tad above the zero mark. The RSI has marginally overstepped the 50 level, while the uptick in the stochastic %K line is hinting that the negative charge of the oscillator is weakening. As such, both are presently implying that buyers are slightly in the lead.
In the positive scenario, if the price gains more legs above the SMAs and the mid-Bollinger band at 1.3549, buyers may face the next positive hindrance at the upper Bollinger band at 1.3590. Should buyers keep at it, upside pressures could emanate from the nearby 1.3611-1.3627 resistance band, where the former level being the February 3 high, allowed only a price spike to 1.3643 before the pair surrendered 100 points back to the SMAs. That said, if the bulls overcome this barricade and stretch beyond the 1.3643 level, they could then confront the 1.3661 barrier before pursuing the 1.3686-1.3700 resistance border.
Alternatively, if selling interest intensifies and the pair sinks back beneath the SMAs around 1.3544 and 1.3518, the lower Bollinger band - coupled with the 1.3489-1.3504 support foundation - could once again attempt to dismiss negative tendencies from gaining the upper hand. However, failing to do so, the 1.3460 and 1.3434 obstacles may then take heavy fire. Dropping past these barriers too, the bears could challenge the 1.3393 trough and the 1.3356-1.3374 support border that extends back to the end of November 2021.
Summarizing, GBPUSD is sustaining a minor neutral-to-bullish tilt above the 1.3489-1.3504 base, and for the bullish mood to bolster, the price would need to float above the 1.3611-1.3627 resistance. Instead, for a bearish tone to return, a profound dive in the price would need to pierce beneath the 1.3356-1.3374 support.
US 100 Hits Resistance
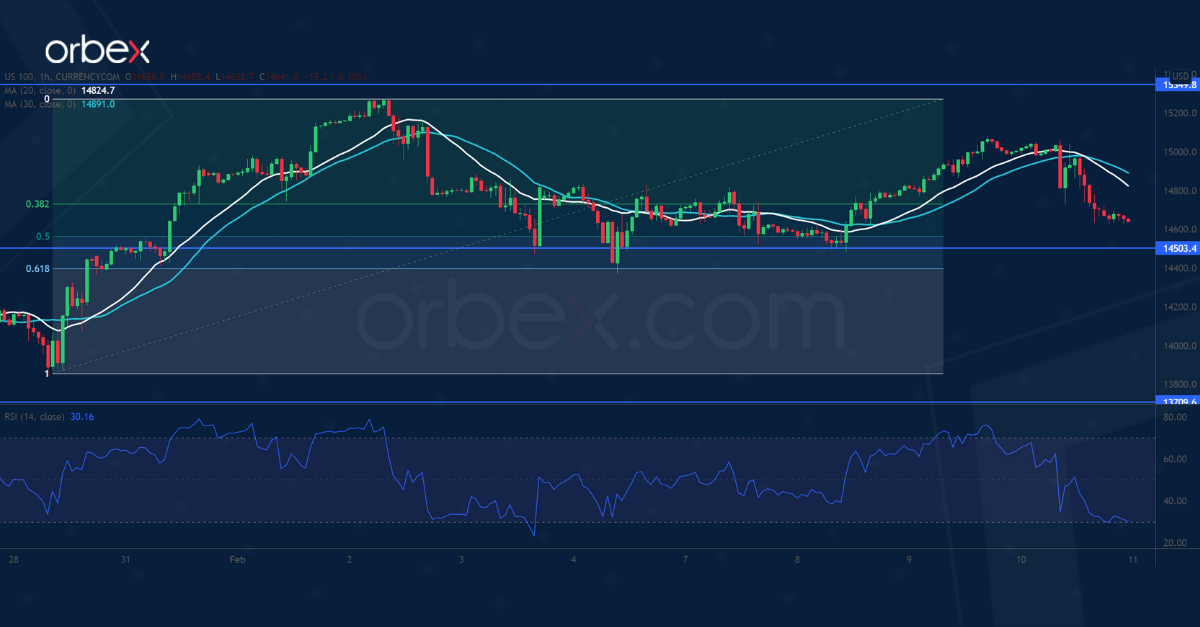
The Nasdaq 100 struggles as record-high US inflation exacerbates rate hike concerns.
The previous rebound has eased selling pressure but hit resistance under 15350. The subsequent pullback bounced off the 61.8% Fibonacci retracement level (14400), which suggests buyers’ strong interest in keeping the index afloat.
Sentiment is still a tad cautious unless the bulls clear the said hurdle. Then the psychological level of 16000 could be within reach. 14500 is a key support in case of an extended consolidation.
XAG/USD Seeks Support
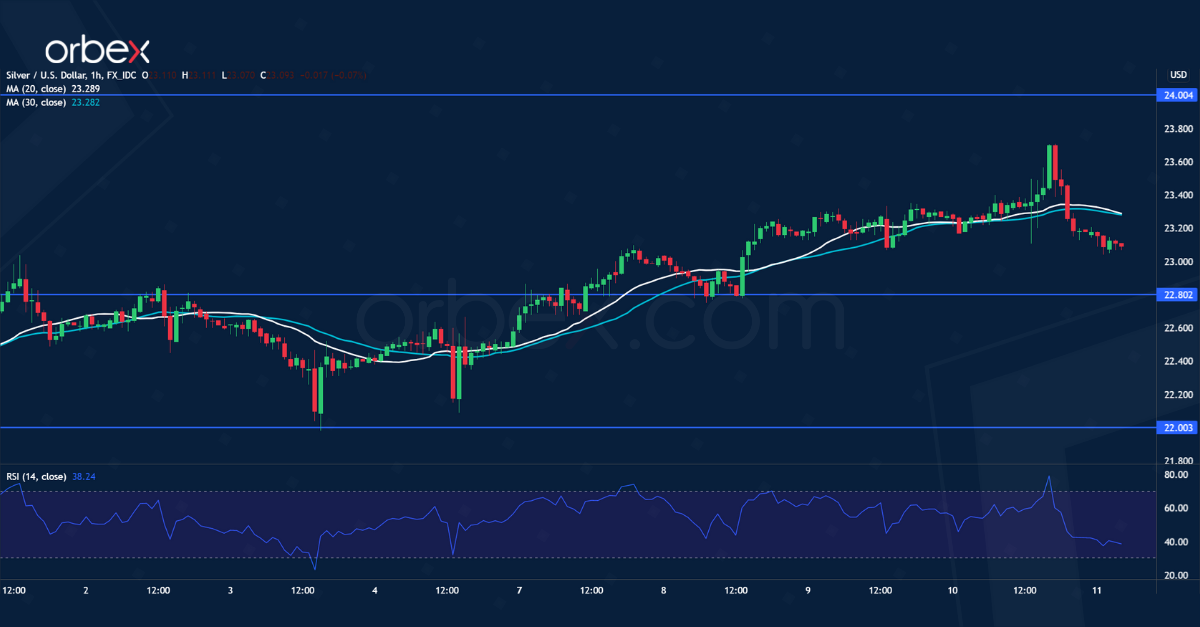
Bullions fell back after US Treasury yields soared over hot US inflation data. The psychological level of 22.00 has proven to be a solid demand area.
A break above 23.00 has forced sellers to cover, paving the way for an upward extension. 24.00 from a previous rectangle consolidation is the next resistance.
A bullish breakout would bring silver back to this year’s high at 24.70. On the downside, the resistance-turned-support at 22.80 could see buying interest in case of a retracement.
USD/JPY to Test Major Resistance
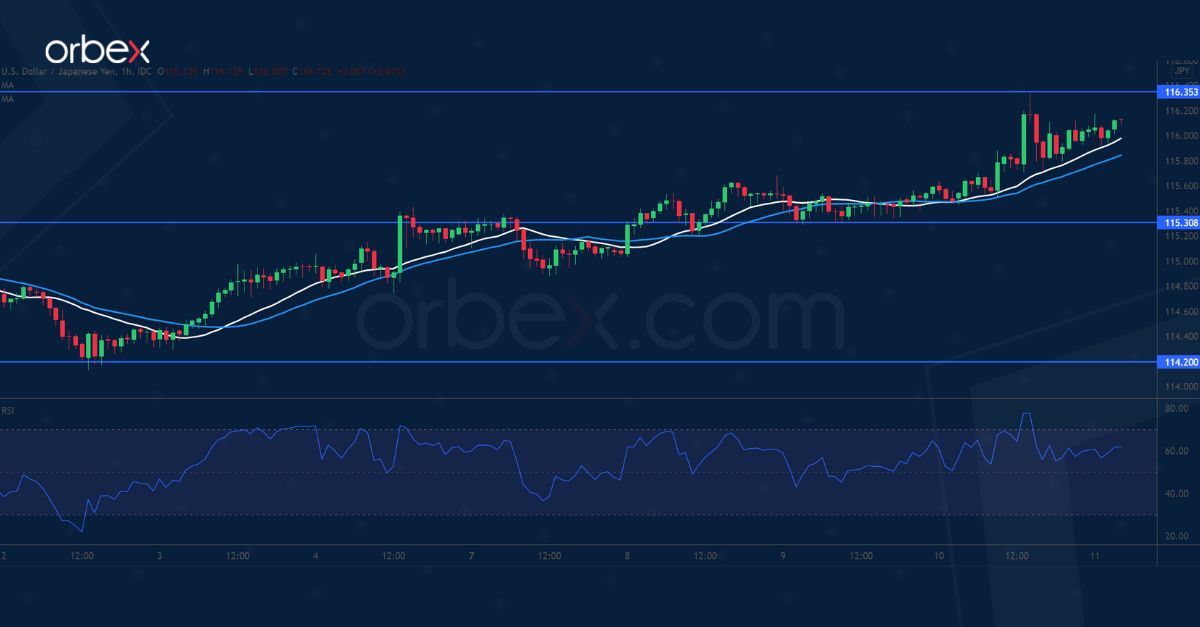
The US dollar surged after consumer prices hit a 40-year high. Higher lows and then a close above the recent peak at 115.65 is an indication of strong bullish pressure.
This breakout has propelled the greenback to January’s high at 116.35. Its breach could trigger a runaway rally and resume the uptrend in the medium term.
An overbought RSI on the hourly chart may briefly restrain the bullish fever. 115.30 is the closest support and the bulls may see a pullback as an opportunity to stake in.
DIHK downgrades Germany growth forecasts to 3.0% in 2022
Germany's Chambers of Industry and Commerce (DIHK) lowed 2022 growth forecasts from 3.6% to 3.0%. That is, the economy will probably not reach the pre-crisis level until middle of the year.
"The economy is holding its breath. There is still a cautiously optimistic mood in the companies. However, many do not know how things will continue due to great uncertainty," said DIHK Managing Director Martin Wansleben.
"In addition to the Corona crisis and delivery bottlenecks, the biggest stress factors are above all the sharp rise in energy and raw material prices and the shortage of skilled workers. In addition, there are further expected cost increases due to the transformation in climate protection. It is still an open question, especially for companies that are in international competition how such a compensation should work. Many fear a deterioration of their position on the world markets."
EUR/USD Pair Started a Fresh Decline Below 1.1500
The Euro gained pace above the 1.1420 level against the US Dollar. However, the EUR/USD pair struggled below the 1.1500 level and started a fresh decline.
There was a move below the 1.1420 level the 50 hourly simple moving average. Besides, there was a break below a key bullish trend line with support near 1.1415 on the hourly chart. A low was formed near 1.1377 on FXOpen and the pair is now consolidating losses.
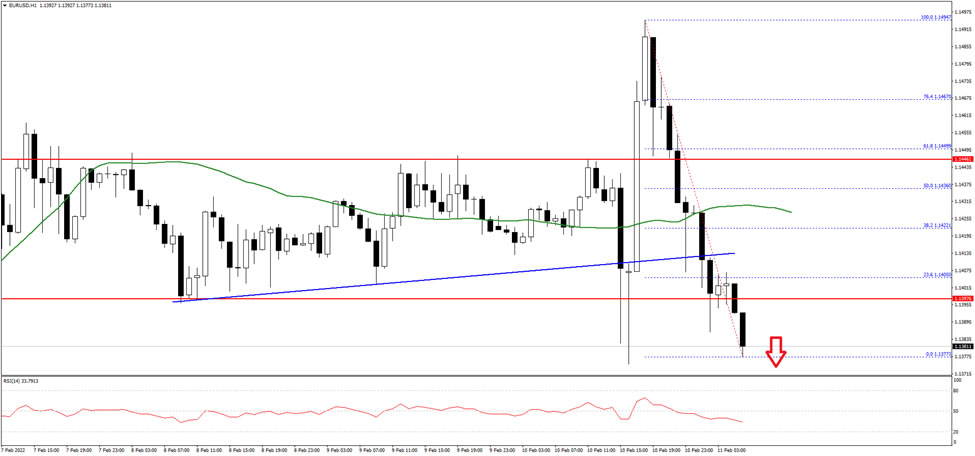
An immediate resistance near the 1.1405 level. The next major resistance is near the 1.1425 level. A break above the 1.1420 and 1.1425 resistance levels could start a decent increase towards the 1.1465 level in the near term.
On the downside, an initial support is near the 1.1380 level. The next key support is near 1.1350, below the pair could decline towards the 1.1315 level in the near term.
Pound Yawns after UK GDP as Expected
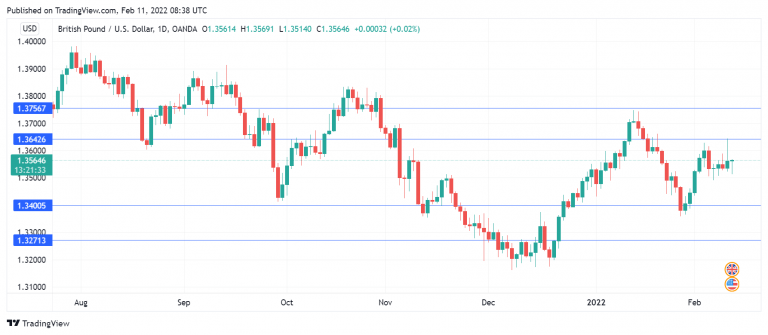
The pound is slightly lower on Friday, after taking investors on a roller-coaster ride a day earlier. GBP/USD was up over 100 points on Thursday after the US inflation report, but the pound surrendered almost all of these gains later in the day.
The UK treated the markets to data dump on Friday, but the pound shrugged. The key release, quarterly GDP, was within expectations, was unchanged at 1.1% in Q4 q/q (1.0% est.). Investors didn’t flinch as GDP fell by 0.2% in December, as health restrictions in response to Omicron took a toll on consumer spending during the holiday season. Manufacturing Production climbed 1.3%, shy of the estimate of 1.7% but a strong improvement from the previous read of -0.1%.
FOMC member Loretta Mester said on Wednesday that the Fed needed to act to tame inflation, but she didn’t see a compelling case to raise rates by a half-point at the March meeting. The markets disagree, however, and are bracing for a half-point move. CME’s FedWatch indicates has gauged the likelihood of a 0.50% hike at a whopping 96%, up from just 33% earlier in the week, before the hot US inflation report.
Inflation, oil prices could spell trouble for Biden
The highly anticipated US inflation reading did not disappoint, coming in a 7.5% y/y for January. This beat the forecast of 7.3% and was up from 7.0% in December. Supply disruptions continue to persist, and if the Ukraine/Russia conflict worsens, oil prices could climb towards the USD 100 dollar level. Higher inflation and rising oil prices could spell big trouble for President Biden, as frustrated voters could voice their anger in the US midterm elections in November. The ray of light for Biden is if a deal is reached with Iran in the nuclear talks, which would release Iranian oil into the world markets.
GBP/USD Technical Analysis
- GBP/USD is putting pressure on resistance at 1.3642. Above, there is resistance at 1.3756
- There is support at 1.3400 and 1.3272
GBPAUD Marks Yet More Higher Lows as Bullish Forces Linger
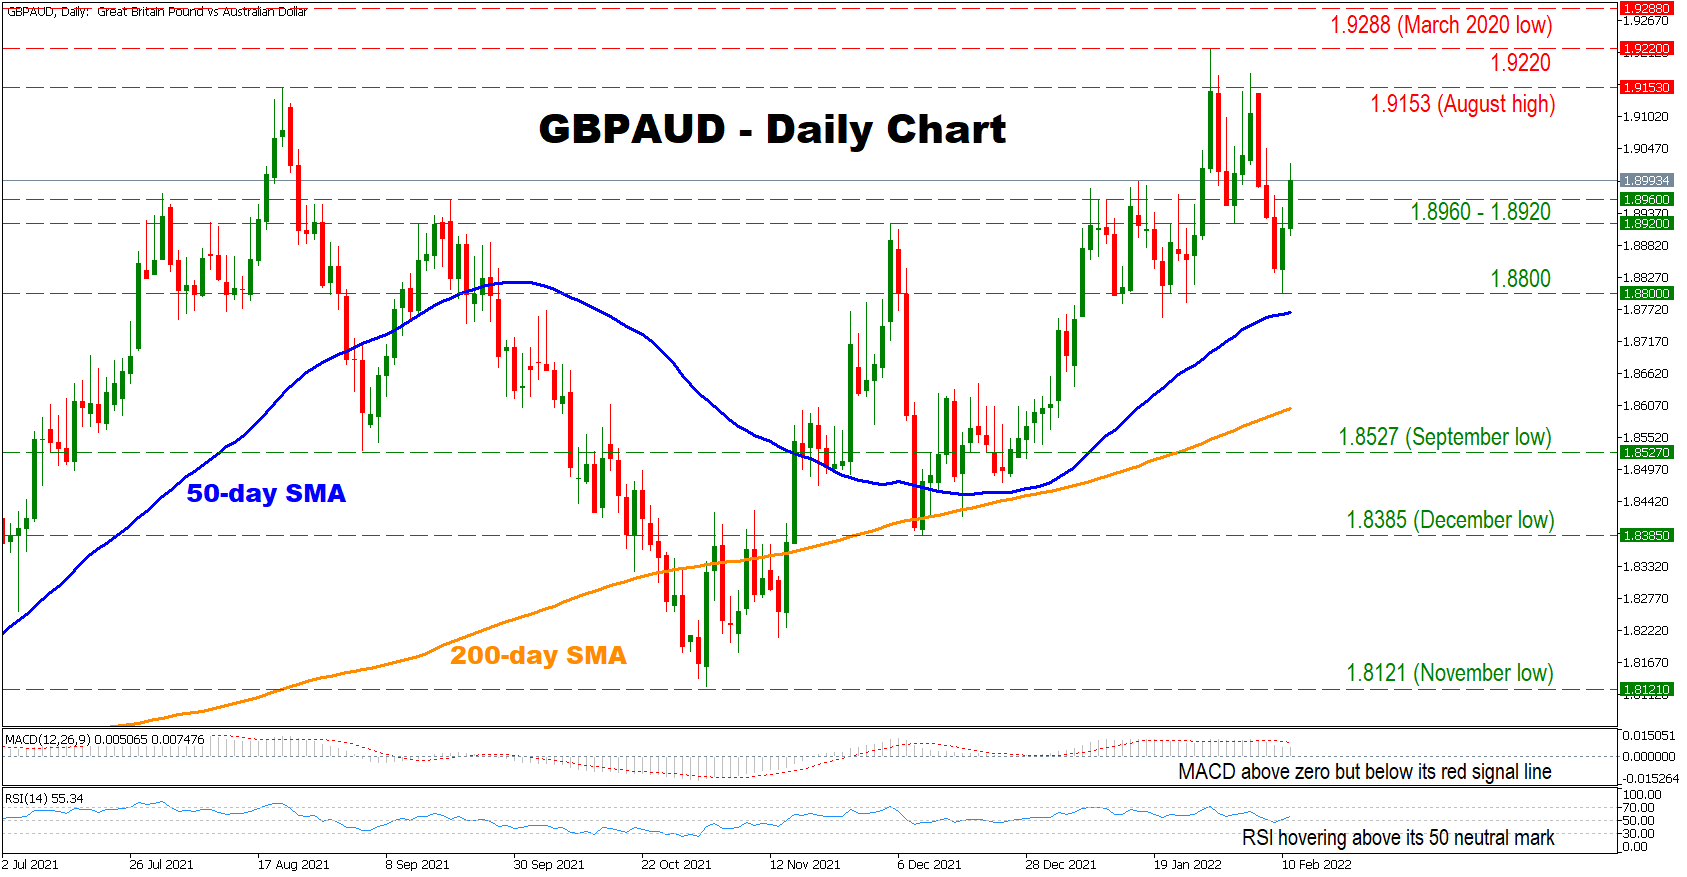
GBPAUD has marked yet more higher lows since early-November as positive forces linger. Moreover, the pair is trading above its 50- and 200-day simple moving averages (SMA), reinforcing its overall bullish outlook.
Short-term momentum indicators are reflecting a mixed picture as the RSI is hovering above its 50 neutral mark. However, despite being above zero, the MACD is found below its red signal line, which indicates that positive momentum might be fading.
Should the bulls maintain control, the August high at 1.9153 might be the first line of resistance, before buyers shift their attention towards the 1.9220 hurdle. Crossing above the latter could strengthen the pair’s positive momentum, sending its price to test the March 2020 low at 1.9288.
On the flip side, initial support might be found at the congested region which includes the 1.8960 and 1.8920 obstacles, before sellers eye the area which includes the 1.8800 barrier and the 50-day SMA currently at 1.8770. Crossing below the latter open the door towards the 200-day SMA currently at 1.8600. A break below this point could turn the fortunes around for the pair, sending the price to test consecutively the 1.8527 and 1.8385 hurdles.
In brief, the overall outlook for the pair remains bullish. For sentiment to change, sellers would need to break below the 200-day SMA.