

Sample Category Title
GBPAUD Bullish Sequence Favors More Upside
GBPAUD has found bid due to the divergence in the monetary policy between RBA and BOE. Bank of England (BOE) this year has hiked interest rate twice to fight against inflation. However, BOE indicates that it may still need to hike a few more times this year before it stops. This should take interest rates closer to 1% or even higher. Meanwhile, Reserve Bank of Australia (RBA) does not sound as hawkish as the other central banks. In the last monetary policy statement, the RBA has emphasized that the growth in workers’ wage is significant in the UK and US. RBA has judged that wage growth of three percent or more will be necessary to deliver the bank’s inflation target of 2.5%. In other words, RBA is not in a rush to raise the rate despite the current underlying inflation at the top of their target.
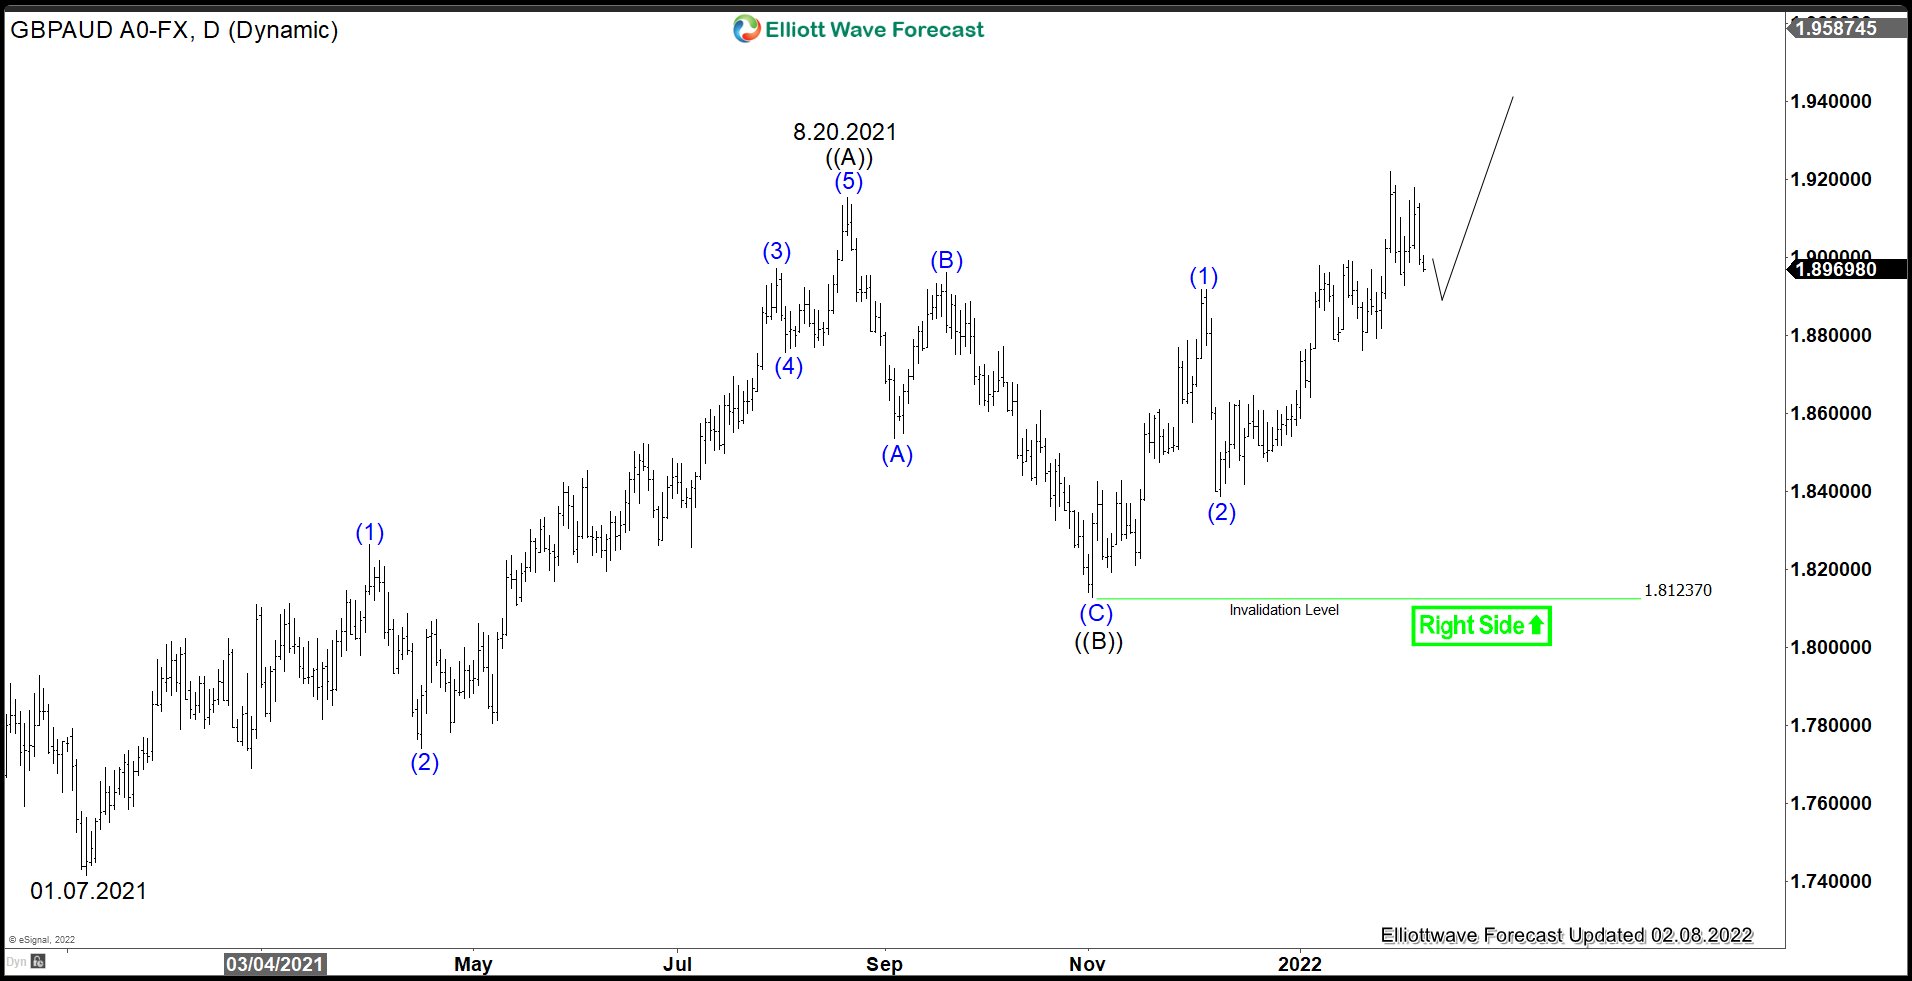
GBPAUD Daily Elliott Wave Chart
GBPAUD has broken above 08.20.2021 high (1.9154) and now the pair shows a higher high bullish sequence from December 11, 2020 low. The pair has potential target higher which can be calculated as 100% – 161.8% Fibonacci Extension from December 2020 low at 1.987 – 2.095. Near term pullback should find support in the sequence of 3, 7, or 11 swing for further upside as far as pivot at 1.8123 low stays intact.
ECB de Cos: Uncertainty around inflation very high due to geopolitical risks
ECB Governing Council member Pablo Hernandez de Cos said "risks to inflation are tilted to the upside in the short term." Recent data on Recent data on inflation has shown surprising upwards trends both in headline inflation and core inflation. He added, that the level of uncertainty around inflation is very high also due to geopolitical risks.
De Cos emphasized that more than ever it is necessary to keep all options open on monetary policy. But for now, ECB policymakers are sticking to the sequencing, starting first with tapering, before raising interest rate.
He added, that the next move on monetary policy is clear but will be gradual and depend on data.
GBPUSD Sends Bearish Vibes Below 20-SMA
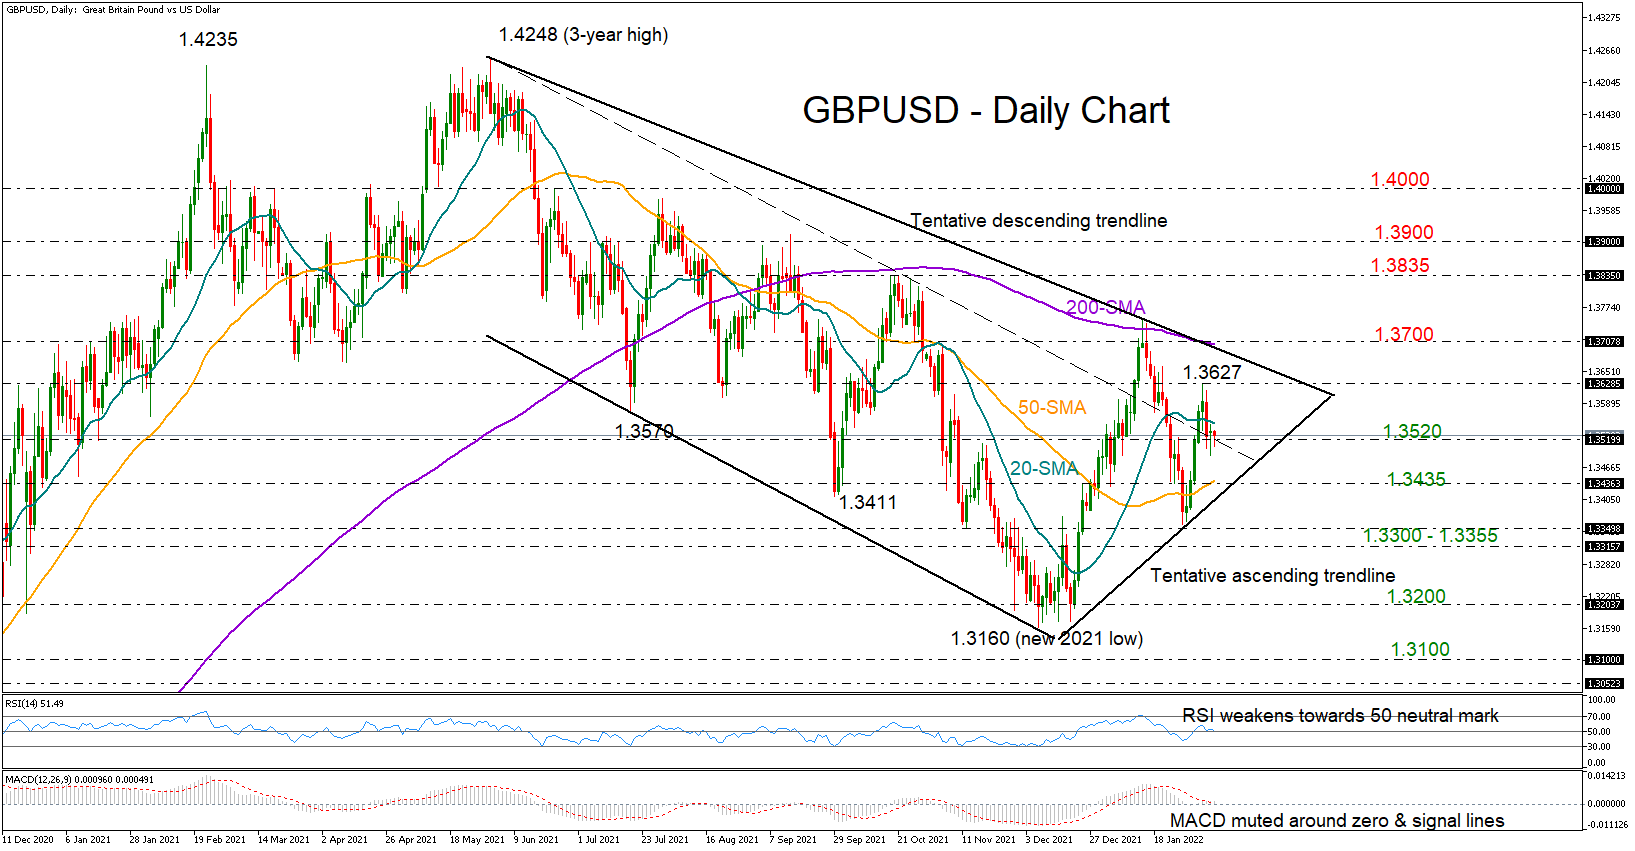
GBPUSD saw its bullish efforts evaporate near its 20-day simple moving average (SMA) on Monday, with the pair finishing the day muted and beneath last week’s peak of 1.3627 once again.
The above suggests the bears are still in charge and a downside correction below the nearby support of 1.3520 and towards the tentative ascending trendline and the 50-day SMA both at 1.3436 is still very likely. The negative slope in the RSI and the MACD, which are currently near their neutral levels, is also reflecting a weakening bias.
Should the upward-sloping trendline give way, the support region of 1.3300 – 1.3355 could immediately attempt to defend the short-term upleg off 1.3160. Failure to bounce here could trigger a sharper decline towards the 1.3200 number, while a close below the 2021 trough of 1.3160 may log a new lower low around the 1.3100 psychological mark.
In the event the bulls retake control above the 20-day SMA currently at 1.3549, driving the price above the latest peak of 1.3627 as well, a tougher battle could commence around the tentative resistance trendline and the 200-day SMA at 1.3700. A successful violation at this point would ruin the bearish trajectory in the medium-term picture, bolstering buying orders likely straight up to the 1.3835 and 1.3900 constraints.
In brief, GBPUSD is looking to be at a disadvantageous position in the short-term picture despite last week’s rebound, remaining exposed to additional declines towards 1.3435.
WTI Futures Bullish But Directional Forces Evaporate
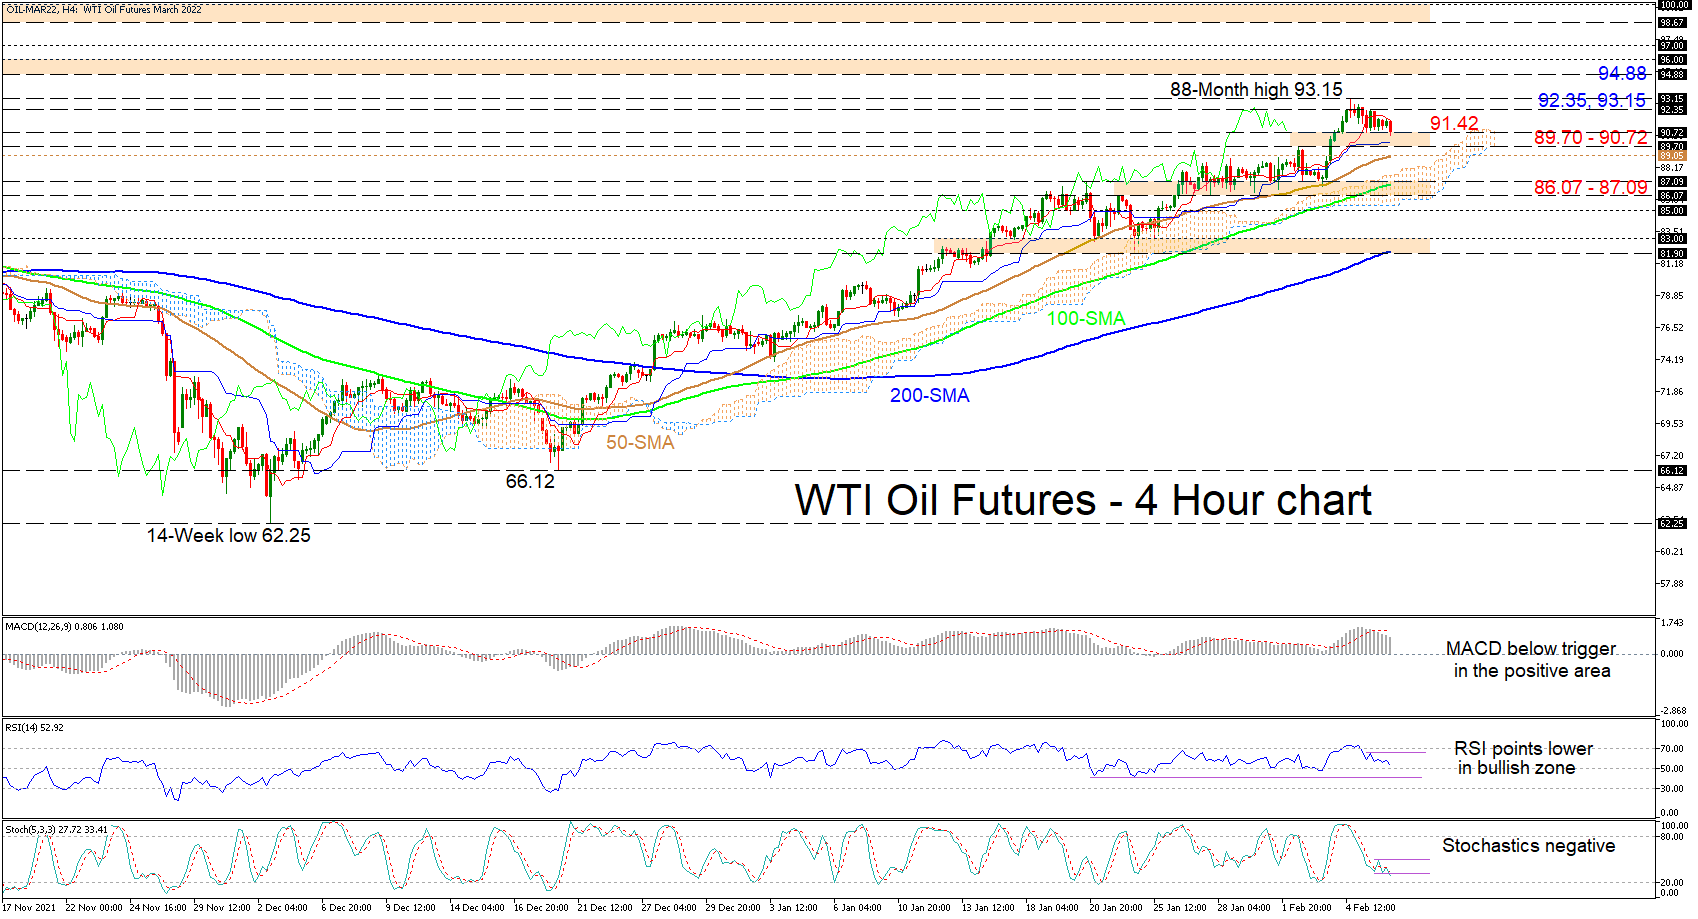
WTI oil futures have stabilized, tiptoeing across the 89.70-90.72 support barrier after a pullback from the near 7½-year high of 93.15. The soaring simple moving averages (SMAs) are safeguarding the broader positive structure despite the minor retreat in the price of the black liquid.
The Ichimoku lines suggest guiding forces have fairly dried up, while the short-term oscillators are reflecting a slight weakening in the positive momentum. The MACD, some distance above zero, is fading below its red trigger line, while the falling RSI is nearing the 50 neutral threshold. The revived negative charge of the stochastic oscillator is promoting downside moves in the commodity.
In the negative scenario, downside limitations could come from the immediate 89.70-90.72 barrier, encompassing the flattening blue Kijun-sen line. Approaching from beneath this obstacle is the 50-period SMA at 89.05, which may try to provide footing for buyers to capitalize on. However, if a deeper price retracement unfolds, the Ichimoku cloud could operate as a tough support zone as it surrounds the 86.07-87.09 border, which is fortified by the 100-period SMA. Successfully driving the price lower, sellers may then attempt to accelerate negative moves with a break of the 85.00 handle.
Alternatively, if buyers find some traction from the 89.70-90.72 instant support, they could meet preliminary upside friction from the red Tenkan-sen line at 91.42 ahead of the 92.35 and 93.15 nearby highs, the latter being the more than 7-year high. Reviving the one-and-a-half-month rally from the 66.12 level, the bulls may then target the 94.88-96.00 resistance band formed by the September and August 2014 highs. Overstepping this, the 97.00 hurdle could then impede advances from gaining pace.
Summarizing, WTI oil futures are exhibiting a bullish bias above the 89.70-90.72 support and the climbing SMAs. That said, for negative tendencies to significantly gain strength, the price would need to glide below the cloud, which encapsulates the 86.07-87.09 upside defence.
EURJPY Battles with 131.60, Below Falling Trend Line
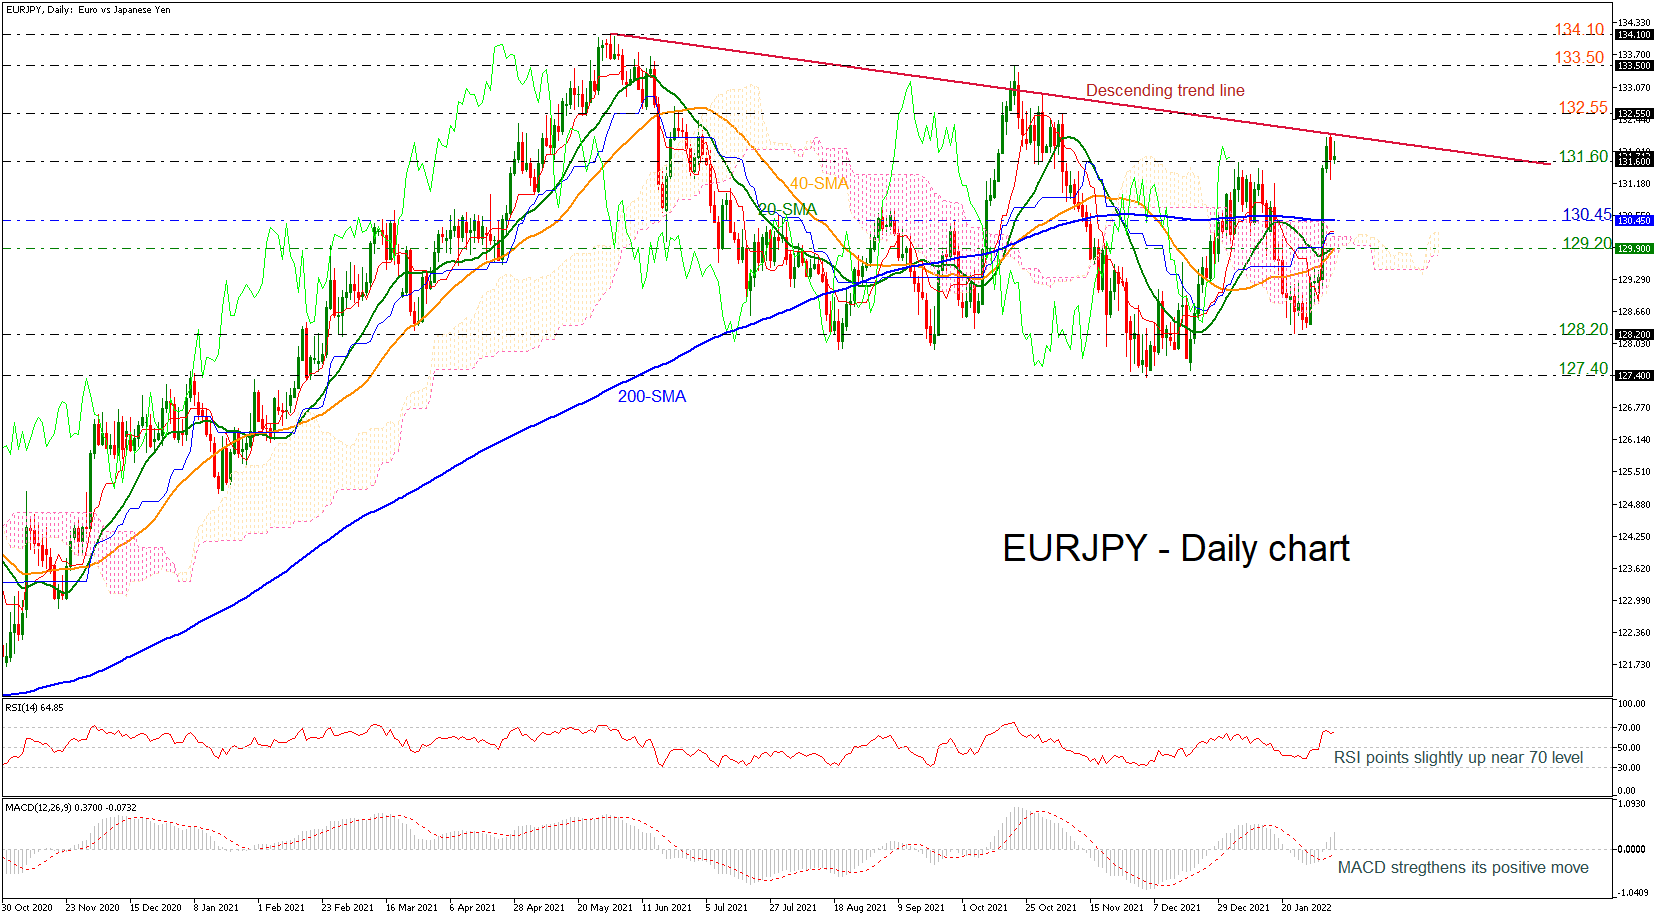
EURJPY has been in a battle with the 131.60 support level over the last couple of sessions, holding below the long-term descending trend line. It is worth to mention that the price remains well above the 200-day simple moving average (SMA) as well as above the short-term SMAs, which are ready for a bullish crossover.
From a technical perspective, the RSI indicator is standing slightly below the overbought region with weak momentum, while the MACD is stretching the bullish movement above its trigger and zero lines.
Should the trendline at 132.10 crack, the price could initially test the 132.55 barrier before heading towards the 133.50 and 134.10 resistance levels.
In the negative scenario where the price snaps the 131.60 barrier and closes below it the next target would be the flat 200-day SMA at 130.45. Falling lower, the bears bulls will need to drive lower to the 20- and 40-day SMAs at 129.20 ahead the low of 128.20 and 127.40.
In brief, despite its resilience above 131.60, EURJPY needs to show clear bullish signals above the falling trend to shift the outlook to positive. If the diagonal line approves a pullback lower, then the broader picture will remain negative.
Daily Technical Analysis
EUR/USD
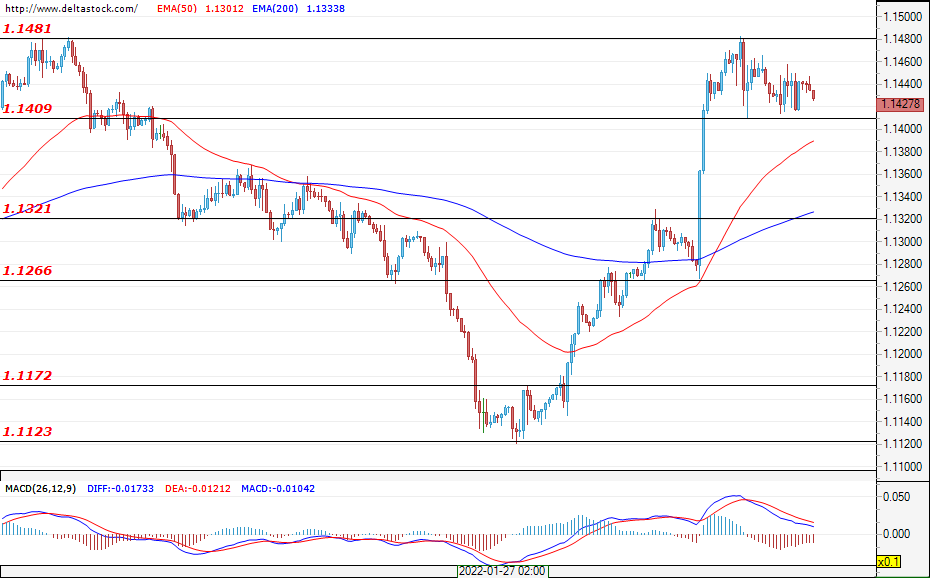
The first trading day of the week passed calmly and the pair entered a corrective phase after reaching the resistance at 1.1480. The onset of the bears around this level seems hesitant and is currently limited by the local support at around 1.1410. Such a shallow pullback suggests that the bulls are still in position and that a new strong rally can be expected. If prices remain above 1.1410, then a breach of the resistance at 1.1480 can be expected, and a possible next target for the movement may be the zone of 1.1580 – 1.1600. In case the local support is breached, the next zone that would support the bulls is 1.1320, followed by the impulse’s starting point at 1.1266.
USD/JPY
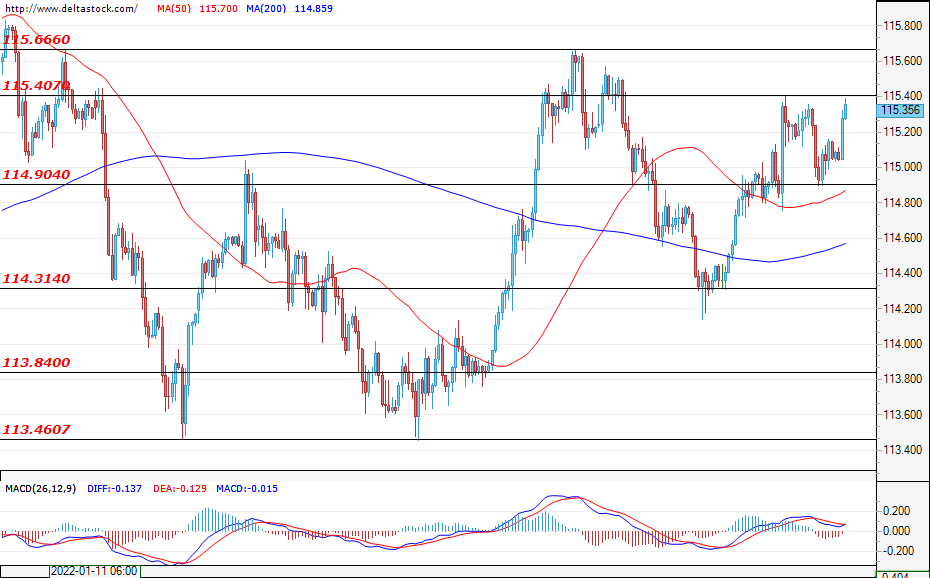
The dollar fell slightly against the yen on Monday, but in the early hours of today, all losses have been recovered. The bulls found support at around 114.90, and at the time of writing, prices are testing the resistance at 115.40. This zone is expected to be overtaken and the rally is to continue towards 115.66 and 116.00. On the higher time frames, the sentiment seems mixed and it is likely that, in the next few days, the pair will be trading in a range between 114.30 and 116.00. The first daily support remains at 114.90.
GBP/USD
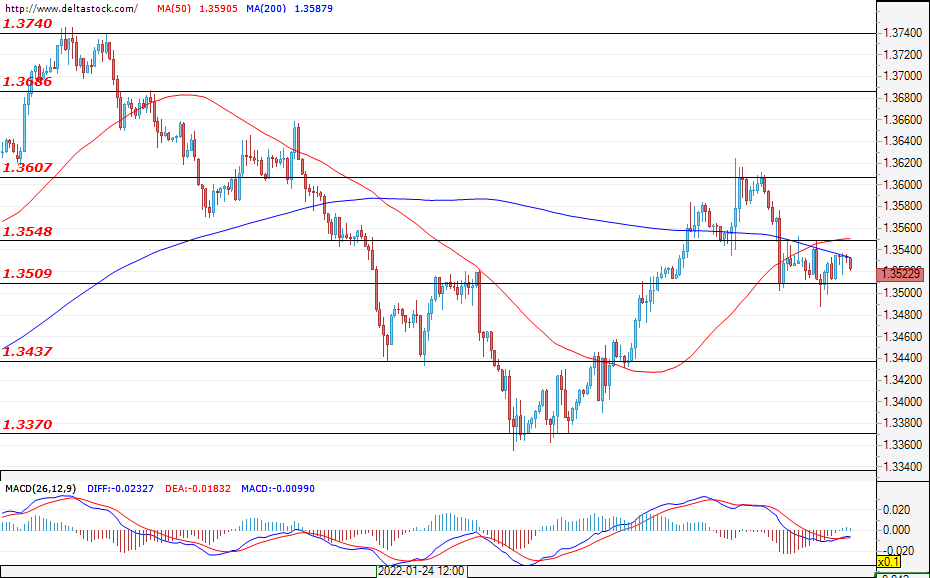
The Cable ended the day without significant change and prices remained above the support at around 1.3510. This area remains the first daily support. The first resistance for the bulls is 1.3548, followed by 1.3607. Volatility is expected to shrink and the market is likely to consolidate between the 1.3510 support and the 1.3607 resistance. Expectations remain mixed and a breach of either zone would signal for the market’s future intentions.
EUGERMANY40
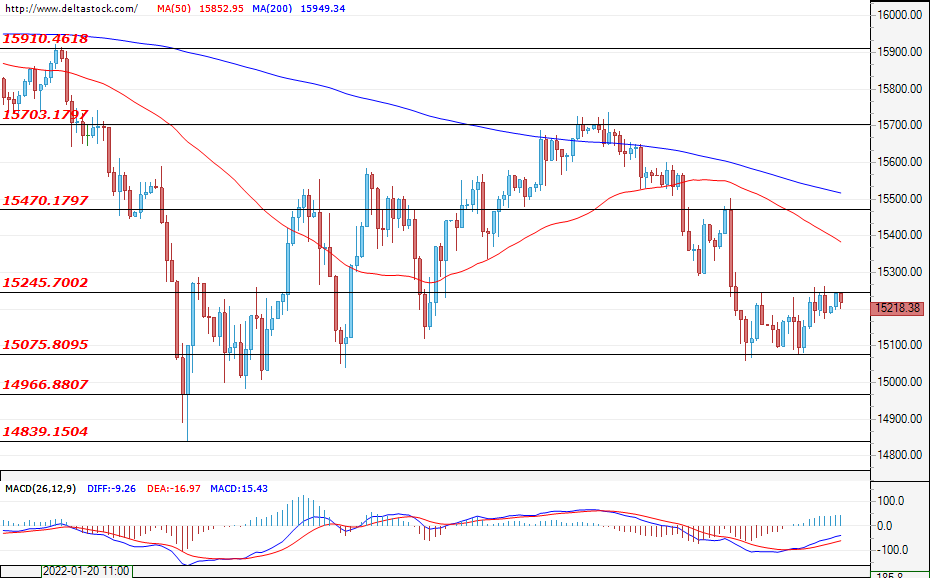
The German index is struggling around the resistance at 15245, and in the last two sessions, prices have been jumping back and forth between this zone and the support at 15075. The expectations are positive – for a breach of 15245, with the market also possibly forming a new resistance at around 15340. The possibility for a new test of the lows at around 14960 or at 14840 is still on the table. Even in such a scenario, however, the expectations for a rally are still intact. The main weekly support for the index is found at around 14807 and this area could prove to be of great interest for the bulls. When the bulls return to the market, their targets could be 15470 and 15700. Serious bearish scenarios at the moment can be expected only if 14807 is breached.
US30
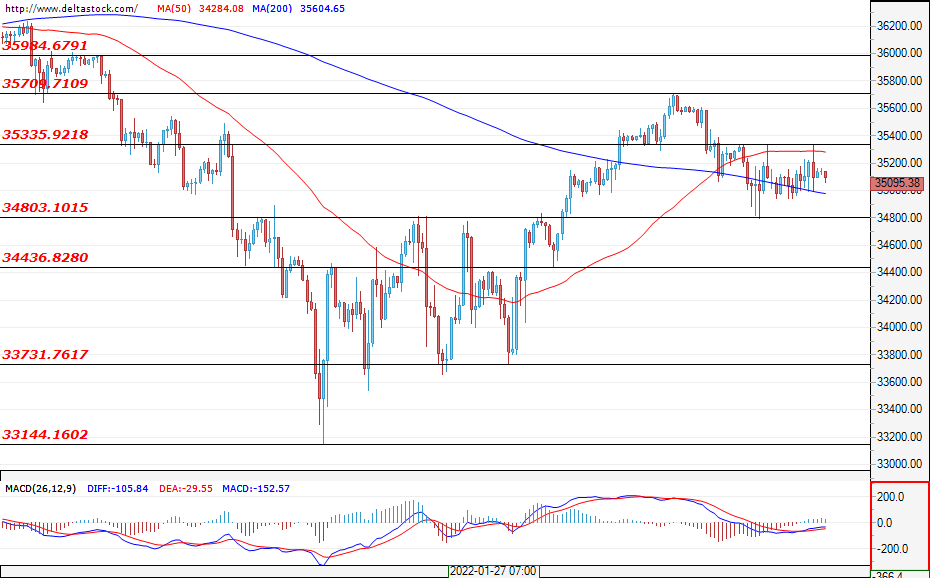
The U.S. blue chips are performing better than their European counterparts and prices are currently hovering over the breach of the structure above 34800. This is also the main daily support level. Yesterday, the US30 failed to find a clear direction and the price action confirmed the resistance at 35335. Expectations remain positive, at least until the support at 34800 is breached. This would worsen the overall market sentiment, with further supports for the index being the levels at 34436 and at 33730. A breach of the resistance at 35335 would allow for a new test of the high at 35709. Although the markets have stabilised, profits are still fragile and any negative events could easily lead to a new test of the lows at around 33730.
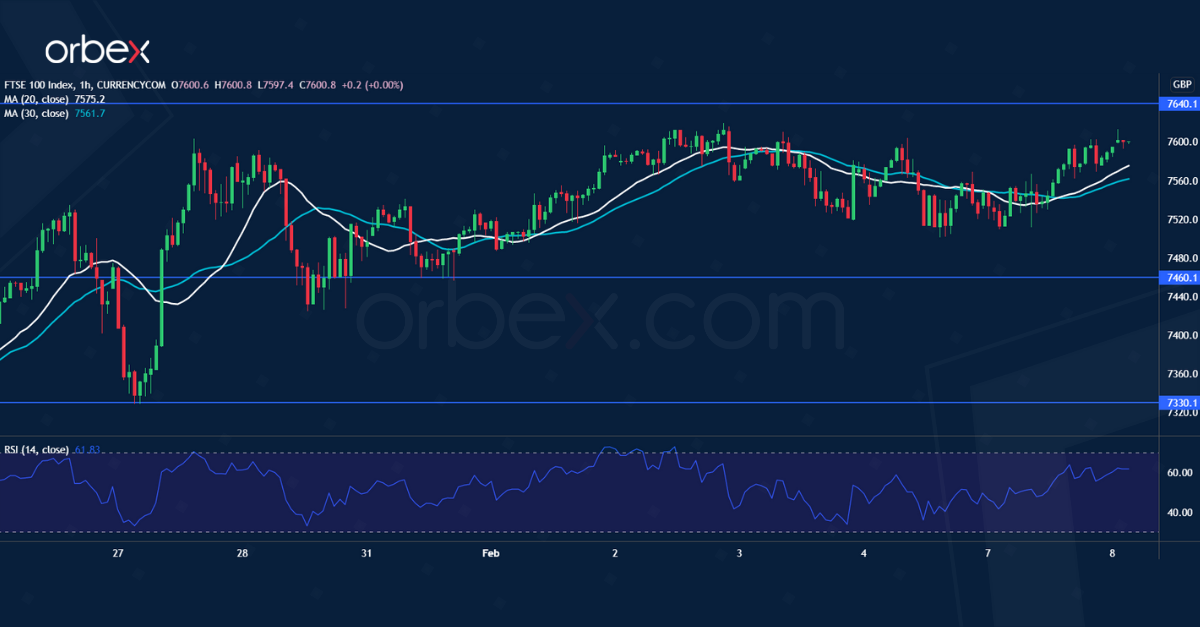
FTSE 100 Awaits Breakout
The FTSE 100 rallies supported by solid performance in the commodity sector.
The recent rebound hit resistance near the January peak at 7640. Narrowing consolidation and higher highs suggest increased buying pressure.
A bullish breakout would flush sellers out and attract momentum traders, firing up volatility in the process. This would be a strong bullish continuation signal.
7460 is fresh support if the market remains indecisive. Its breach could extend the correction back to 7250.
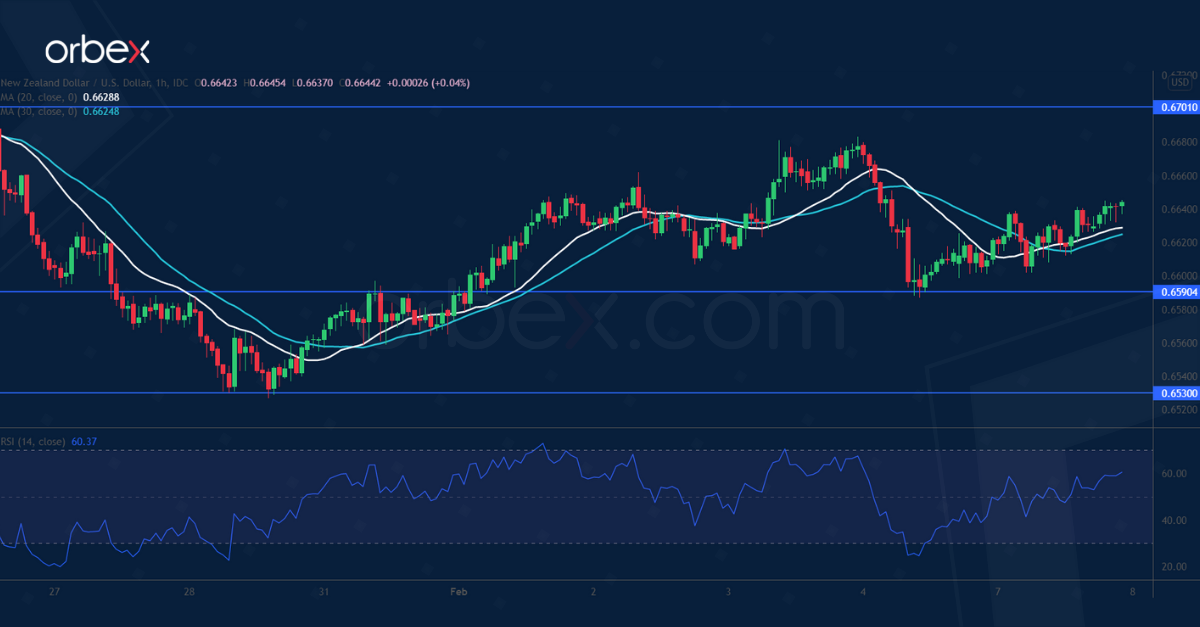
NZD/USD Remains Under pressure
The New Zealand dollar edges lower amid cautious market sentiment at the start of the week. The pair previously bounced off September 2020’s low around 0.6530.
However, 0.6700 on the 20-day moving average so far has proven to be a tough hurdle. A drop below the fresh support (0.6630) indicates that the directional bias remains bearish. And sellers would be eager to fade another rebound.
0.6590 is the closest support. A break below 0.6530 could trigger a new round of sell-off towards 0.6400.
 P
P
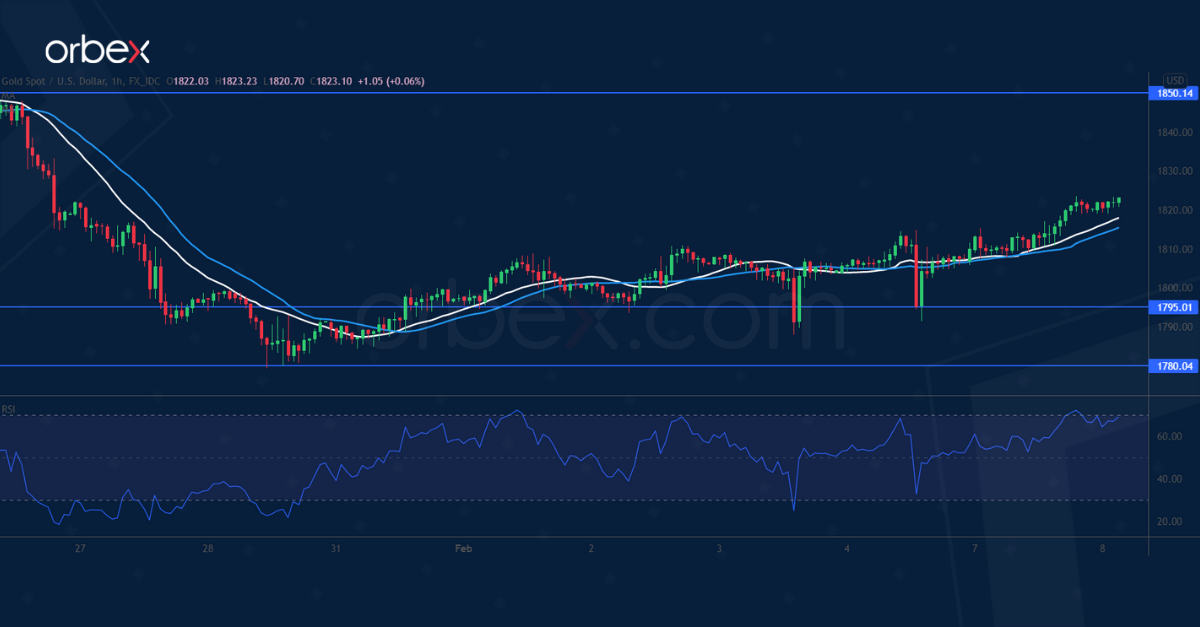
XAU/USD Breaks Resistance
Gold continues to recover as the US dollar treads water.
The previous fall below the daily support at 1785 had put the bulls on the defensive. The RSI’s oversold signal attracted some buying interest and prompted sellers to cover, driving up the price.
The rebound has since gained traction after the metal rallied above the support-turned-resistance at 1817. In fact, the bullish breakout may raise momentum and open the door to the recent peak at 1850.
On the downside, 1795 is a major support to keep buyers committed.
Euro Lost Some Post-ECB Momentum
Markets
In a session with few important data, the bond market sell-off slowed yesterday. However, the yield upleg triggered last week as ECB’s Chair Lagarde opened the door for a policy reassessment in March and a subsequent strong US payrolls report remained firmly in place. This isn’t a correction yet. Except for a limited setback at the short end of the (European) yield curve, US and European yields stabilized, at best. The decline in short-term (EMU) yields occurred as ECB’s Lagarde before the European Parliament indicated that an ECB policy adjustment will be gradual as the ECB will carefully assess the implications of incoming data for the medium term outlook.
The German yield curve steepened with the 2-year yield declining 3.9 bps while the 10 & 30 y still rose a further 2.3/3.8 bps. Intra-EMU spreads versus Germany also continue their widening tends as investors ponder the potential impact of higher core yields and the ECB reducing APP bond buying sooner than expected. Moves in US yields were limited between -2 bps (2-y) and +0.7 bps for 10y & 30y.
European and US equities showed a slightly different picture. The EuroStoxx50 closed with gains of 0.83%. US indices failed to maintain limited opening gains with Nasdaq again losing 0.58%.
On the FX market, the euro lost some of its post-ECB momentum. The 1.1483 resistance apparently is a too high hurdle for now. The pair closed marginally lower at 1.1442. At the same time, the TW dollar (DXY) also showed no clear trend (close 95.40 from 95.49). The yen slightly outperformed (USD/JPY close 115.10). The pause in the broader euro rebound was also visible in EUR/GBP (close 0.8453).
This morning, Asian markets show a mixed picture with China underperforming. Japanese and Australian markets are trading in positive territory even as local bond markets are ever more affected by the global interest rate repositioning.
At 0.21%, the Japanese 10-y yield is touching highest levels since 2016 and reaching top of the preferred range of the BoJ (0.0% +/- 25 bps). The Australian 10-y yield this morning also tested the cycle top near 2.12/13% as markets prepare for RBA interest rate normalization later this year. For now, gains of the Aussie dollar are limited (AUD/USD 0.7125).
Later today, the eco calendar is again only modestly interesting. US NFIB small business confidence and trade balance data are no market movers. Speeches from ECB’s de Cos and Villeroy might give some insight on how the debate on inflation and policy evolves within the ECB. Despite yesterday’s comments from ECB ‘s Lagarde on a gradually policy, established bond market trends remain firmly in place. The US 10-y yield (1.945%) is nearing the 2.0% barrier. We look out for investor interest as the US treasury today sells 3-year bonds.
On FX markets, the post-ECB euro repositioning is taking a breather after the rejected test of 1.1483. We assume that the downside in the single currency has become better protected. EUR/USD drifting back below the 1.1386/1.1335 area (previous range top/uptrend line) would be disappointing for euro bulls. In a similar move as EUR/USD, EUR/GBP is easing off the 0.8475 area with first support near 0.8423.
News Headlines
The US and Japan agreed to remove Trump-era steel tariffs that were in place since 2018. The 25% American levy on Japanese steel will be suspended up to 1.25 million metric tons per year from April 1 on. Japan is the fifth-largest metal exporter to the US. In 2017, the year before the tariffs were put in place, the US imported 1.7 million metric tons before falling to 1.1m tons by 2019. The agreement follows a similar deal between the US and the EU in October.
Poland’s finance minister Koscinski resigned over flaws in the country’s tax system overhaul, dubbed the Polish New Deal, that took effect at the beginning of this year. The spending pledges and tax changes were meant to benefit the lower and middle earners but instead left some with lower salaries in January. Stopgap measures to sort out the issue only created more confusion. PM Morawiecki would take over Koscinski’s responsibilities until a replacement is chosen. The plan also draws criticism for potentially spurring inflation at a time it is already running at a two-decade high (8.6% in December). Poland’s central bank (NBP) started raising rates in October last year in a response, bringing it from 0.10% to 2.25%. The NBP is expected to hike again later today with a minimum of 50 bps.