Sample Category Title
GBP/JPY Daily Outlook
Daily Pivots: (S1) 155.19; (P) 155.75; (R1) 156.34; More...
GBP/JPY is staying inc consolidation from 156.48 temporary top. Intraday bias remains neutral for the moment. The consolidation pattern from 158.19 could still extend further. On the downside, below 154.46 minor support will turn bias back to the downside for 152.88 support and below. Nevertheless, above 156.48 will target a test on 157.74/158.19 resistance zone. Decisive break there will resume larger up trend.
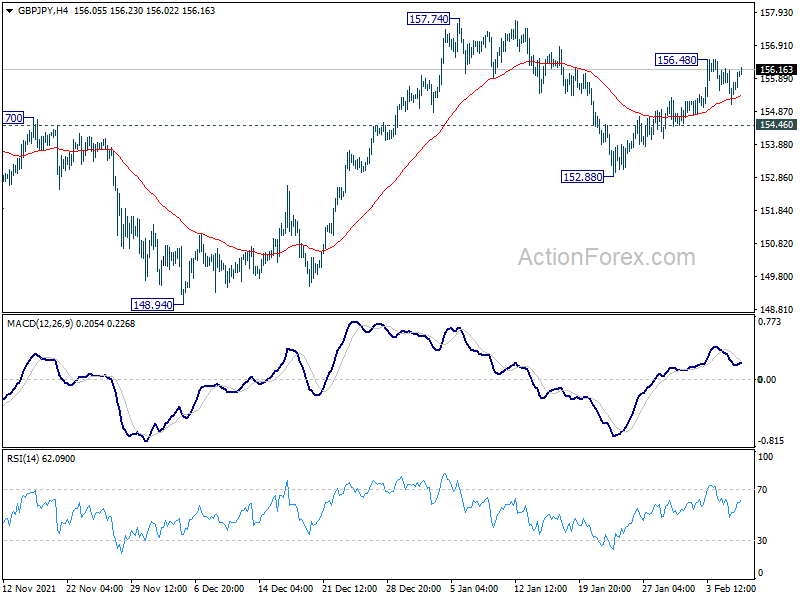
In the bigger picture, price actions from 158.19 are seen as developing into a consolidation pattern to up trend from 123.94 (2020 low). Downside should be contained by 123.94 to 158.19 at 145.10 to bring rebound. Firm break of 158.19 will resume the up trend to long term fibonacci level at 167.93. However, sustained break of 145.10 will raise the chance of trend reversal and target 61.8% retracement at 137.02.

EUR/JPY Daily Outlook
Daily Pivots: (S1) 131.22; (P) 131.71; (R1) 132.16; More....
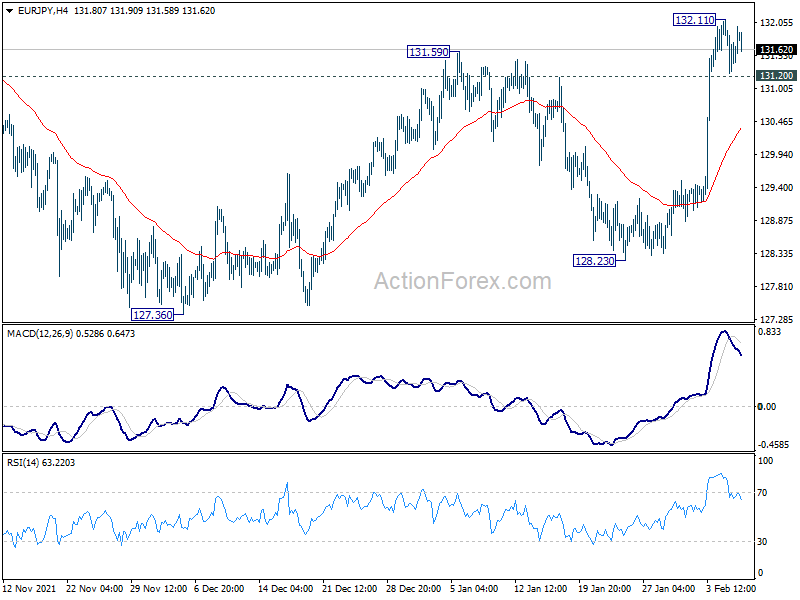
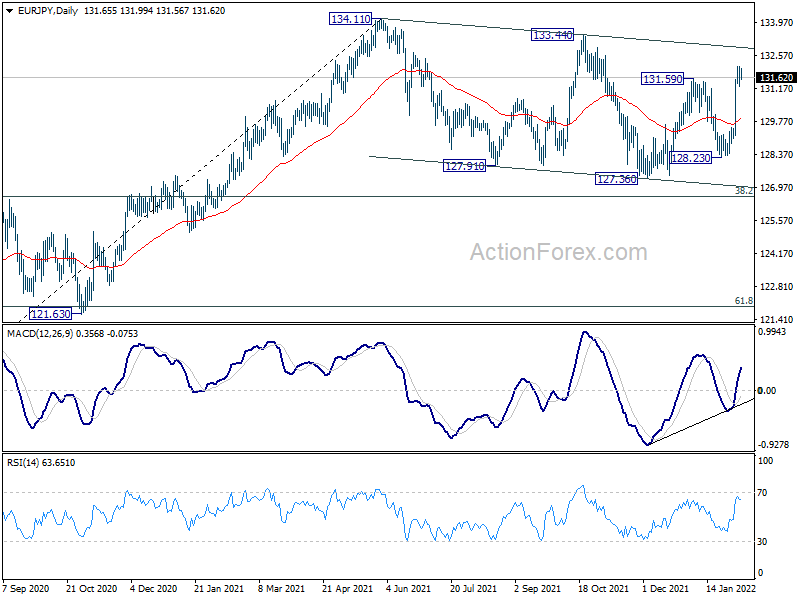
Intraday bias in EUR/JPY is turned neutral with a temporary top formed at 132.11. Some consolidations could be seen first. But downside should be contained well above 128.23 support to bring another rally. As noted before, corrective pattern from 134.11 should have completed three waves down to 127.36. Above 132.11 will bring retest of 133.44/134.11 resistance zone. Decisive break there will resume larger up trend from 114.42.
In the bigger picture, price actions from 134.11 are currently seen as a consolidation pattern only. As long as 38.2% retracement of 114.42 (2020 low) to 134.11 at 126.58 holds, up trend from 114.42 is still in favor to continue. Break of 134.11 will target long term resistance at 137.49 (2018 high). However, sustained break of 126.58 will raise the chance of bearish reversal. In this case, deeper decline would be seen to 61.8% retracement at 121.94, and possibly below.
EUR/GBP Daily Outlook
Daily Pivots: (S1) 0.435; (P) 0.8456; (R1) 0.8474; More...
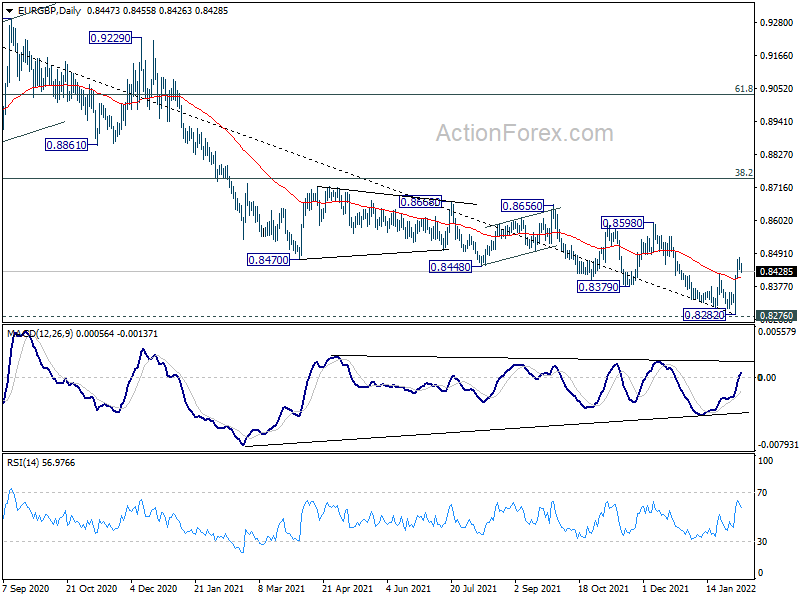
Intraday bias in EUR/GBP is turned neutral with current retreat. Some consolidations should be seen before another rally. On the upside, break of 0.8476 will resume the rebound from 0.8282 to 0.8598 resistance. Decisive break there will add to the case of trend reversal and target 38.2% retracement of 0.9499 to 0.8282 at 0.8747 next.

In the bigger picture, price actions from 0.9499 (2020 high) are still see a corrective pattern that should be contained by 0.8276 long term support (2019 low). Bullish convergence condition in daily MACD and break of 55 day EMA raises the chance that it might be completed. Sustained trading above 38.2% retracement of 0.9499 to 0.8282 at 0.8747 will affirm this bullish case and target 61.8% retracement at 0.9034 and above.
EUR/AUD Daily Outlook
Daily Pivots: (S1) 1.6003; (P) 1.6101; (R1) 1.6159; More...
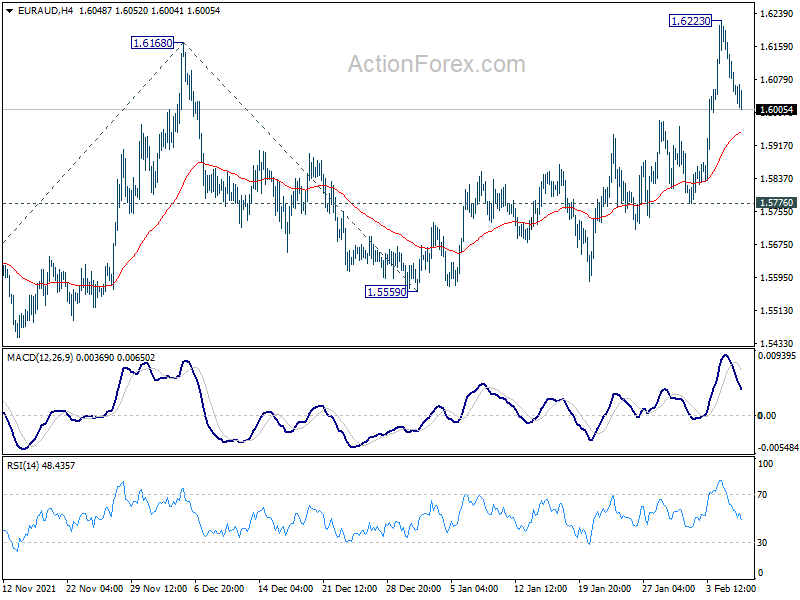
Intraday bias in EUR/AUD is turned neutral with current retreat. Further rally will remain in favor as long as 1.5776 support holds. Above 1.6223 will resume whole rise from 1.5354 to 100% projection of 1.5354 to 1.6168 from 1.5559 at 1.6373 next. However, break of 1.5776 will turn bias back to the downside for 1.5559 support instead.
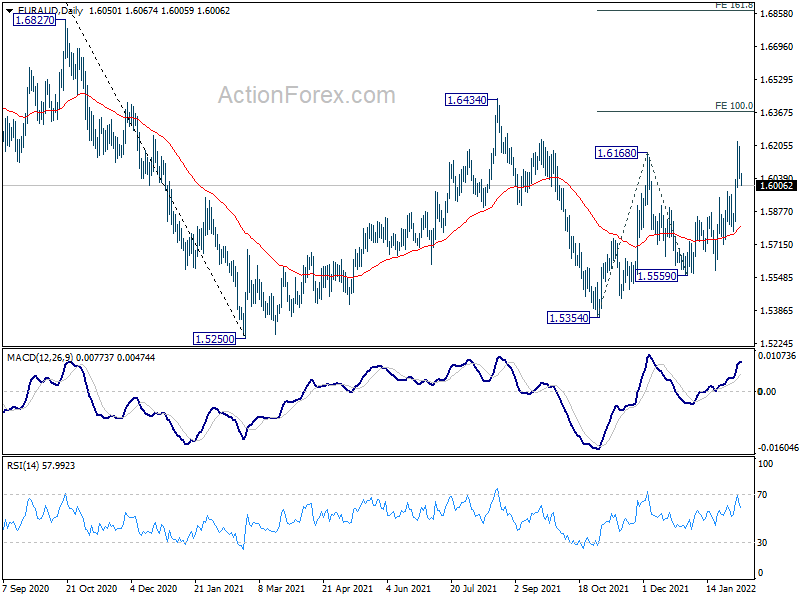
In the bigger picture, rise from 1.5354 is seen as the third leg of the corrective pattern from 1.5250 low. Further rise cannot be ruled out, but even in that case, strong resistance should be seen at 38.2% retracement of 1.9799 to 1.5250 at 1.6988. Larger down trend from 1.9799 is in favor to extend through 1.5250 at a later stage.
EUR/CHF Daily Outlook
Daily Pivots: (S1) 1.0540; (P) 1.0576; (R1) 1.0600; More....
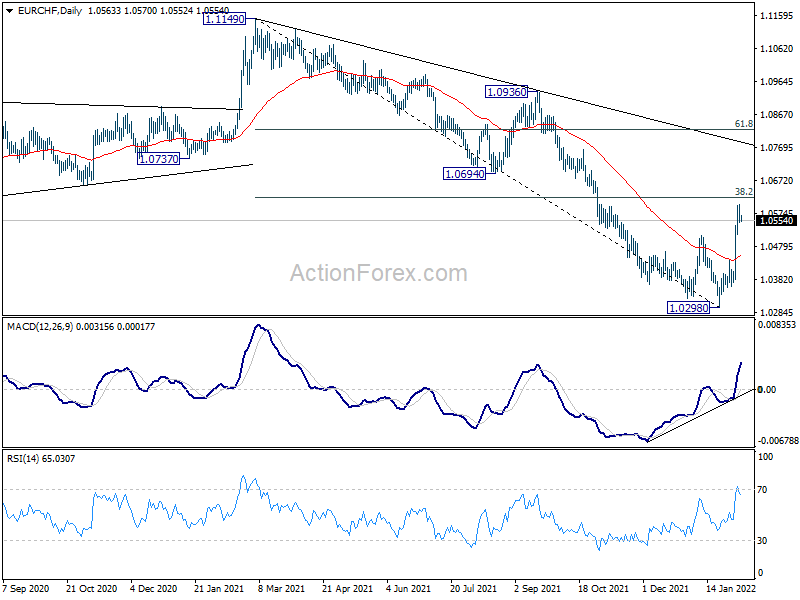
Intraday bias in EUR/CHF is turned neutral with current retreat and some consolidations would be seen. But further rally is expected as long as 1.0439 support holds. A medium term bottom should be in place at 1.0298 already. Above 1.0602 will target 28.2% retracement of 1.1149 to 1.0298 at 1.0623 first. Sustained trading above there will raise the chance of trend reversal and target 61.8% retracement at 1.0824 next. However, break of 1.0439 will dampen this bullish view and bring retest of 1.0298 instead.
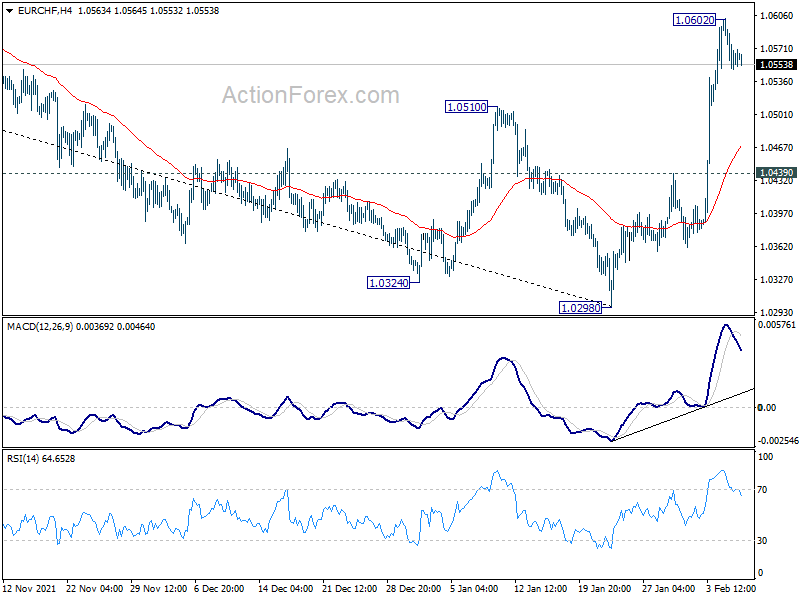
In the bigger picture, current development suggests that a medium term bottom is formed at 1.0298 on bullish convergence condition in daily MACD. Rebound from there is still tentatively viewed part of a corrective pattern. That is, larger down trend from 1.2004 (2018) could still extend through 1.0298 to 61.8% projection of 1.2004 to 1.0505 to 1.1149 at 1.0223. However, sustained trading above 55 week EMA (now at 1.0673) will argue that the down trend is over, and bring stronger rise back to 1.1149 next.
Crude Oil Price Steady as Geopolitical Temperatures Rise
The price of crude oil is hovering near its highest level in more than 7 years as investors focus on top geographical issues. The biggest issue in the market is Russia and the West. On Sunday, the US warned that Russia was about 70% prepared to invade Ukraine. Officials warned that the invasion could happen at any time. This is an important issue because of the vast amount of oil that Russia ships every day. Another geopolitical event set to move oil prices is the talks between the US and Iran on nuclear weapons. The talks are aimed at preventing Iran from having nuclear weapons and are a response to the decision by Trump to exit the nuclear deal.
American equities tilted higher on Monday as investors reflected on the recent earnings season. According to FactSet, 56% companies in the FTSE index have already published their quarterly results. 76% of these companies published results that had a positive EPS surprise while 77% had a positive revenue surprise. The blended earnings growth rate was 29.2%. If the results are like that, it will mark the fourth straight quarter in which companies have grown by above 25%. More companies are set to publish their results this week including KKR, S&P Global, Fiserv, and Harley Davidson among others.
Cryptocurrency prices continued their comeback during the American and Asian sessions. Bitcoin price has jumped by more than 5% in the past 24 hours while Ethereum surged to more than $3,100. The total market cap of cryptocurrencies has risen back to more than $2 trillion. Analysts attribute this rally to the fact that sentiment in the market has improved substantially in the past few days. Indeed, most assets like stocks and commodities have rallied recently.
EURUSD
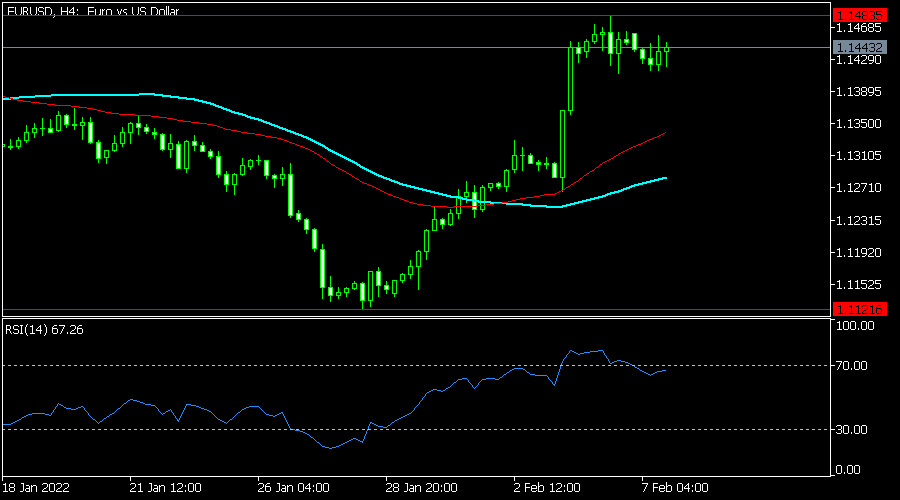
The EURUSD pair moved sideways as investors reflected on the recent Fed and ECB interest rate decisions. The pair is trading at 1.1435, which is slightly below last Friday’s high of 1.1483. It has formed what seems like a bullish pennant and cup and handle patterns. In most cases, these patterns are usually a sign of bullish continuation. Therefore, there is a likelihood that the pair will keep rising as bulls target the key resistance at 1.1500.
GBPUSD
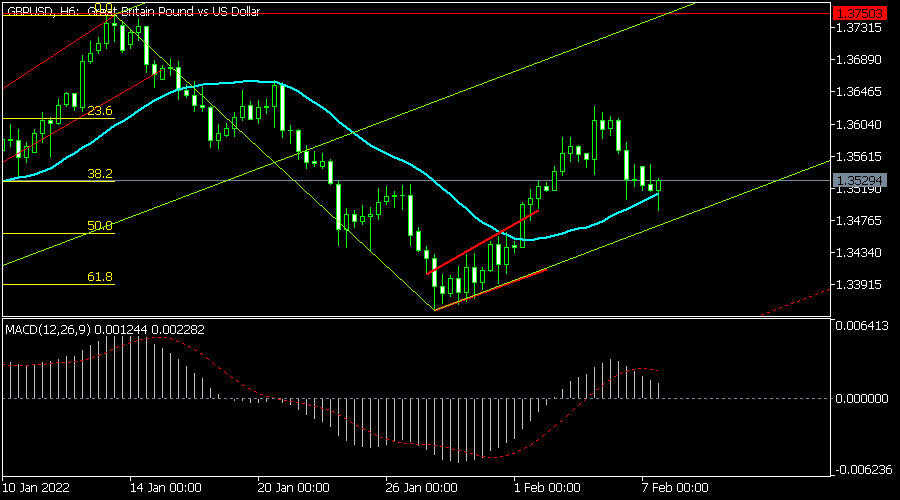
The GBPUSD pair retreated slightly in the overnight session. It is trading at 1.3527, which is slightly below last week’s high of 1.3625. On the six-hour chart, the pair is slightly above the first support of Andrew Pitchfork’s tool. It is also along the 38.2% Fibonacci retracement level and above the 25-day moving average level. Therefore, the pair will likely continue falling as bears target the key support at 1.3470.
EURCHF
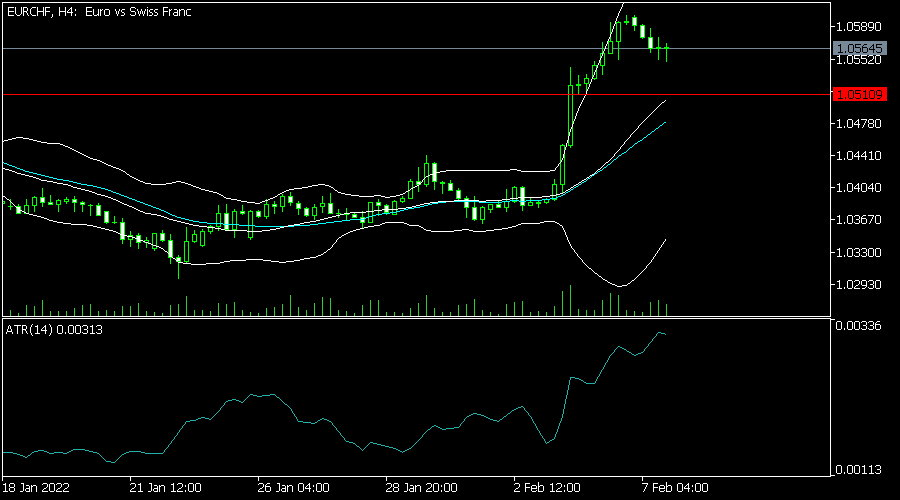
The EURCHF pair declined slightly as investors reflected on the strong Swiss unemployment rate data. The pair is trading at 1.0567, which was slightly below last week’s high of 1.0600. On the four-hour chart, it is between the middle and upper lines of the Bollinger Bands. It is also above the 25-day moving average while the Average True Range (ATR) has risen. Therefore, the pair will likely pullback for a while and then resume the bullish trend.
ECB’s Lagarde Repeats that “a Rate Hike Will Not Occur” Before QE Ends
Market movers today
Very quiet day on data front, only Swedish industrial production data from December due.
Two ECB speakers on the wires, Villeroy (neutral) and de Cos (dove). After last week's ECB meeting, the markets will pay close attention to any clues from policymakers on the pace of looming monetary policy tightening. Even the ECB's dovish camp seems to be preparing for rate hikes, as ECB's Rehn said last week that a rate hike will be appropriate next year at 'the latest'.
Also, we continue to keep a close eye on any headlines regarding the Russia-Ukraine standoff.
The 60 second overview
ECB: ECB President Lagarde told EU politicians that "There is a defined sequencing between the end of our net asset purchases and the lift-off date. A rate hike will not occur before our net asset purchases finish". Markets are pricing 28bp for September and 52 for December. September is aggressive compared to Lagarde's comments in the sense that it would require a fast end to QE bond buying. In general, investors are not really buying the "gradual tightening" narrative, as investors believe central banks are underestimating how high the underlying inflationary pressure is and we have seen something similar in the US and in the UK. In our view, the March ECB meeting will be crucial, as we receive new staff projections.
Nord Stream 2: At a joint news conference with German Chancellor Olaf Scholz, US President Joe Biden said "we will bring an end to it (Nord Stream 2)" if Russia invades Ukraine. Scholz added that "we are absolutely united". In relation to this, there was no breakthrough in talks between French President Macron and Russian President Putin.
Equities: Equities ended slightly lower yesterday, with Europe being the exemption. Intraday volatility came down but it remains to be seen whether this is a long lasting thing. This morning yields are posting a new pos- pandemic high and the forces behind the year to date turmoil in equities are still in play. Value defensive outperforming in US and one feel tempted to say of course together with Energy. Energy has outperformed tech by almost 30% this year. In the US, Dow unchanged, S&P500 -0.4%, Nasdaq -0.6% and Russell 2000 +0.5%. Asian markets are mixed this morning with Japanese stocks higher while Hong Kong is lower led by tech shares. US futures are slightly higher while European futures are slightly lower.
FI: It was a rather choppy session yesterday with two themes. The morning session continued to digest the post ECB meeting messages, namely intra euro area spread widening. Hawkish Knot's comments during the weekend, which were dovish relative to market pricing, of a rate hike in Q4 did not impact the front end pricing which still points to 51bp for Dec22. BTPs-Bund spread widened by 10bp to 165bp initially. However, the afternoon session reversed most of the widening in a constructive environment, also supported by some push-back from Lagarde on the rush to adjust monetary policy during the Q&A session in the EP yesterday, which left the BTPs-Bund spread just 1bp wider on the day. Lagarde made it very clear that there would be no rate hike before end of net APP purchases. The biggest underperformer of the day was Greece with its 10y point widening 20bp to Bunds.
FX: EUR reversed course versus rest of G10 currency space on Monday after the ECB induced rally last week on an otherwise quiet day in FX markets. AUD and CAD outperformed as commodity markets continue to hold up well.
Credit: While equities saw more positive sentiment yesterday, credit markets remained under pressure, with both CDS indices and cash bonds selling off. iTraxx Xover widened 7bp to 321.5bp and Main 1.6bp to 66.4bp. Meanwhile, cash bonds were under further pressure likely driven by sales pressure from credit ETFs. HY bonds widened 16bp and IG 4bp.
Technical Outlook and Review
DXY:
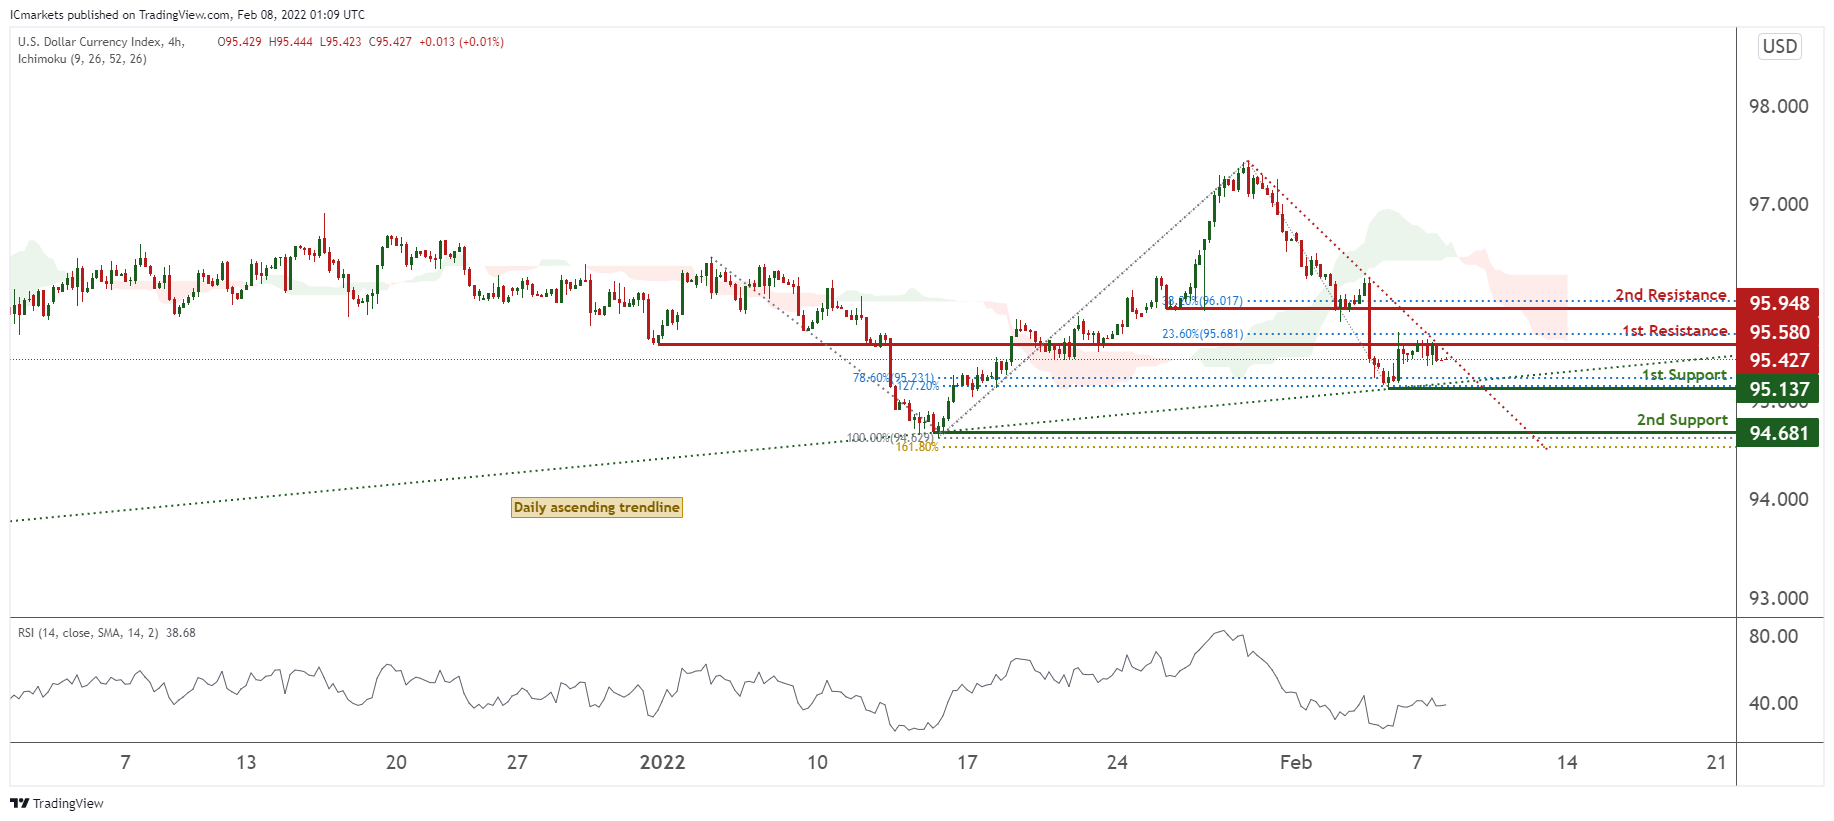
On the H4 timeframe, prices are on bearish momentum and abiding to our descending trendline. We see the potential for a dip from our 1st resistance at 95.580 in line with 23.6% Fibonacci retracement and graphical overlap towards our 1st support at 95.216 in line with 78.6% Fibonacci retracement. RSI and Ichimoku clouds are also showing bearish momentum.
Areas of consideration:
- H4 time frame, 1st resistance at 95.580
- H4 time frame, 1st support at 95.137
XAU/USD (GOLD):
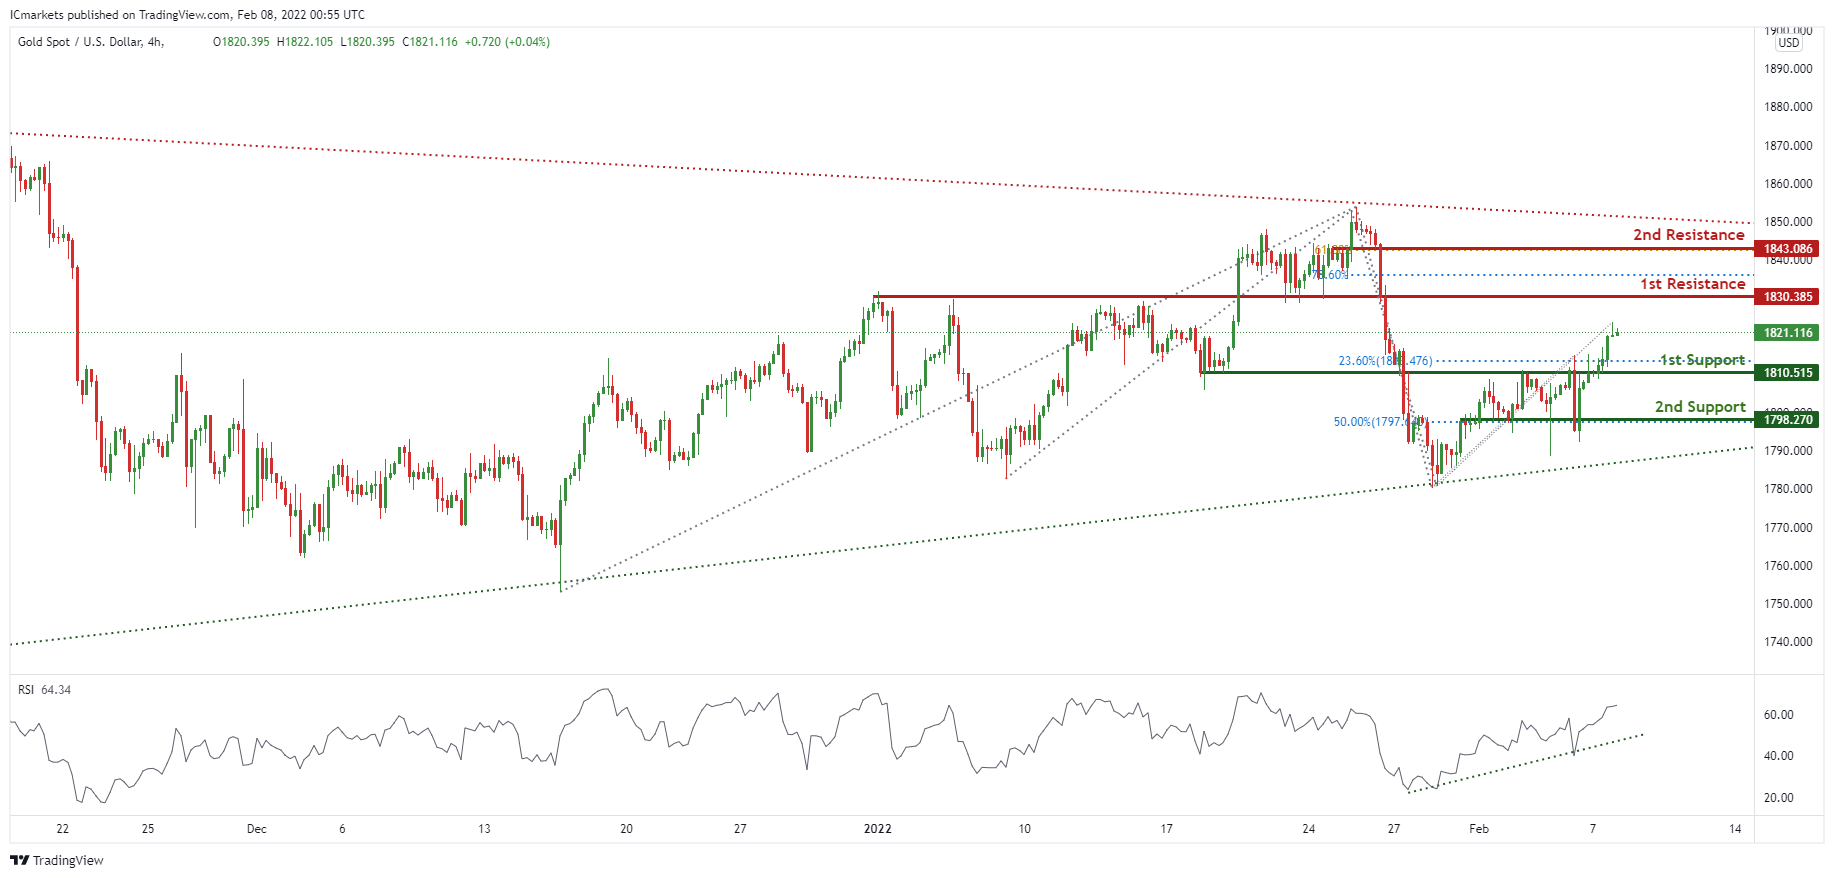
On the H4 chart, prices are consolidating in a triangle pattern. We see potential for further bullish continuation from our 1st support at 1810.515 in line with 23.6% Fibonacci retracement towards our 1st resistance at 1830.385 in line with 78.6% Fibonacci retracement. RSI are portraying bullish momentum, further supporting our bullish bias.
Areas of consideration:
- 4h 1st support at 1810.515
- 4h 1st resistance at 1830.385
GBP/USD
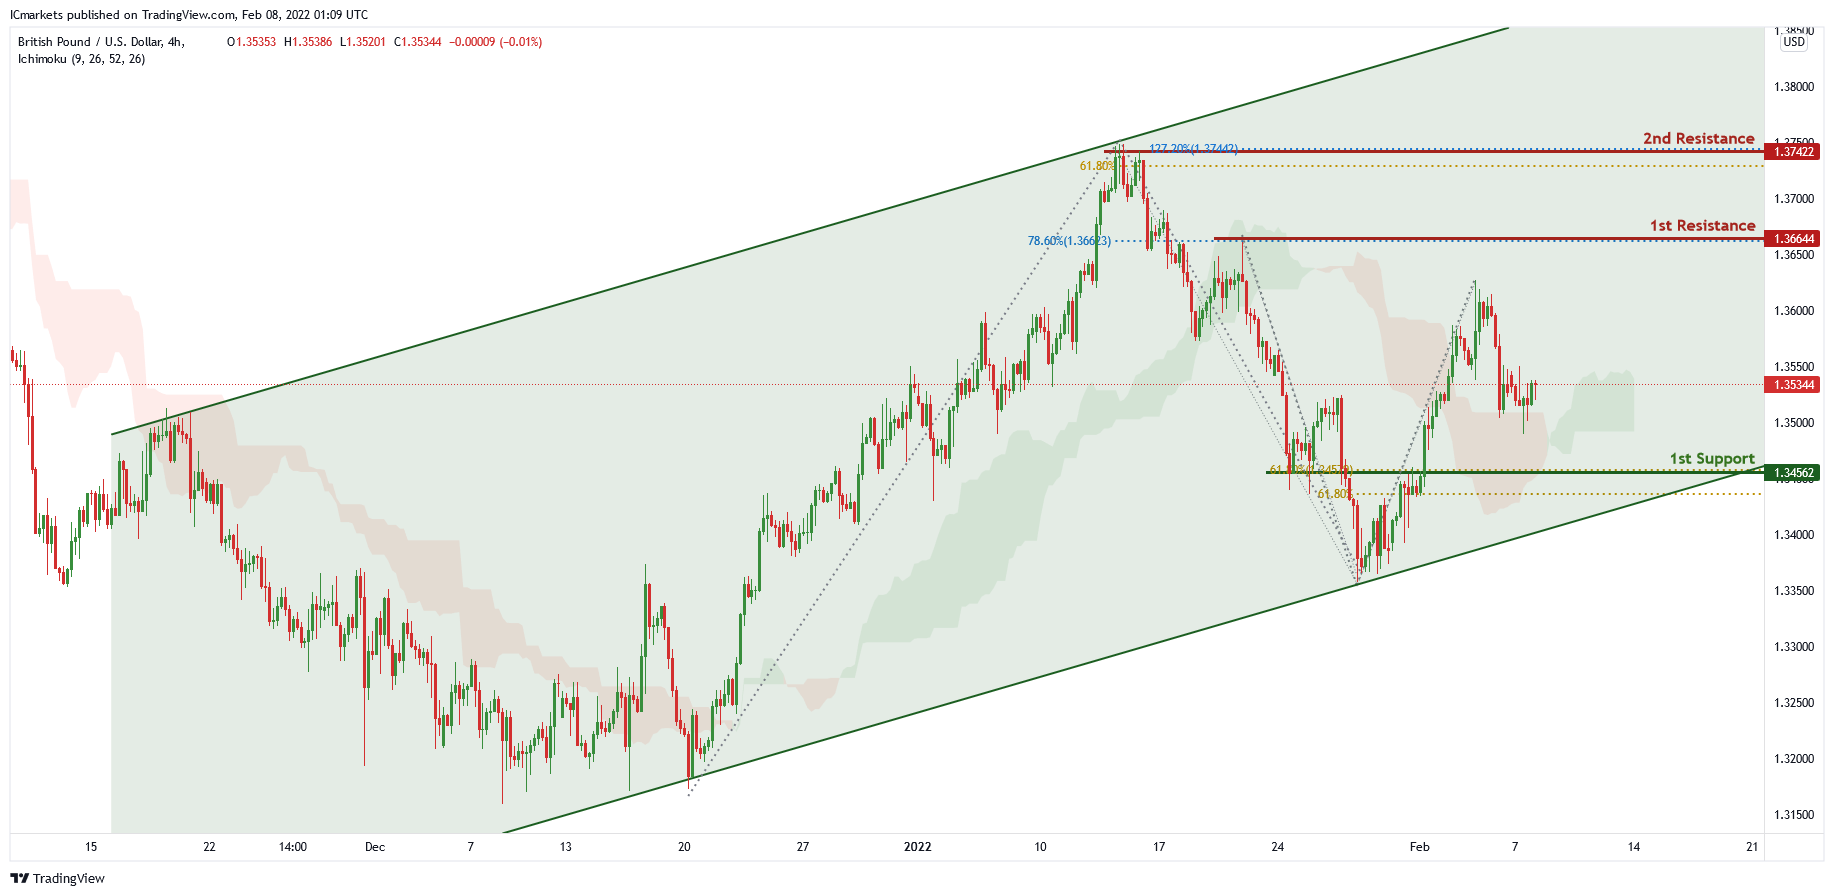
On the H4 chart , price is trading in an ascending channel , price is in the middle of the 1st resistance level of 1.36644 which is also 78.6% Fibonacci projection and 1st support level of 1.34562 which is also 61.8% Fibonacci projection and 61.8% Fibonacci retracement. Price can potentially go to its 1st resistance level. Our bullish bias is supported by the ichimoku cloud indicator.
Areas of consideration:
- H4 1st resistance at 1.36644
- H4 1st support at 1.34562
USD/CHF:
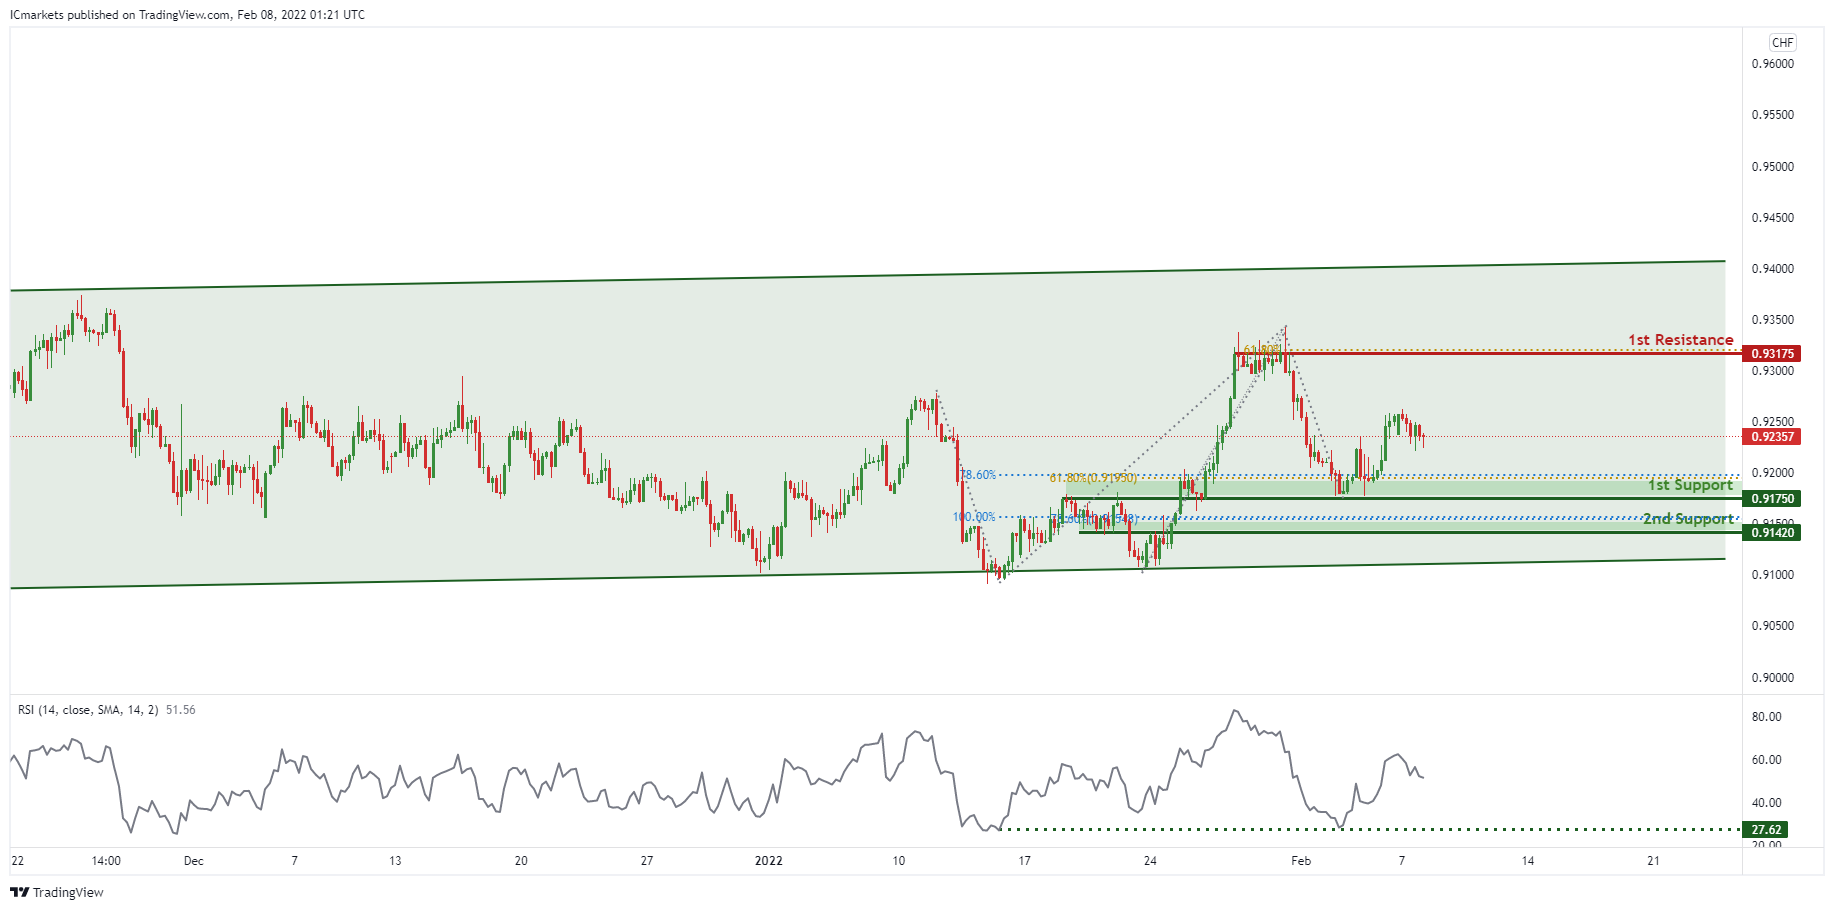
On the H4 timeframe,in reference to last week’s analysis price indeed bounced at the 1st Support level. Price is abiding to the daily ascending channel signifying an overall bullish momentum. We can expect the price to bounce from 1st Support in line with 78.6% Fibonacci projection and 61.8% fibonacci retracement towards 1st Resistance in line with 61.8% Fibonacci projection and previous swing high. Our bullish bias is further supported by the RSI indicator where it is at the support level. Traders should wait for prices to swing higher or lower before entering.
Areas of consideration:
- Watch 1st Support at 0.91750
- Watch 1st Resistance at 0.93175
EUR/USD :
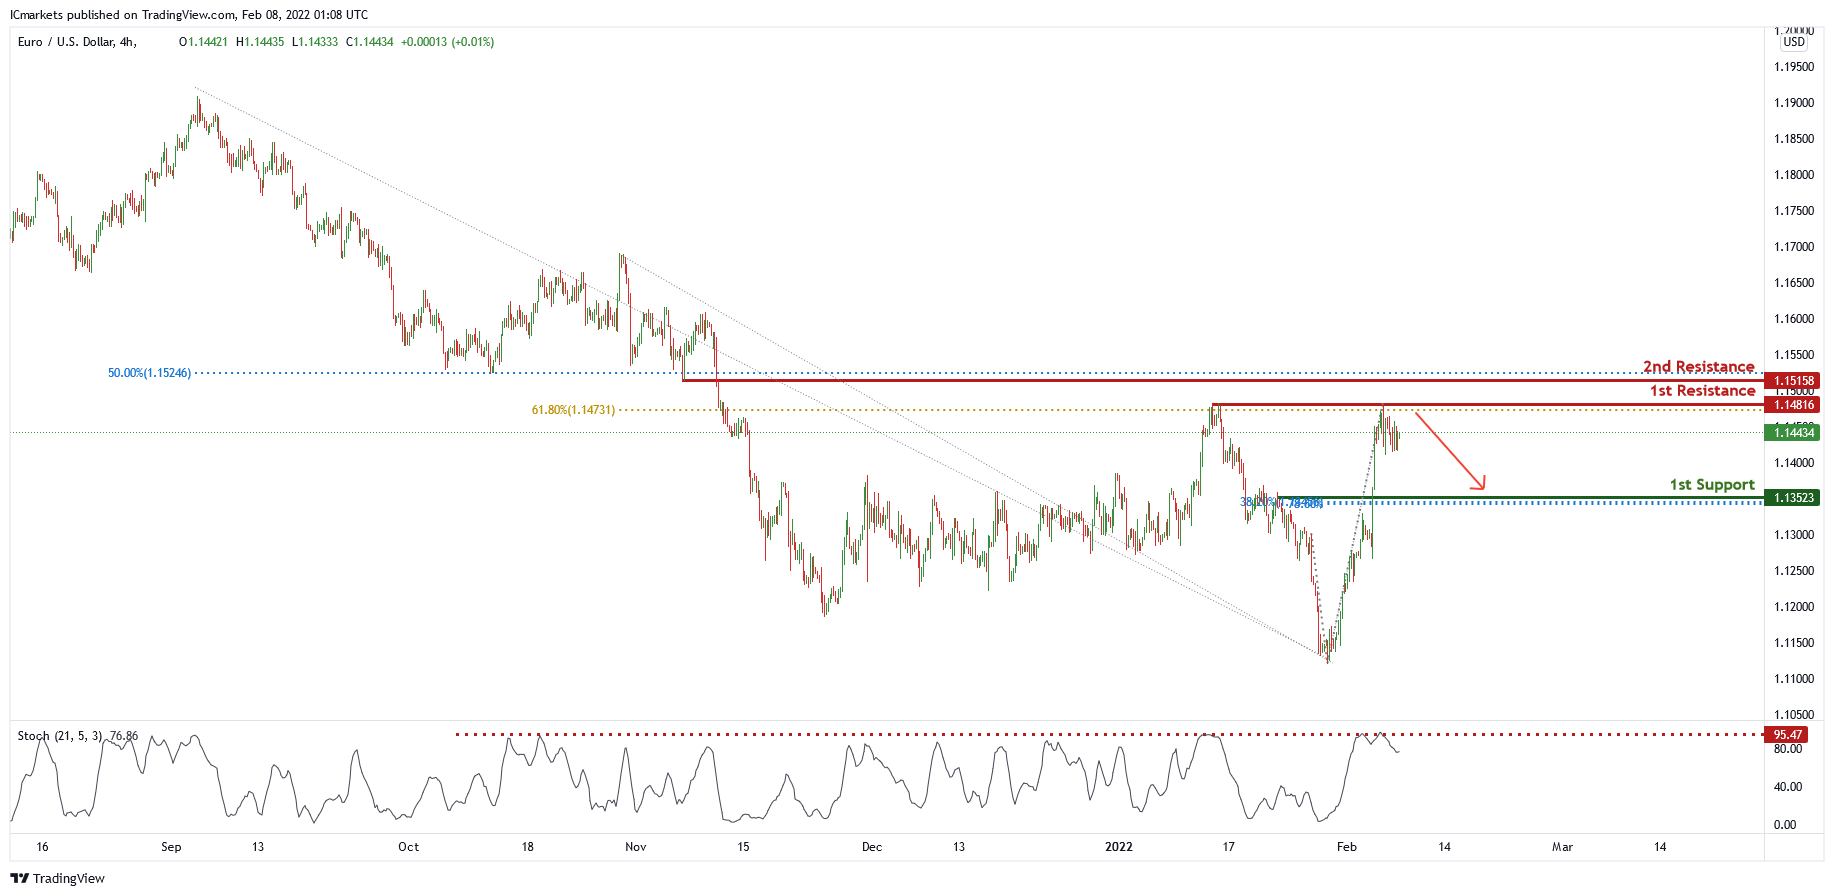
On the H4 chart, price is near the 1st resistance level of 1.14816 which is also 61.8% Fibonacci retracement. Price can potentially dip to the 1st support level of 1.13523 in line with 38.2% Fibonacci retracement and 78.6% Fibonacci projection. Our bearish bias is supported by the stochastic indicator as price is trading below it.
Areas of consideration :
- H4 1st support at 1.13523
- H4 1st resistance at 1.14816
USD/JPY:
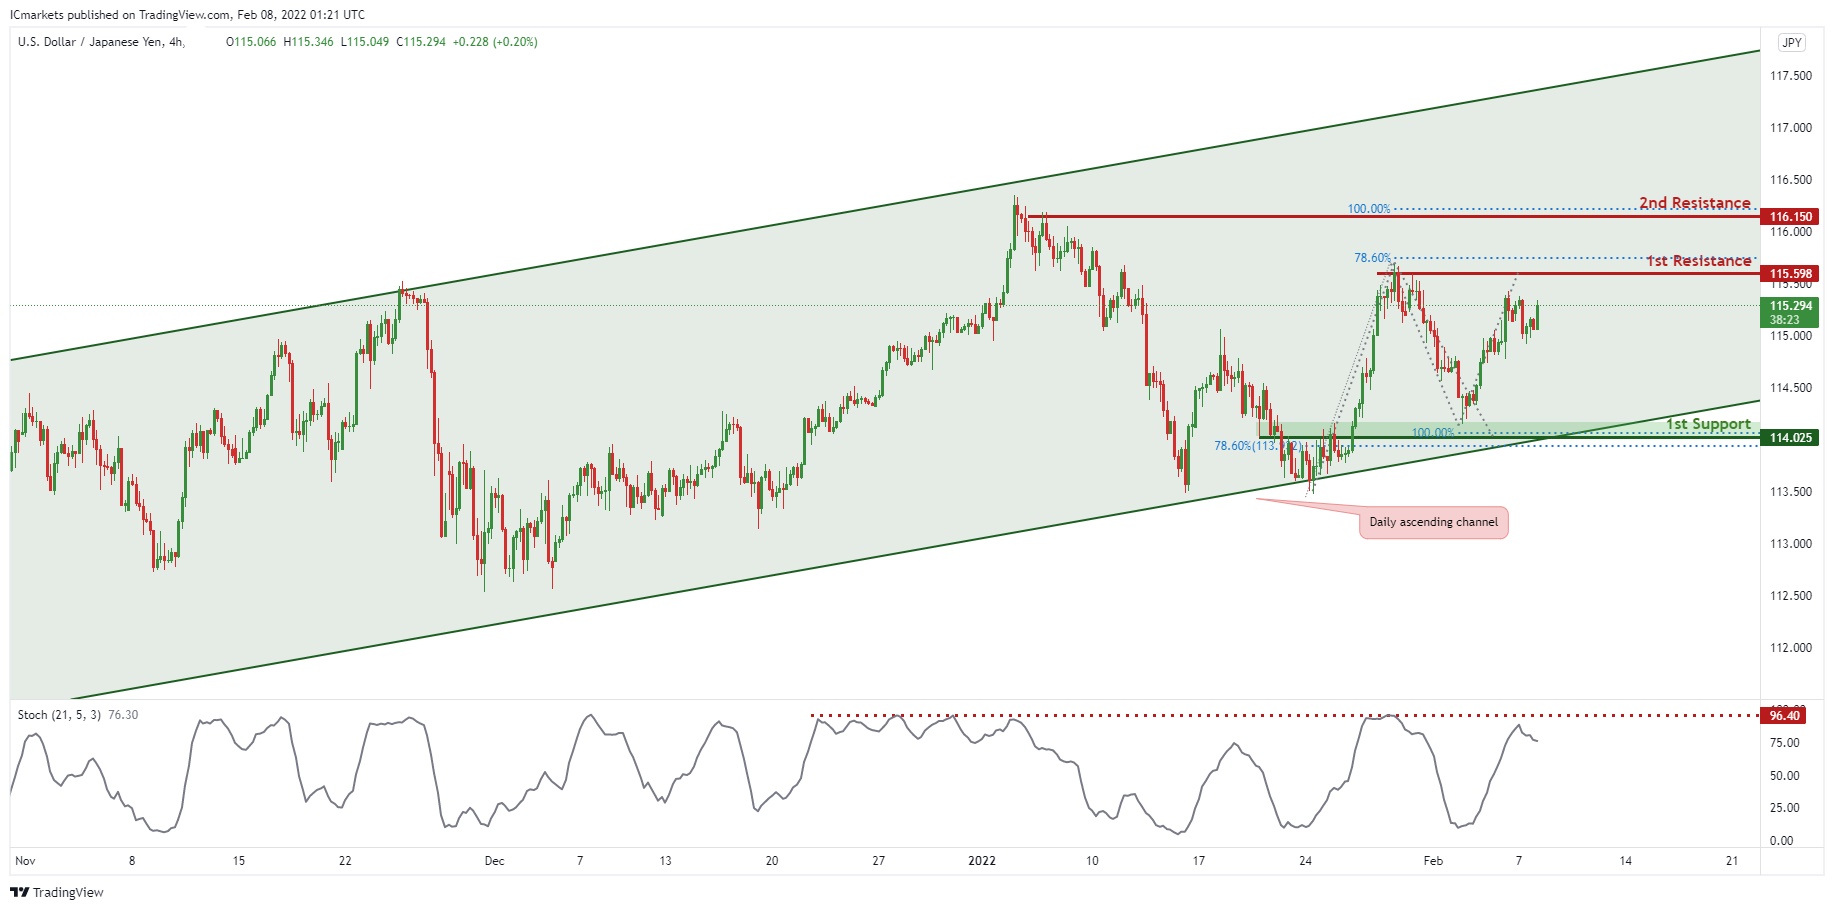
On the H4 chart,in reference to last week’s analysis, price indeed bounced at 1st Support and it is reaching our potential 1st Resistance level @ 115.598.
Price is trading in an ascending channel signifying an overall bullish momentum, however, we can expect a short-term bearish drop from 1st Resistance level in line with horizontal resistance and 78.6% Fibonacci projection towards 1st Support in line with previous swing low and 100% Fibonacci projection. Our bearish bias is further supported by the stochastic indicator where the %K line is at the resistance level.
Areas of consideration:
- H4 1st support at 114.025
- H4 1st resistance at 115.598
AUD/USD:
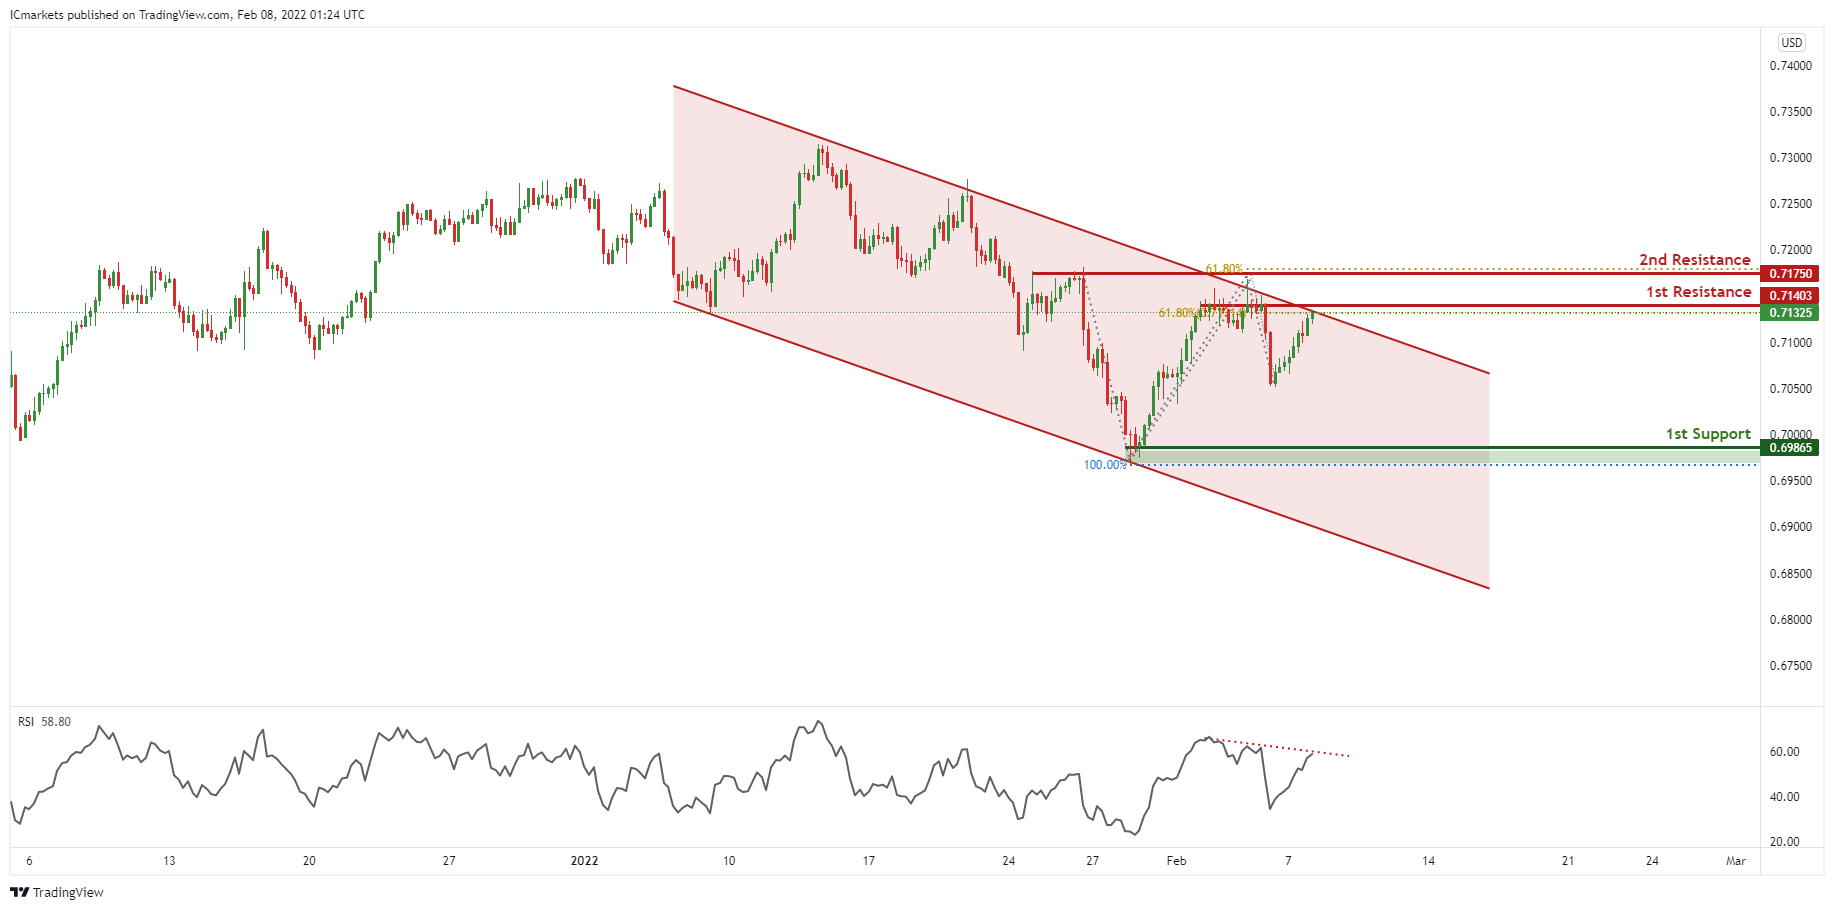
On the H4 timeframe, in reference to last week’s analysis, price indeed dropped from the resistance level. Price is abiding to the descending channel, signifying an overall bearish momentum. We can expect price to drop from 1st Resistance in line with 61.8% Fibonacci retracement towards 1st Support in line with previous swing low and 100% Fibonacci projection. Our bearish bias is further supported by the RSI indicator where it is abiding to the descending trendline resistance.
Areas of consideration:
- H4 1st Support level 0.69865
- H4 1st resistance level 0.71403
NZD/USD:
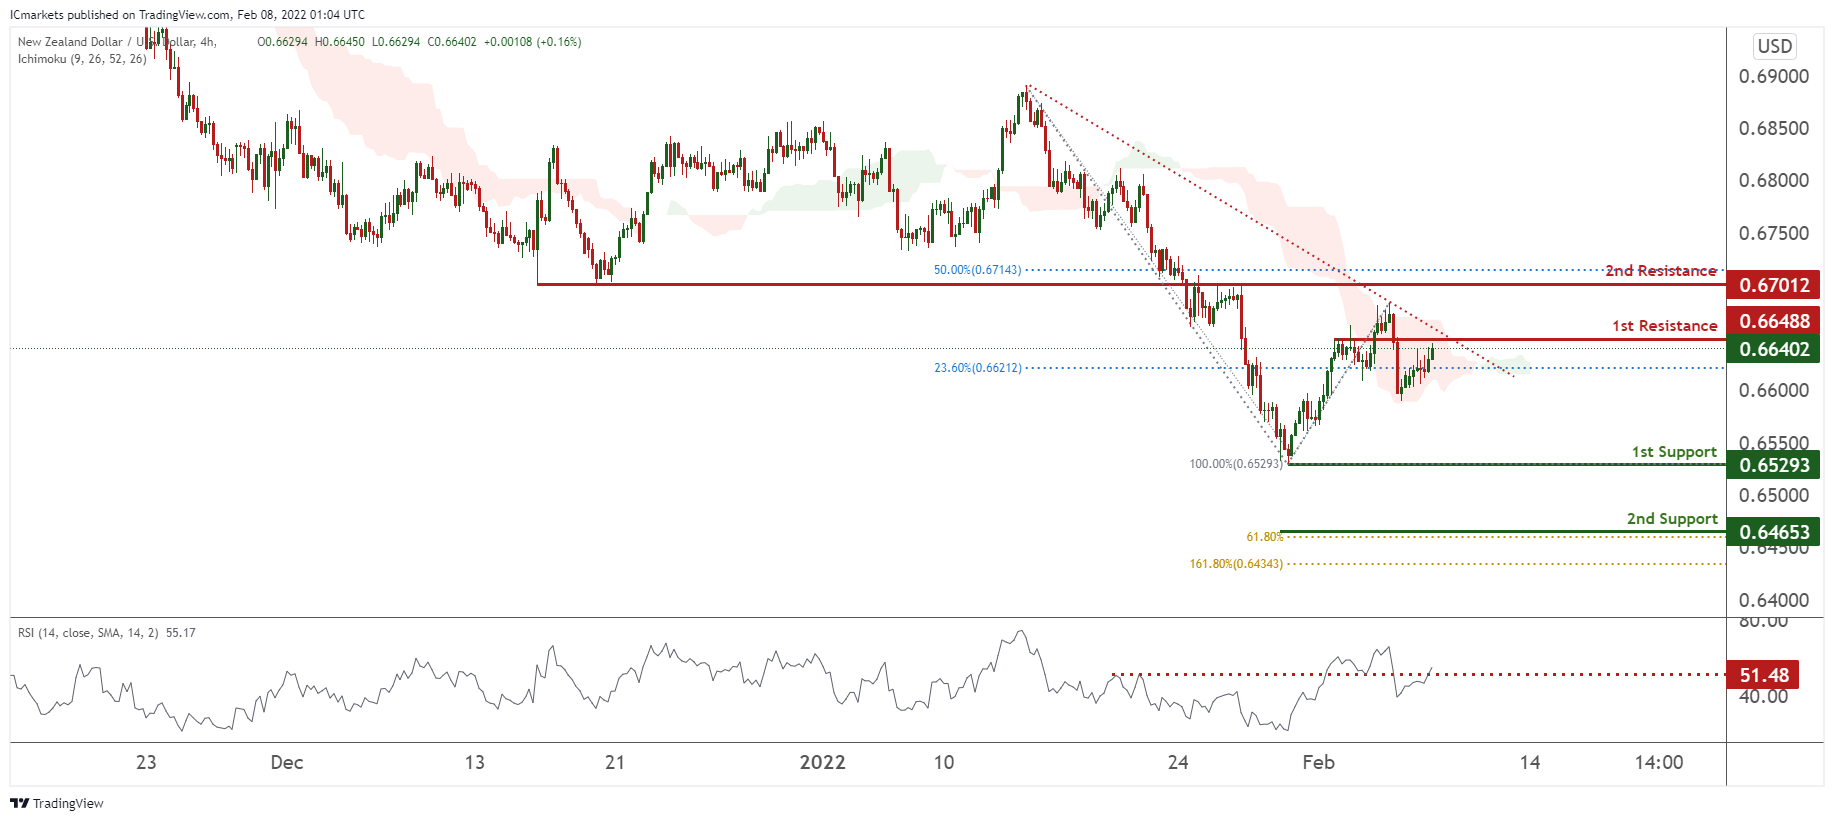
On the H4 timeframe, prices were on bearish momentum and are abiding to our descending trendline. We see potential for prices to dip from our 1st resistance at 0.66488 in line with 23.6% Fibonacci retracement towards our 1st support at 0.65293 in line with 100% Fibonacci retracement. Our bias is further supported by prices facing resistance in the Ichimoku Clouds and RSI being at levels where dips previously occurred. Alternatively, our stop loss will be placed at 2nd resistance at 0.67012 in line with 50% Fibonacci retracement.
Areas of consideration:
- H4 time frame, 1st resistance at 0.66488
- H4 time frame, 1st support at 0.65293
USD/CAD:
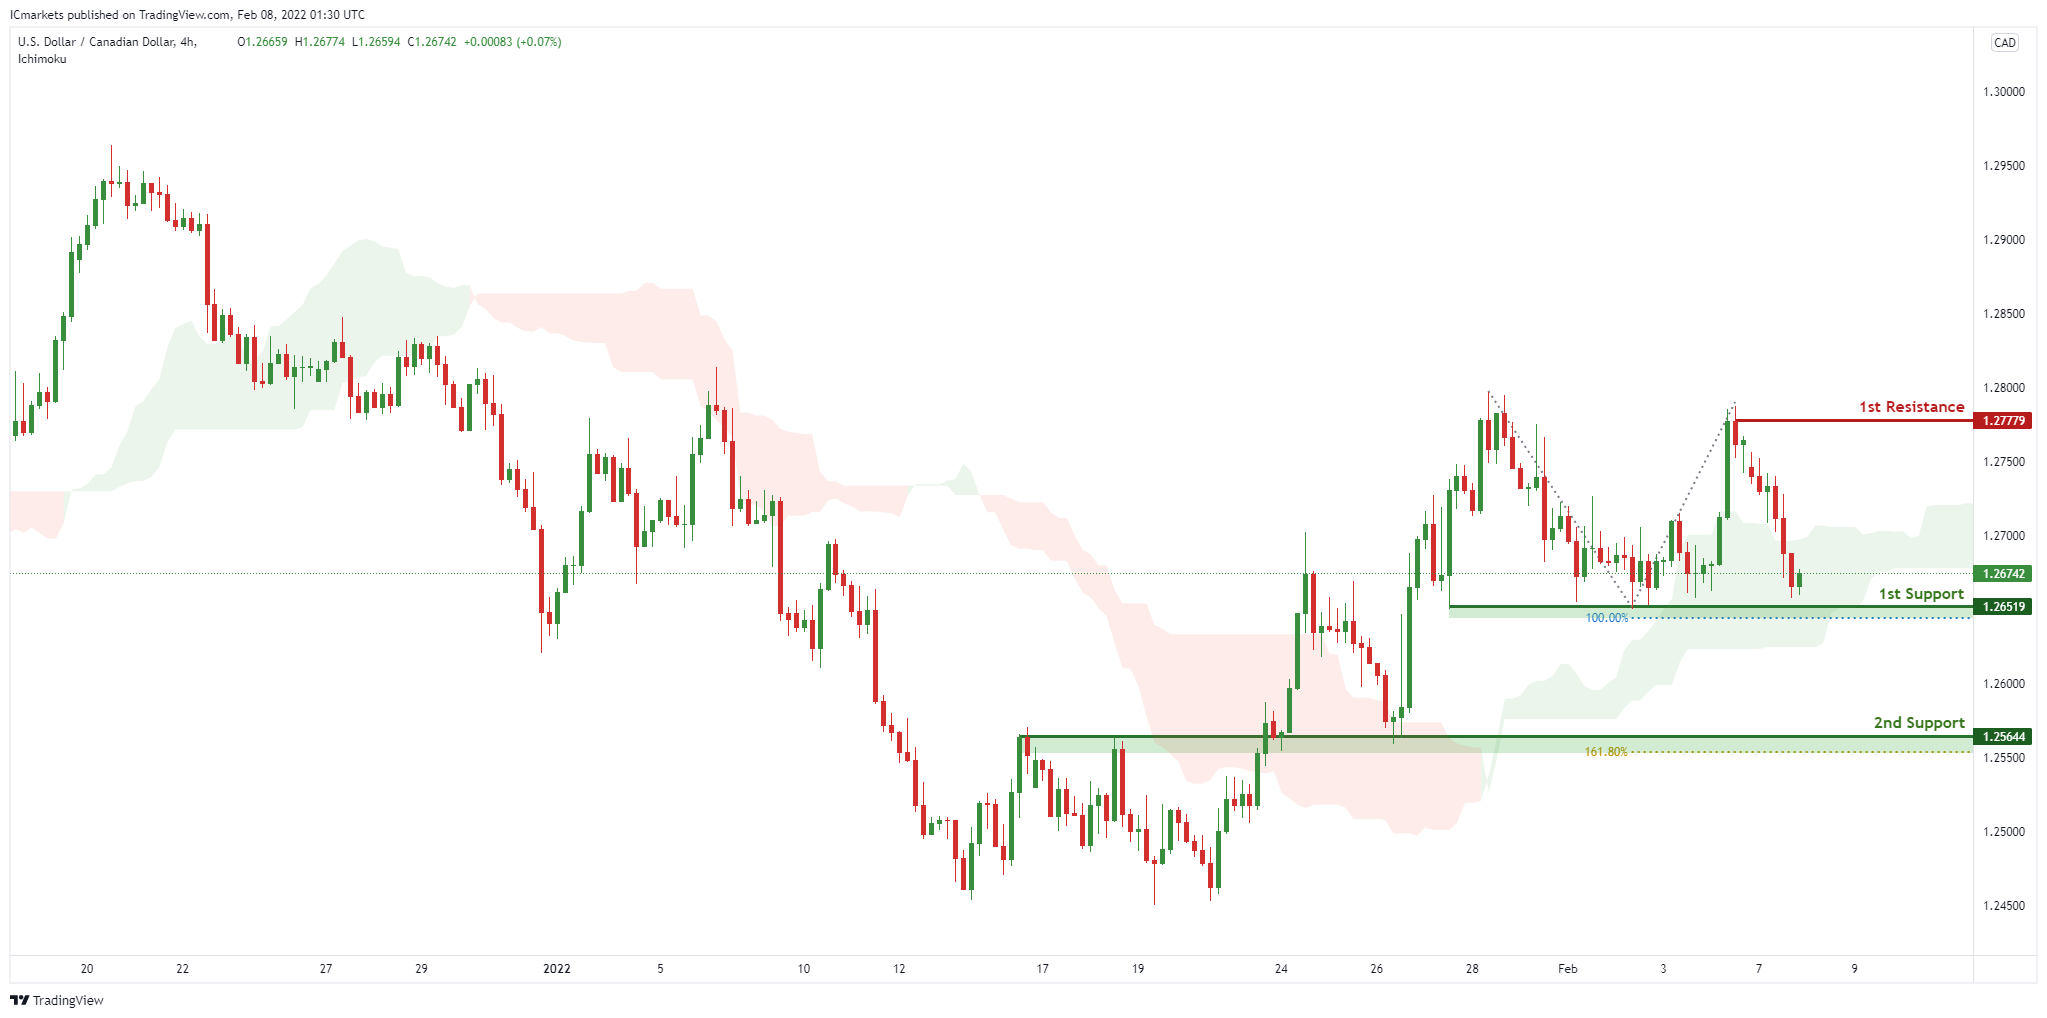
On the H4, with prices moving above the ichimoku cloud, we see the potential for a bounce from our 1st support at 1.26519 in line with horizontal swing low support and 100% Fibonacci projection towards our 1st resistance at 1.277779 in line with horizontal swing high resistance. Alternatively, price may break 1st support structure and head for 2nd support at 1.25644, in line with the horizontal overlap support.
Areas of consideration:
- H4 time frame, 1st support at 1.26519
- H4 time frame, 1st resistance at 1.277779
OIL:
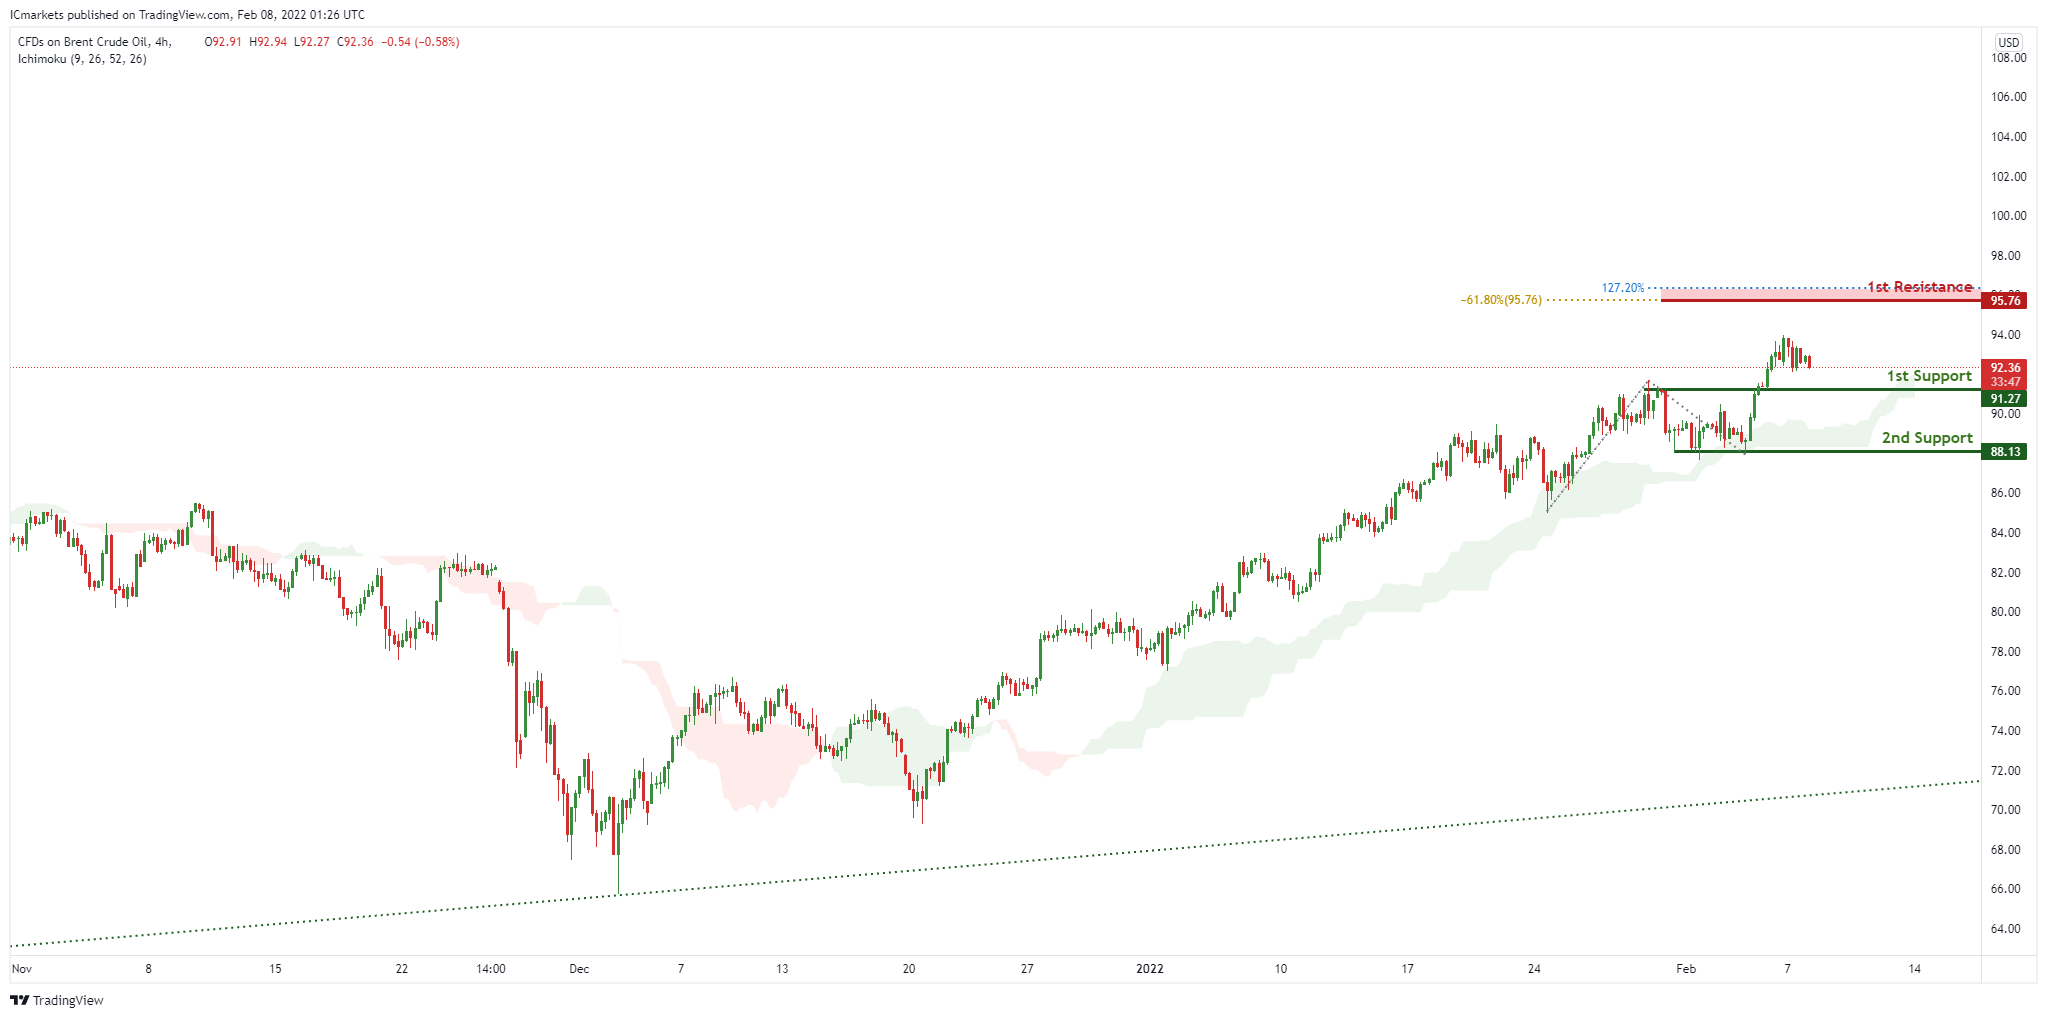
On the H4, with prices moving above the ichimoku cloud, we see the potential for a bounce from our 1st support at 91.27 in line with horizontal overlap support towards our 1st resistance at 95.76 in line with the 127.2% Fibonacci extension and -61.8% Fibonacci expansion. Alternatively, price may break 1st support structure and head for 2nd support at 88.13, in line with the horizontal swing low support.
Areas of consideration:
- H4 time frame, 1st resistance of 95.76
- H4 time frame, 1st support of 91.27
Dow Jones Industrial Average:
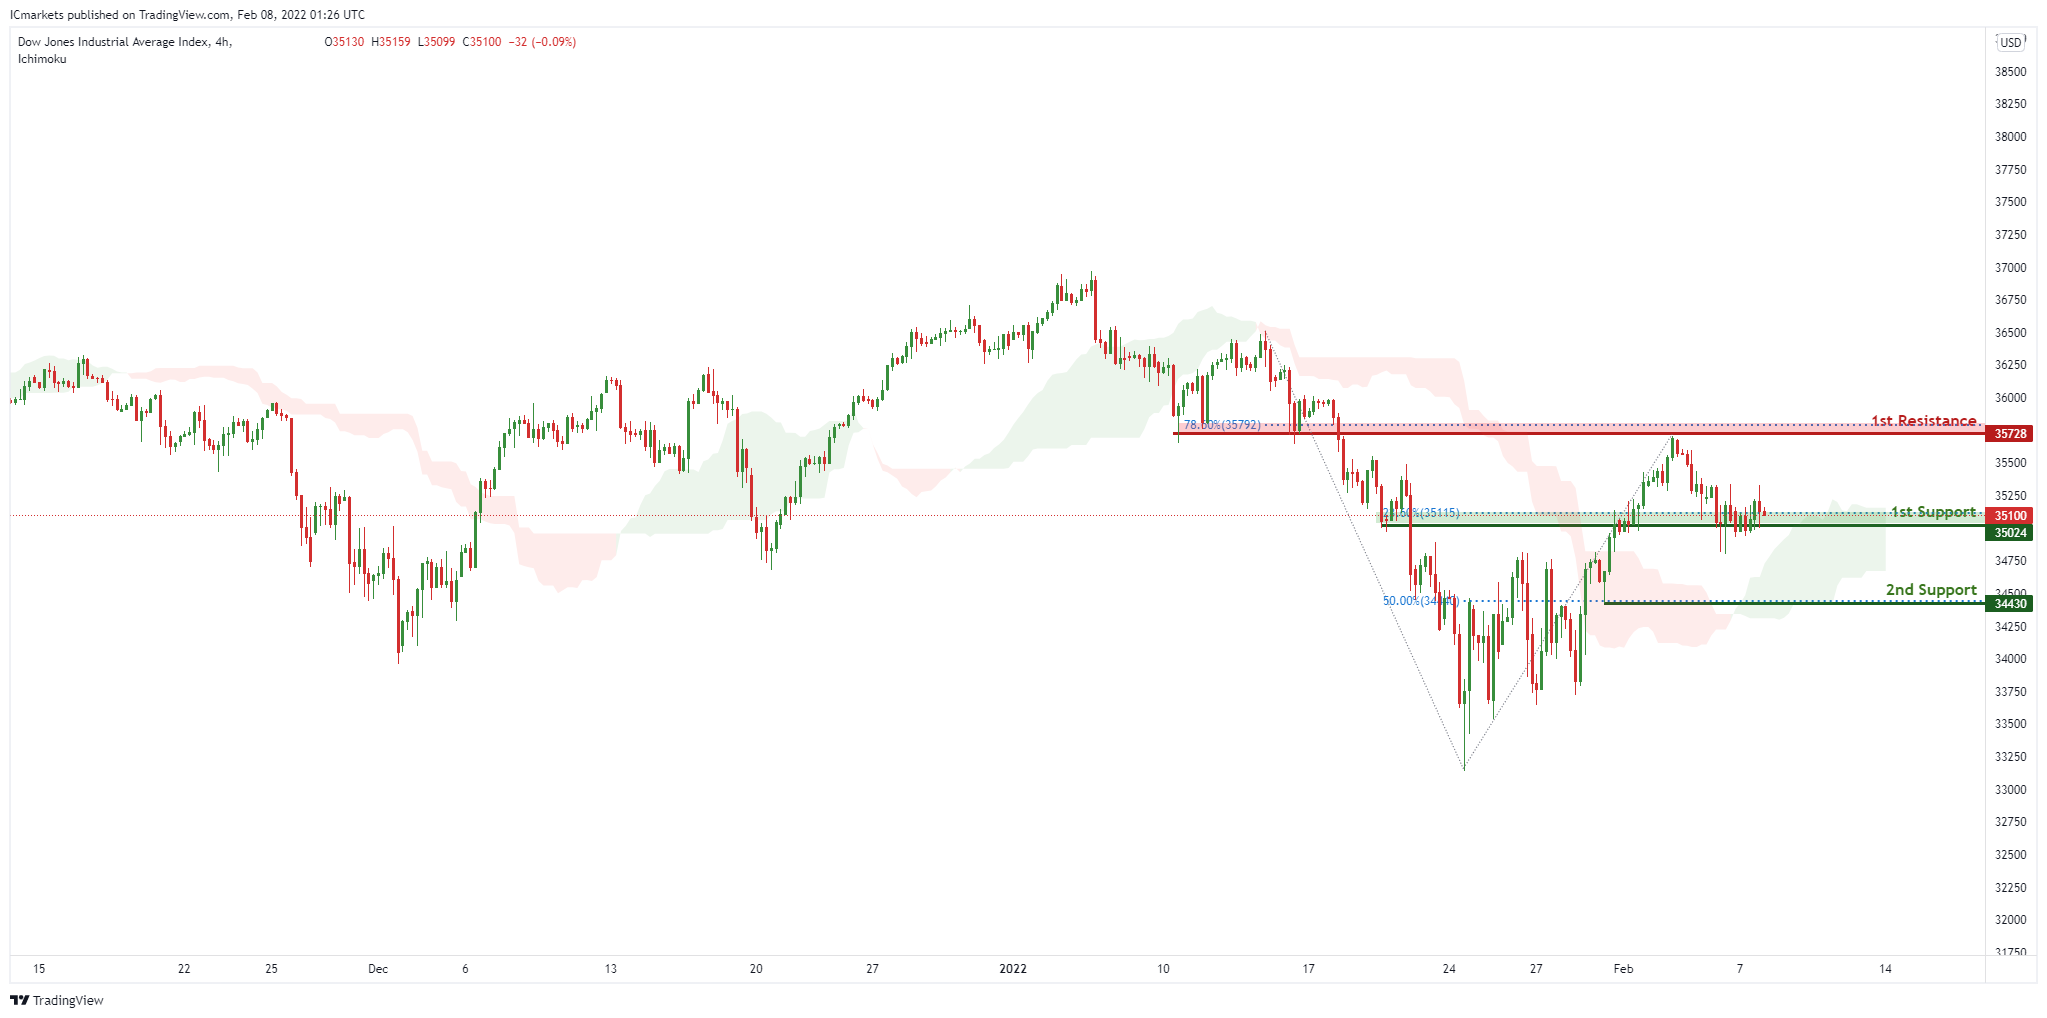
On the H4, with price moving above the ichimoku cloud, signifying an overall bullish momentum. We can expect price to rise to our 1st resistance at 35728 in line horizontal graphical swing high resistance and 78.6% Fibonacci retracement from our 1st support in line with horizontal overlap support and 23.6% Fibonacci retracement level at 35024. Alternatively, price may break 1st support structure and head for 2nd support, which coincides with 50% Fibonacci retracement level at 34430.
Areas of consideration:
- H4 time frame, 1st resistance of 35728
- H4 time frame, 1st support of 35024
AUD/USD Daily Report
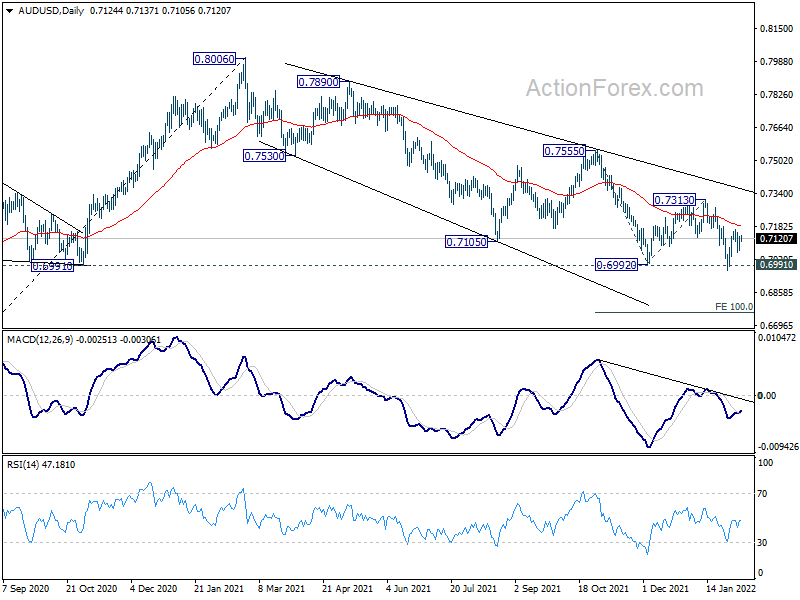
Daily Pivots: (S1) 0.7082; (P) 0.7106; (R1) 0.7147; More...
Intraday bias sin AUD/USD is turned neutral first with current recovery. On the upside, above 0.7167 will resume the rebound to 0.7313 resistance. Firm break there will be an indication of bullish reversal. On the downside, sustained trading below 0.6991 will extend the down trend from 0.8006. Next target is 100% projection of 0.7555 to 0.6992 from 0.7313 at 0.6750.
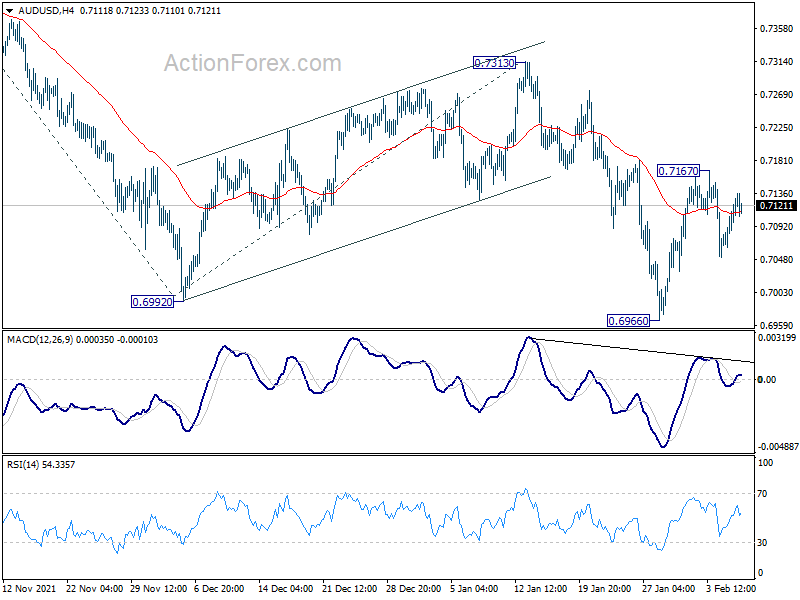
In the bigger picture, focus remains on 0.6991 key structural support. Sustained break there will argue that the whole up trend from 0.5506 might be finished at 0.8006, after rejection by 0.8135 long term resistance. Deeper decline would then be seen back to 61.8% retracement of 0.5506 to 0.8006 at 0.6461. Meanwhile, strong rebound from 0.6991 will retain medium term bullishness. That is, whole up trend from 0.5506 is still in progress.
USD/CAD Daily Outlook
Daily Pivots: (S1) 1.2633; (P) 1.2694; (R1) 1.2731; More...
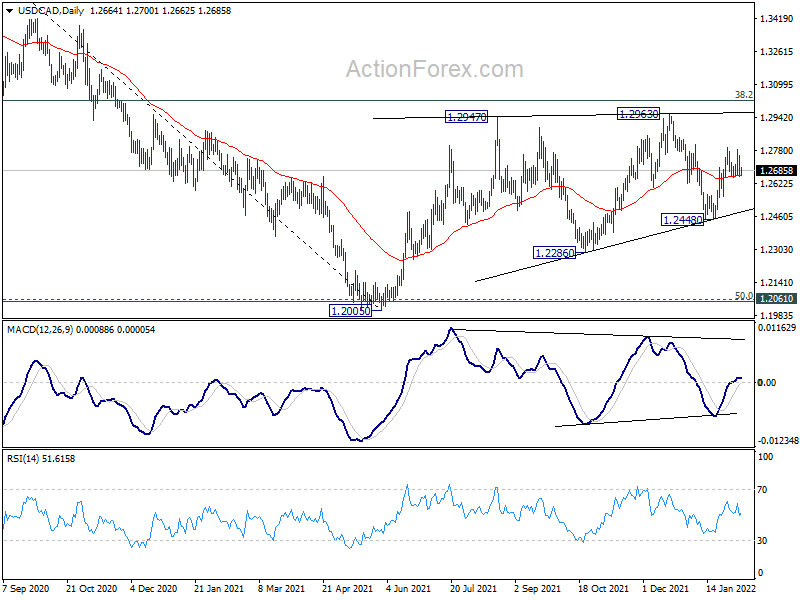
Range trading continues in USD/CAD and intraday bias remains neutral first. With 1.2648 minor support intact, further rise is mildly in favor. On the upside, break of 1.2795 will resume the rally from 1.2448 to 1.2963 resistance next. However, break of 1.2648 will turn bias back to the downside for 1.2448 support instead.
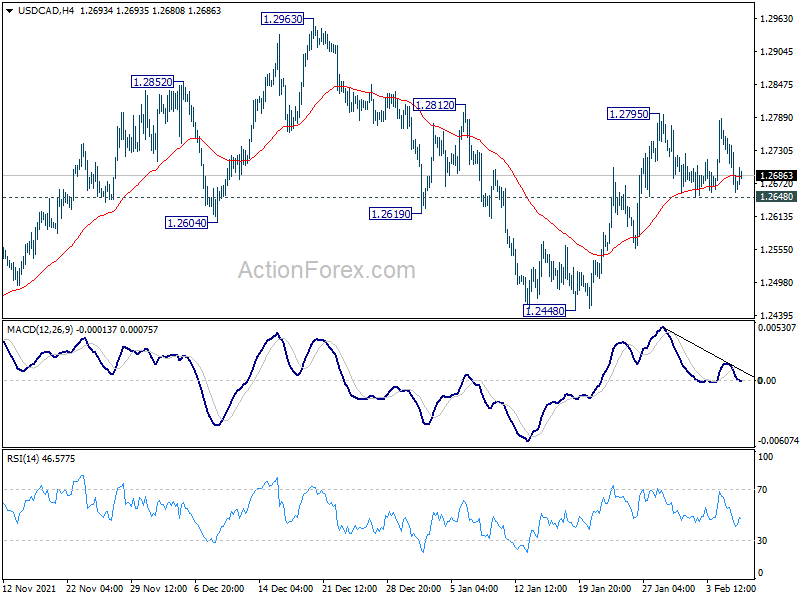
In the bigger picture, focus stays on 38.2% retracement of 1.4667 (2020 high) to 1.2005 (2021 low) at 1.3022. Sustained break there should confirm that the down trend from 1.4667 has completed after defending 1.2061 long term cluster support. Further rise would then be seen towards 61.8% retracement at 1.3650. However, rejection by 1.3022 will maintain medium term bearishness. Break of 1.2005 will resume the down trend from 1.4667 and that carries larger bearish implications too.