Sample Category Title
USDJPY Constricted by MAs But Bearish Tone Yet to Dominate
USDJPY is currently being squeezed between the 50- and 100-day simple moving averages (SMAs), also finding its feet on the lower Bollinger band in recent sessions, following the correction from the 5-year high. The longer-term SMAs continue to endorse the broader uptrend, while the slightly weakened incline of the 50-day SMA is reflecting the latest retreat in the pair.
The short-term oscillators are sending mixed messages in directional momentum. The MACD is falling beneath its red trigger and zero lines, while the RSI and the positively charged stochastic oscillator are promoting upside price action in the pair. The RSI is pointing north, nearing its 50 threshold and the stochastic %K line has rebounded off the 20 oversold level and over the %D line.
In the positive scenario, preliminary resistance could arise from the capping 50-day SMA at 114.30 ahead of a limiting area, between the mid-Bollinger band at 114.76 and the nearby high of 115.05. Rising beyond these obstacles, the price may then target the 116.00-116.34 zone of resistance. Should buyers overcome this fortified barrier, which includes the upper Bollinger band and the 5-year peak, the 116.87 high, identified in January 2017, could then come under attack.
Otherwise, if the 50-day SMA dismisses any positive developments in the pair, buyers could then try to create a foothold in the space between the 100-day SMA at 113.41 and the 113.13 low. If this region fails to provide the pair with support, the November and December 2021 troughs around 112.72 along with the April 2019 rally peak of 112.40 could forge a strong base. Moreover, the 112.00-112.22 adjacent border, extending back to February 2020, may further fortify upside defences.
Summarizing, USDJPY has managed to keep the broader uptrend intact above the 112.40-112.72 base. Furthermore, the current neutral-to-bullish tone in the pair is active north of the 100-day SMA at 113.41, and a price jump above 115.05 could fuel optimism. That said, for sellers to reinforce a negative trajectory, they would need to pierce beneath the buffer zone existing from 112.72 until 112.00.

GBPJPY Meets Resistance at 200-SMA; Bearish Forces Persist
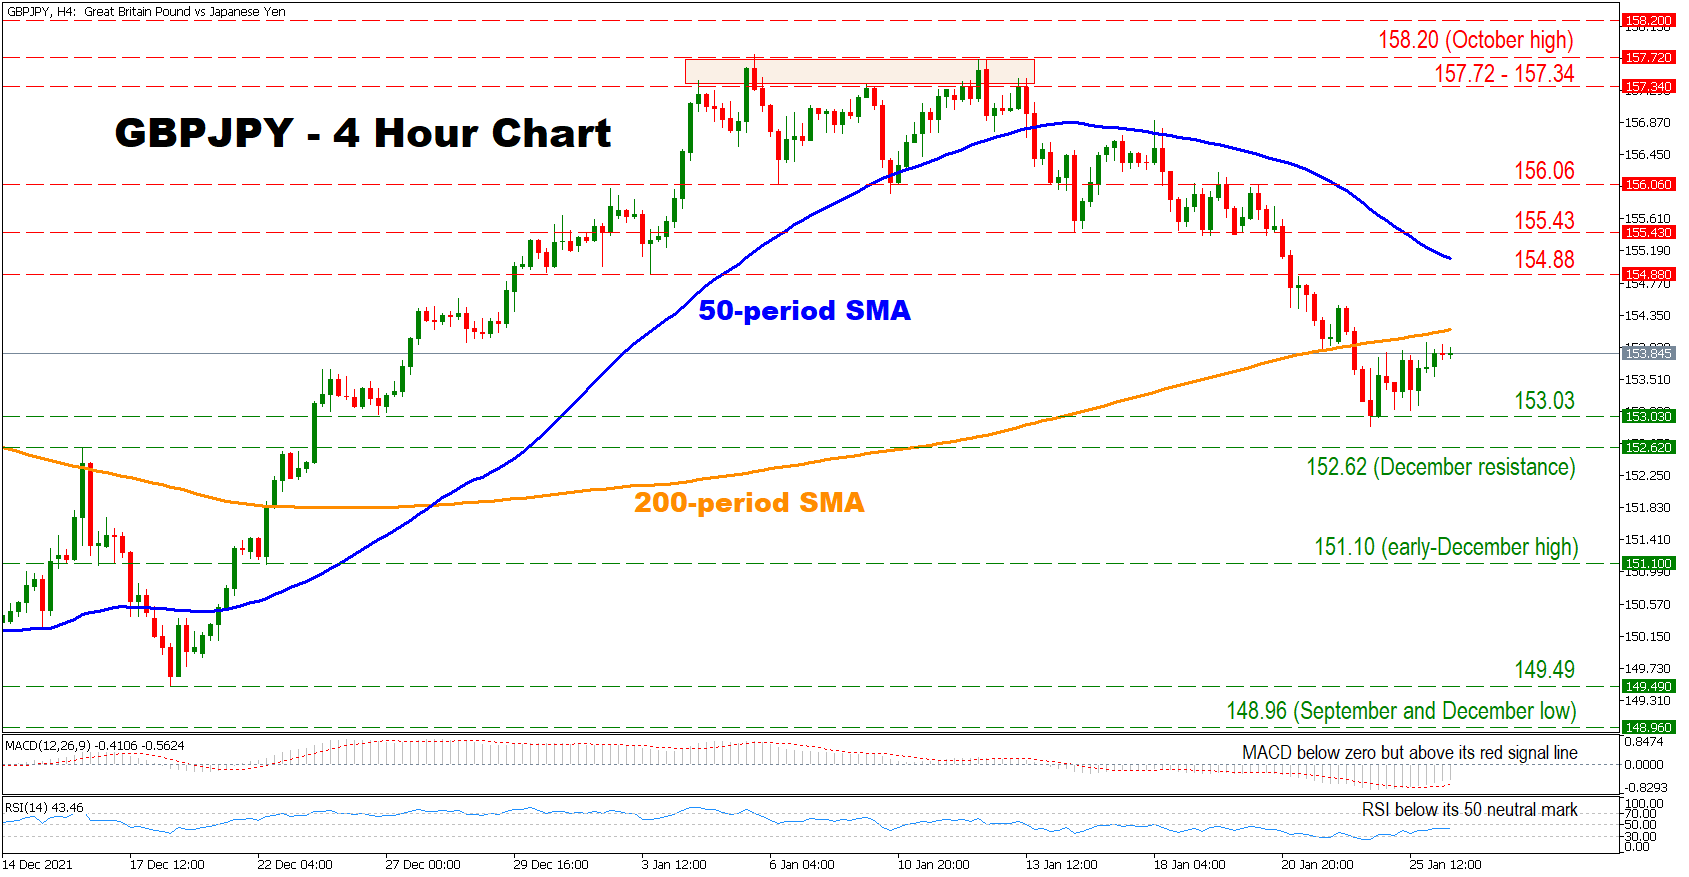
GBPJPY continues its retreat from its early-January high amid persisting negative forces. Moreover, the pair has recently crossed below its 200-period simple moving average after breaking under its 50-period SMA, supporting its cautiously bearish outlook.
Short-term momentum indicators are reflecting a mixed picture as the RSI is located below its 50 neutral mark. However, the MACD is found above its red signal line despite being in negative territory, which indicates that the negative momentum might be fading.
Should the bears maintain control, immediate support might be found at the 153.03 hurdle before sellers eye the 152.62 barrier. A break below that point could open the door towards the 151.10 obstacle. A decisive move below the latter could increase selling pressures, sending the price to test the 149.49 level before sellers shift their attention towards the September and December low at 151.10.
On the flip side, if the bulls seize control, initial resistance might be found at the 200-period SMA currently at 154.16. Crossing above that point buyers might then target the region which includes the 154.88 barrier and the 50-period SMA currently at 155.08. A break above this area could turn the fortunes around for the pair, sending the price to test the 155.43 and 156.06 hurdles sequentially.
In brief, the current outlook for the pair is cautiously bearish. For sentiment to change, buyers would need to break above the 50-period SMA.
EURJPY Finds Some Footing But Bears Keep the Lead
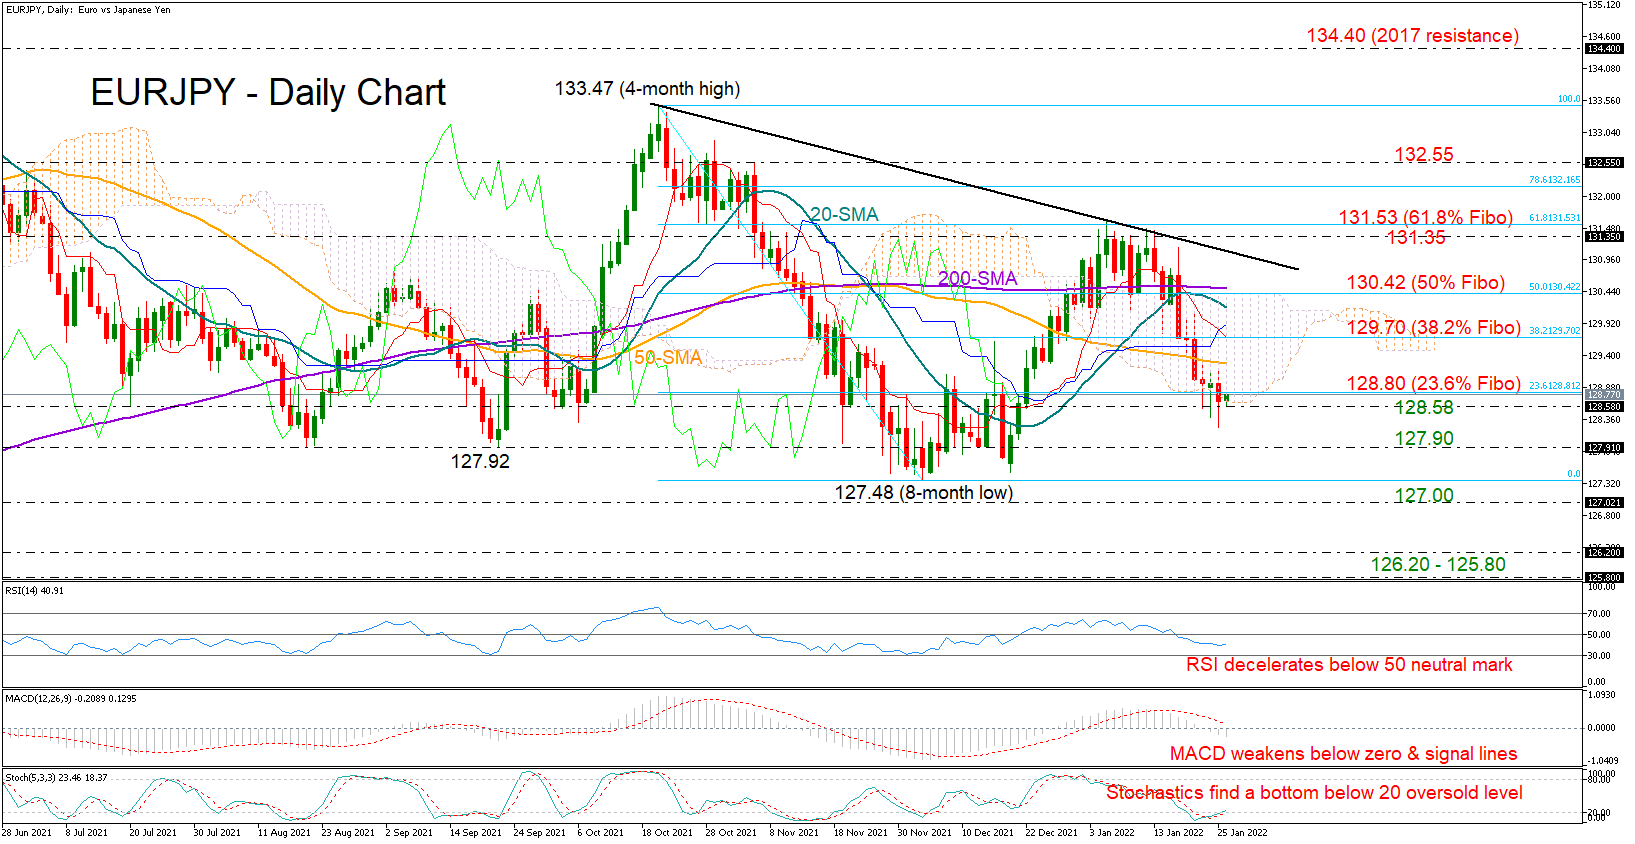
EURJPY slid to a one-month low of 128.23 on Tuesday but managed to close the day within the 128.80- 128.58 tight support area, clinging to a ray of hope that a bullish reversal could develop in the short term.
While the Stochastics are pivoting below 20, flashing oversold conditions, the RSI and the MACD continue to trend downwards within the bearish territory, suggesting the three-week-old sell-off could gain extra legs before the bulls come into play. The recent negative intersection between the red Tenkan-sen and Kijun-sen lines is backing this narrative as well.
If the 128.58 floor cracks, the price could initially pause within the August-September support region of 127.92 before it tests the 127.48 bottom. Crossing below the 127.00 level, the bears may next target the 126.20 – 125.80 restrictive zone, last active during the December 2020 – January 2021 period.
On the upside, if the price crawls above the nearby 128.80 resistance, which represents the 23.6% Fibonacci retracement of the 133.47 – 127.48 down leg, the 50-day simple moving average (SMA) could immediately block the way towards the 38.2% Fibonacci of 129.70. Running higher, the pair may seek a close above the 50% Fibonacci and the 200-day SMA both near 130.42, though a decisive rally above the tough descending trendline at 131.14 would be more meaningful, especially if that is followed by a break above the 61.8% Fibonacci of 131.53 and the previous peak of 131.59.
In brief, EURJPY is in bearish mode in the short-term picture. A close below the 128.58 bar could bolster selling forces.
Euro Drifting ahead of FOMC Meeting
The euro continues to have a quiet week and is trading just shy of the 1.13 level.
All eyes on FOMC
It has been a calm week for the euro, but that could change later today when the FOMC releases its policy decision. Fed policy makers are in an unenviable position, as they strive to find that proper balance between responding to the inflation threat while also being careful not to be overly aggressive in raising interest rates. If the markets feel that the Fed has not achieved this delicate balance, it will let the central bank know loud and clear and we’ll see volatility in the financial markets after the meeting. Powell & Co. have done a good job telegraphing the markets and being transparent, and effective communication ahead of the lift-off of rate hikes will be crucial for market stability.
The Fed is virtually certain to raise rates in March, with FedWatch pegging the likelihood of a hike at 94%. The key question swirling in the markets is how aggressive will the Fed be in 2022. The baseline assumption is that the Fed will implement four rates hikes of 0.25% each. Still, the risk of additional hikes, given the surge in inflation, is tilted towards the upside. There is also the possibility of a 0.50% rate hike during the year, which would send a strong message to the markets that the Fed is determined to put a lid on inflation.
Another factor on the minds of investors is the tense stand-off between Russia and NATO over Ukraine. The US has said it is ready to send 8500 troops to Eastern Europe on short notice, but they will not be deployed in Ukraine. The crisis has escalated into a powder keg which could explode at any time. If Russia invades Ukraine, risk sentiment would sink and the safe-haven US dollar would likely jump at the expense of the other major currencies.
EUR/USD Technical
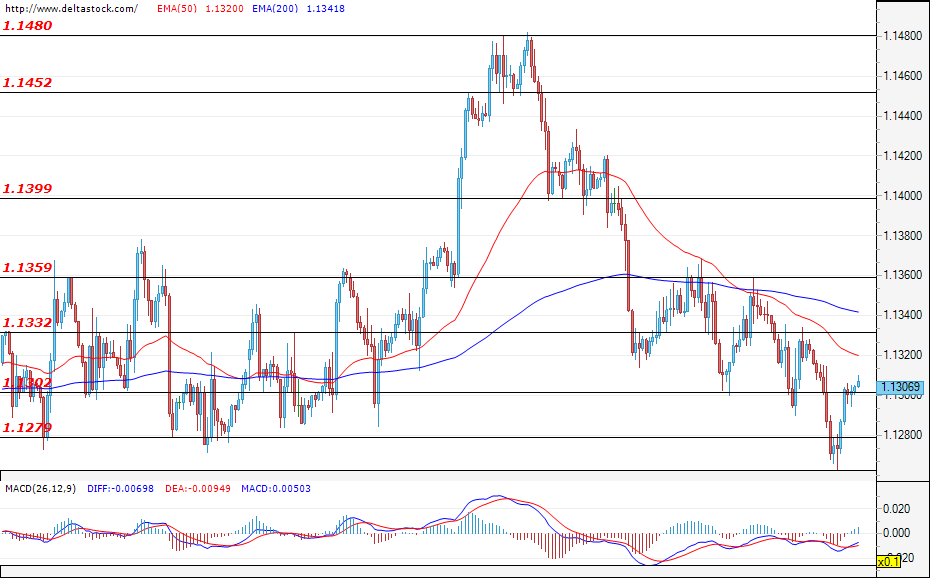
- In the European session, EUR/USD tested support at 1.1285. Below, there is support at 1.1226
- There is resistance at 1.1359 and 1.1418
Daily Technical Analysis
EUR/USD
During yesterday's trading session, the currency pair made an unsuccessful attempt at breaching the critical support at 1.1280 and, at the time of writing, it is heading back towards the resistance level of 1.1330. The forecast is for the retracement to be limited by the resistance level of 1.1360 and for the bears to charge the mentioned support at 1.1280 again afterwards. A spike in volatility is possible in the last hours of the trading session when the U.S. Federal Reserve interest rate decision is to be announced (19:00 GMT).
USD/JPY
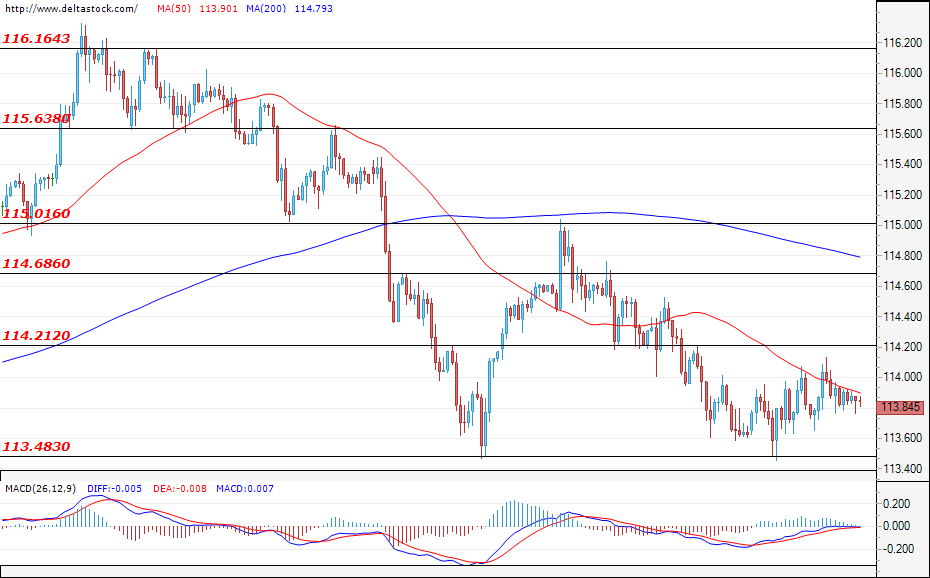
During the last couple of days, the currency pair has been trading in the narrow range of 113.48 – 114.21 and the forecast is for the Ninja to trade in this range during most of the day as investors will be awaiting the announcement of the U.S. Federal Reserve interest rate decision (19:00 GMT). A possible breach of the lower border of the range could lead to a decline towards the support zone at 113.00, while a breach of the upper border would let the bulls attack the resistance at 114.70.
GBP/USD
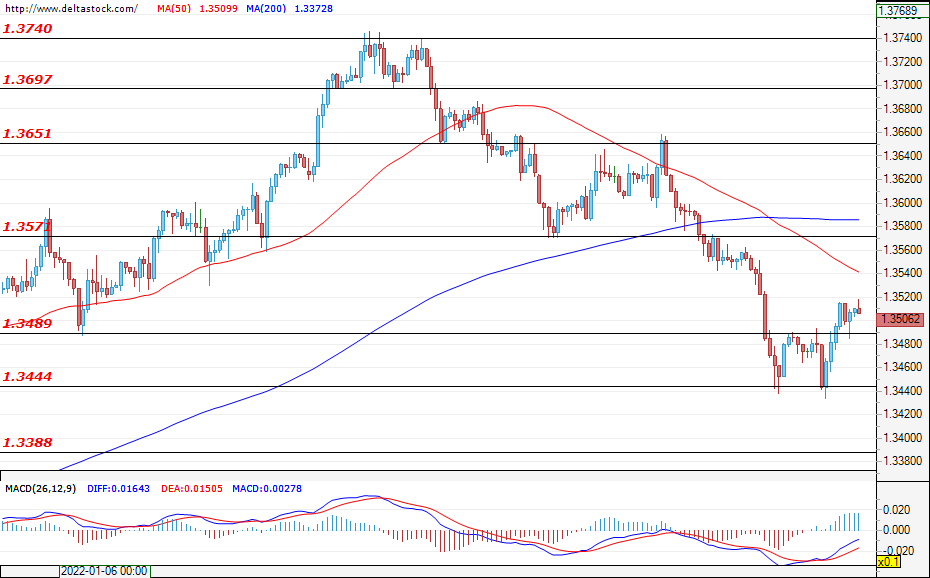
After the unsuccessful test of the support level of 1.3444, the Cable entered a corrective phase and yesterday breached the resistance at 1.3490. The expectations are for the currency pair to consolidate in the zone just above 1.3490 until the U.S. Federal Reserve interest rate decision is announced (19:00 GMT). After that, the pair would either launch another attack on the support at 1.3444 or deepen the corrective phase by attacking the resistance at 1.3571.
EURGERMANY40
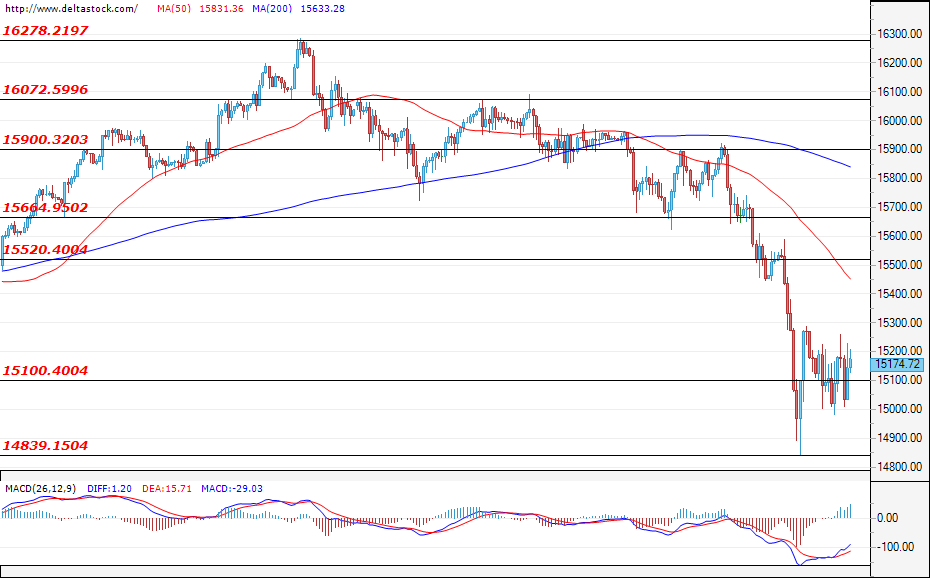
The sell-off was halted at the level of 14840 and the German index managed to recover a minor part of its losses. At the time of writing, the index is consolidating in the zone at around 15100. The expectations are for the corrective phase to continue for a couple more days and for the bears to regain control and re-test the local bottom at 14840 afterwards. In the positive direction, the first significant resistance lies at 15520, which is expected to limit the corrective phase.
US30
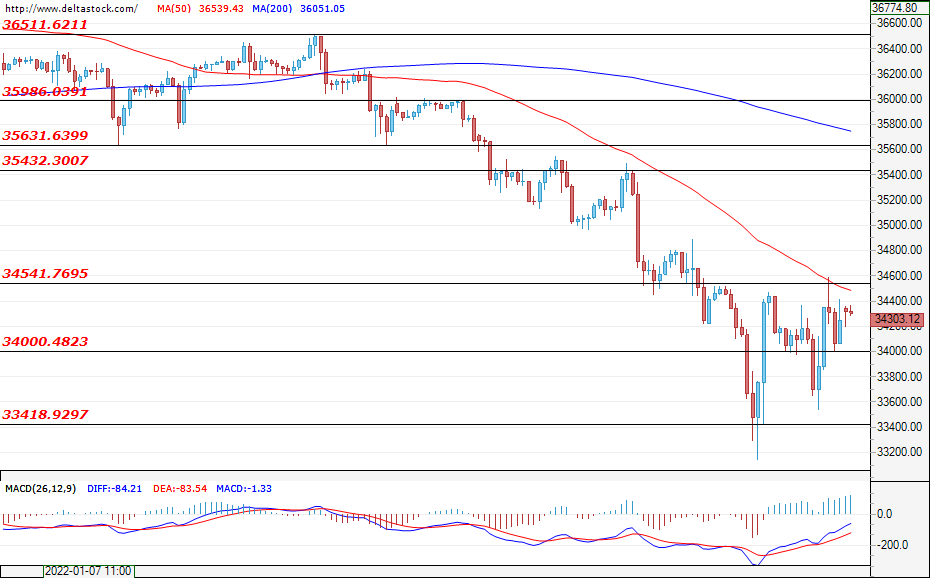
During yesterday's trading session, the U.S. blue-chip index managed to partially recover its losses from the past couple of days and, at the time of writing, is headed towards a test of the resistance level of 34541. In case the US30 manages to breach this resistance, then the recovery might continue towards the zone at around the psychological level of 35000. Alternatively, if the bears return to the market, then we could easily witness a new test of the local bottom at 33418. A spike in volatility is very likely in the last hours of the trading session when the U.S. Federal Reserve interest rate decision is to be announced (19:00 GMT).
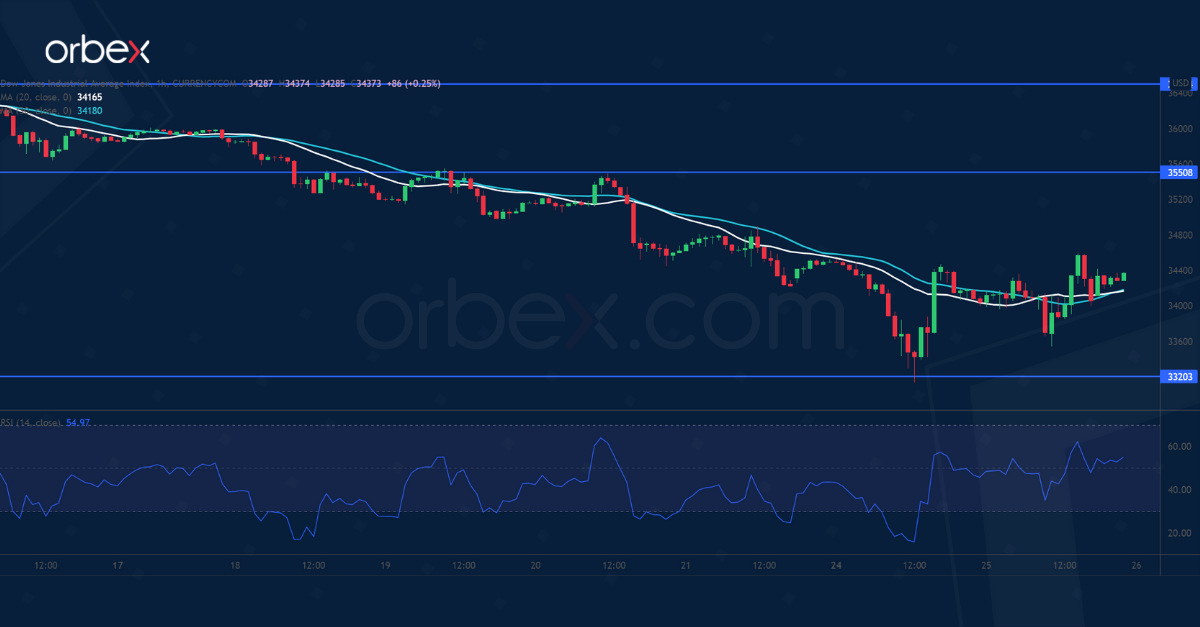
US 30 Hits Last Major Support
The Dow Jones 30 recoups losses as traders await details on the Fed’s monetary tightening.
Breaks below daily supports at 34700 and 34000 have forced buyers to liquidate in bulk. The index saw bids at last June’s low (33200) while the RSI sank into the oversold area on the daily chart. As the quote stabilizes, traders may be looking to buy the dips.
A close above 34500 may lead to 35500 which is a key supply zone from a previous breakout. A break below the daily support could trigger a broader correction in the weeks to come.
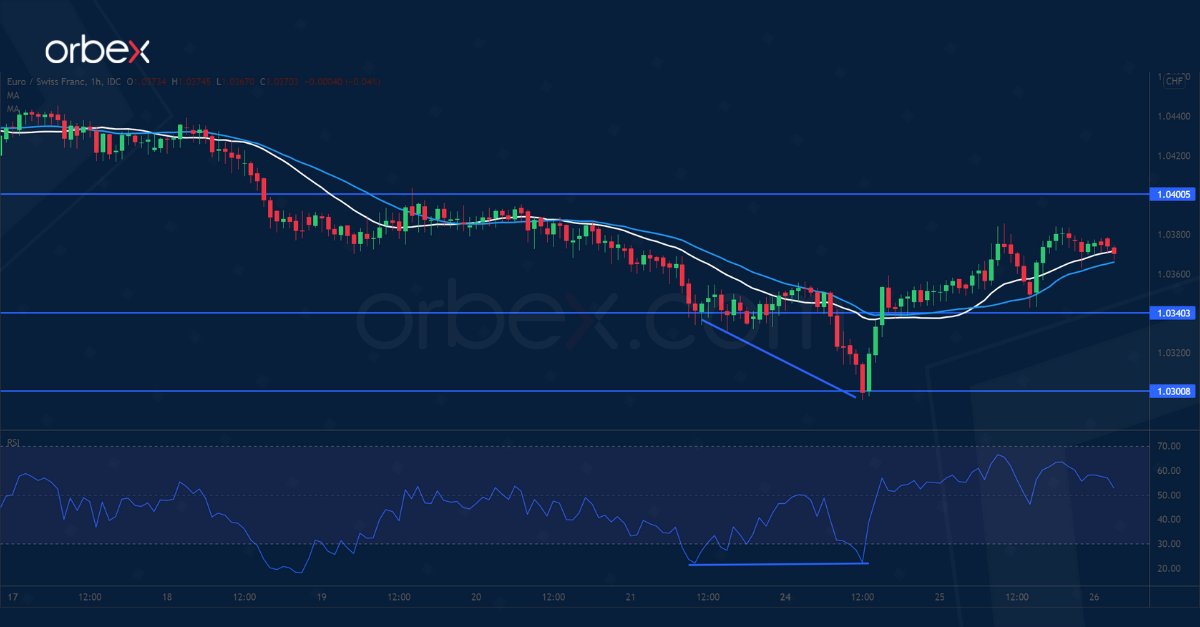
EUR/CHF Attempts Reversal
The safe-haven Swiss franc retreats as global panic selling takes a breather.
A bullish RSI divergence shows a slowdown in the sell-off momentum. Then a rally above 1.0355 has prompted some sellers to cover, taking the heat off the single currency. A bullish MA cross is an encouraging sign for a reversal.
1.0400 is the next hurdle and its breach could be a turning point for traders’ sentiment and a launchpad towards 1.0480. On the downside, 1.0340 is fresh support and then 1.0300 a critical floor to safeguard the rebound.
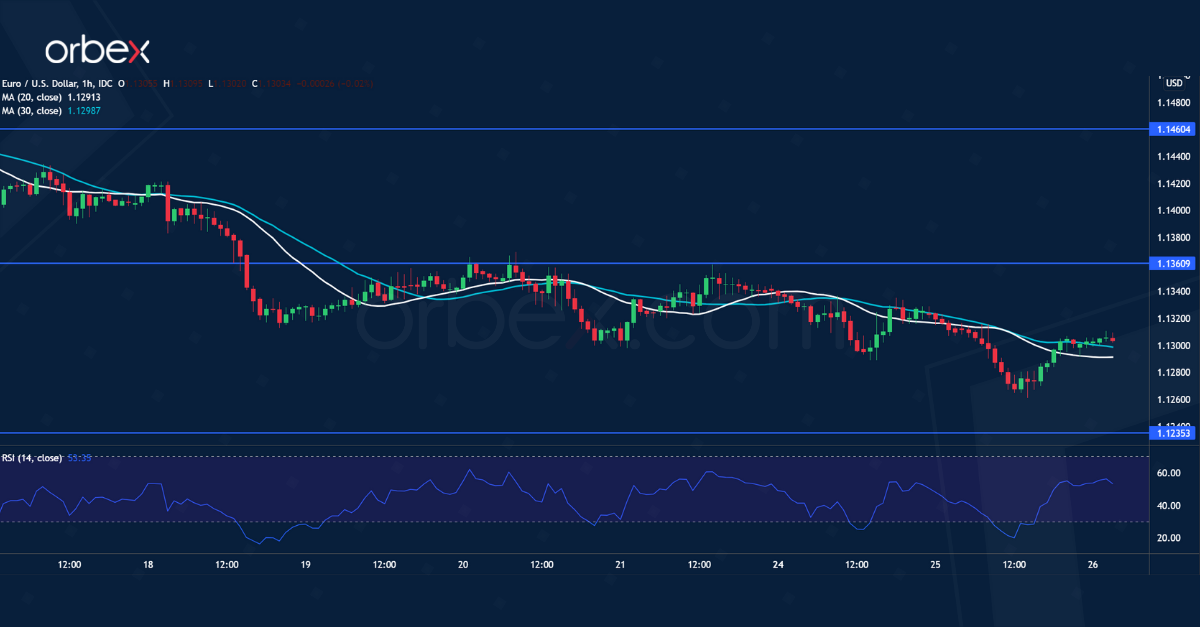
EUR/USD Grinds Daily Support
The US dollar inches lower as traders take profit ahead of the Fed meeting. The euro’s struggle to stay above 1.1360 indicates buyers’ weak interest in holding onto previous gains.
The latest rebounds have failed to clear the former support that has turned into a resistance. A break below the previous consolidation range and daily support (1.1280) could send the pair to 1.1235.
The RSI’s oversold situation attracted some buying interest. But the bulls will need to lift 1.1360 first before a reversal could become a reality.
GBP/USD Pair Broke above a Key Bearish Trend Line with Resistance Near 1.3500
The British Pound started a fresh decline from the 1.3600 resistance zone against the US Dollar. The GBP/USD pair traded below the 1.3500 level to move into a short-term bearish zone.
It traded as low as 1.3426 and settled well below the 50 hourly simple moving average. It is now correcting losses and trading above 1.3480. There was a break above a key bearish trend line with resistance near 1.3500 on the hourly chart.
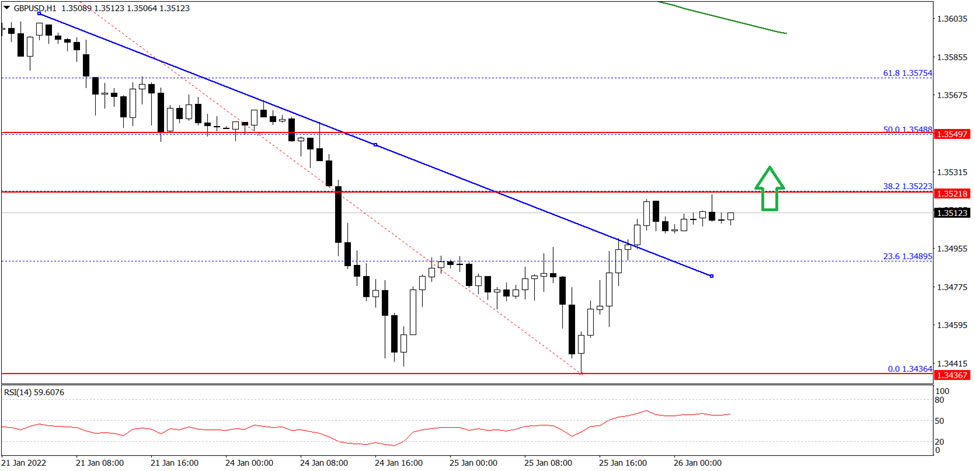
On the upside, the pair is now facing resistance near the 1.3520 zone. The next key resistance is near the 1.3550 level. Any more gains might push the pair towards the 1.3600 level.
An initial support on the downside is near the 1.3495 level. The main support is forming near 1.3480 on FXOpen. A break below the 1.3480 support level could even push the pair below the 1.3450 support.
USDCAD in a Tight Range ahead of BoC and Fed Decisions
American shares continued their volatility on Tuesday as investors waited for the upcoming interest rate decision by the Federal Reserve that will come out later today. Economists expect that the Fed will deliver a relatively hawkish decision. In it, the bank will slash its quantitative easing (QE) policy for the third month in a row and then point to a rate hike in March. Stocks were also volatile as investors reflected on the strong American consumer confidence data. According to the Conference Board, consumer confidence dropped from 115.2 to 113.8 in January. This decline was a bit better than the median estimate of 111.8. Additional data showed that the country’s home price growth slowed in November.
The Canadian dollar moved sideways in the American and Asian sessions as investors waited for the upcoming interest rate decision by the Bank of Canada. The bank is expected to leave its interest rate unchanged at 0.25%. However, like the Fed, analysts expect that the BOC will sound hawkish considering that the country’s economy is doing well. The unemployment rate has declined while inflation is rising as the ongoing supply chain challenges remain. Data published earlier this month showed that the unemployment rate declined to a pandemic-era low of 5.9% in December.
The earning season will continue today. On Monday, IBM published relatively strong quarterly results as demand for cloud computing improved. Microsoft had a similar sentiment on Tuesday after the company published strong results. However, the General Electric stock price tumbled by over 7% after the company published weak results. Similarly, Johnson & Johnson published weak revenue and higher profitability. Later today, some of the firms that will publish their quarterly results are Anthem, ADP, Freeport-McMoran, and General Dynamics, among others.
USDCAD
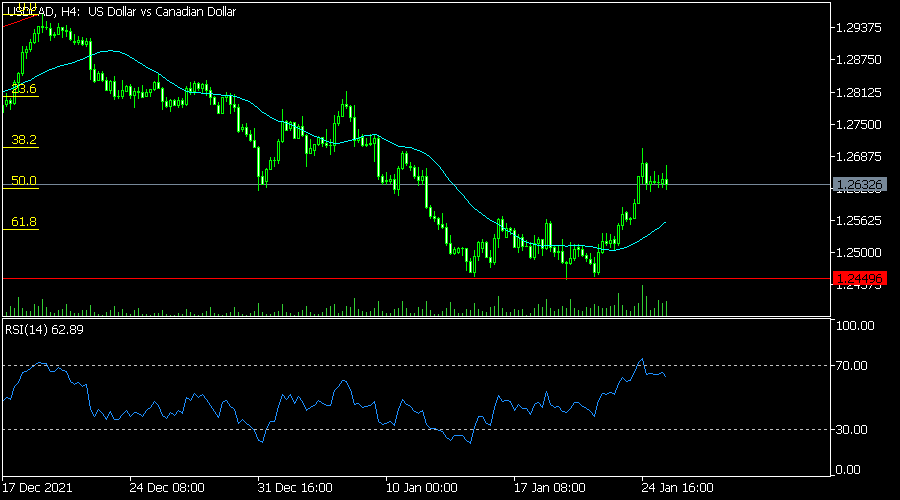
The USDCAD pair moved sideways ahead of the upcoming Fed and Bank of Canada decision. The pair is trading at 1.2623, which was slightly lower than this week’s high of 1.2700. On the four-hour chart, the pair moved to the 50% Fibonacci retracement level. It is also above the 50-day moving average. A closer look shows that the pair is forming a bullish flag pattern while the Relative Strength Index (RSI) has been in a bullish trend. Therefore, the pair will likely have a bullish breakout today.
EURUSD
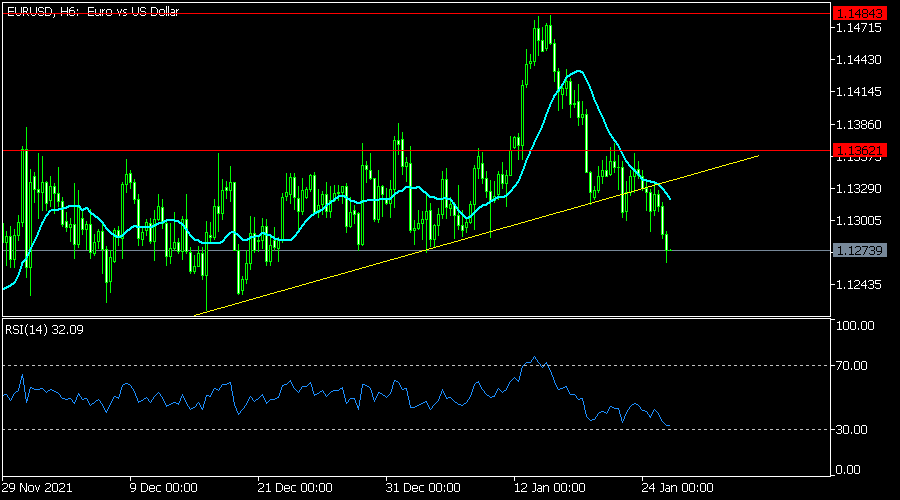
The EURUSD pair has been in a strong bearish trend in the past few days. The pair has dropped to a low of 1.1263, which was the lowest level since December last year. On the six-hour chart, the pair has moved below the neckline of the head and shoulders pattern. The moving averages have formed a bearish crossover pattern while the Relative Strength Index (RSI) has been in a bearish trend. Therefore, the pair will likely keep falling ahead of the latest Fed decision.
EURJPY
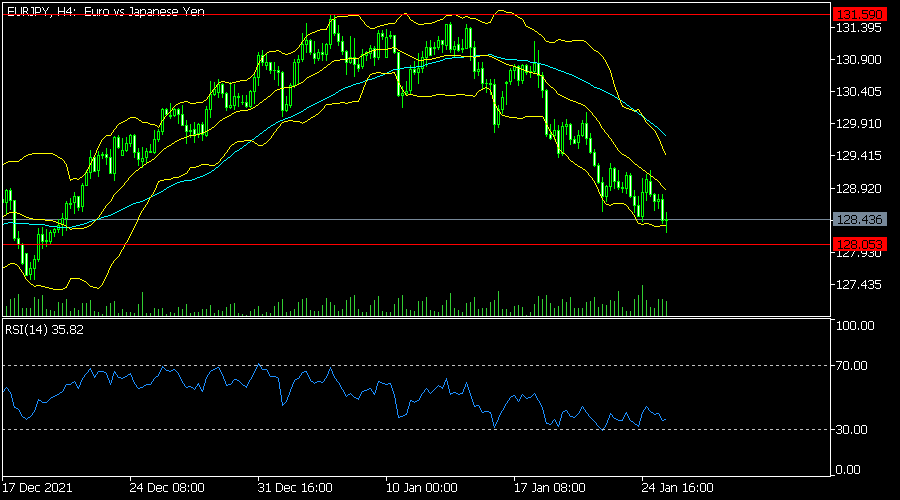
The EURJPY pair declined after the relatively strong German business confidence data. The pair is trading at 128.45, which is substantially lower than this month’s high of 131.60. On the four-hour chart, the pair is between the lower and middle lines of the Bollinger Bands while oscillators have been falling. Therefore, the pair will likely continue falling as bears target the key support level at 128.