Sample Category Title
Gold Price Extends Rally, Fed Decision Next
Key Highlights
- Gold price is gaining pace above the $1,800 and $1,820 resistance levels.
- It broke a connecting bearish trend line at $1,842 on the 4-hours chart.
- EUR/USD extended decline below the 1.1300 support zone.
- GBP/USD managed to stay above the 1.3440 support.
Gold Price Technical Analysis
After forming a base above $1,820, gold price started a fresh increase against the US Dollar. The price gained pace for a move above the $1,832 resistance zone.
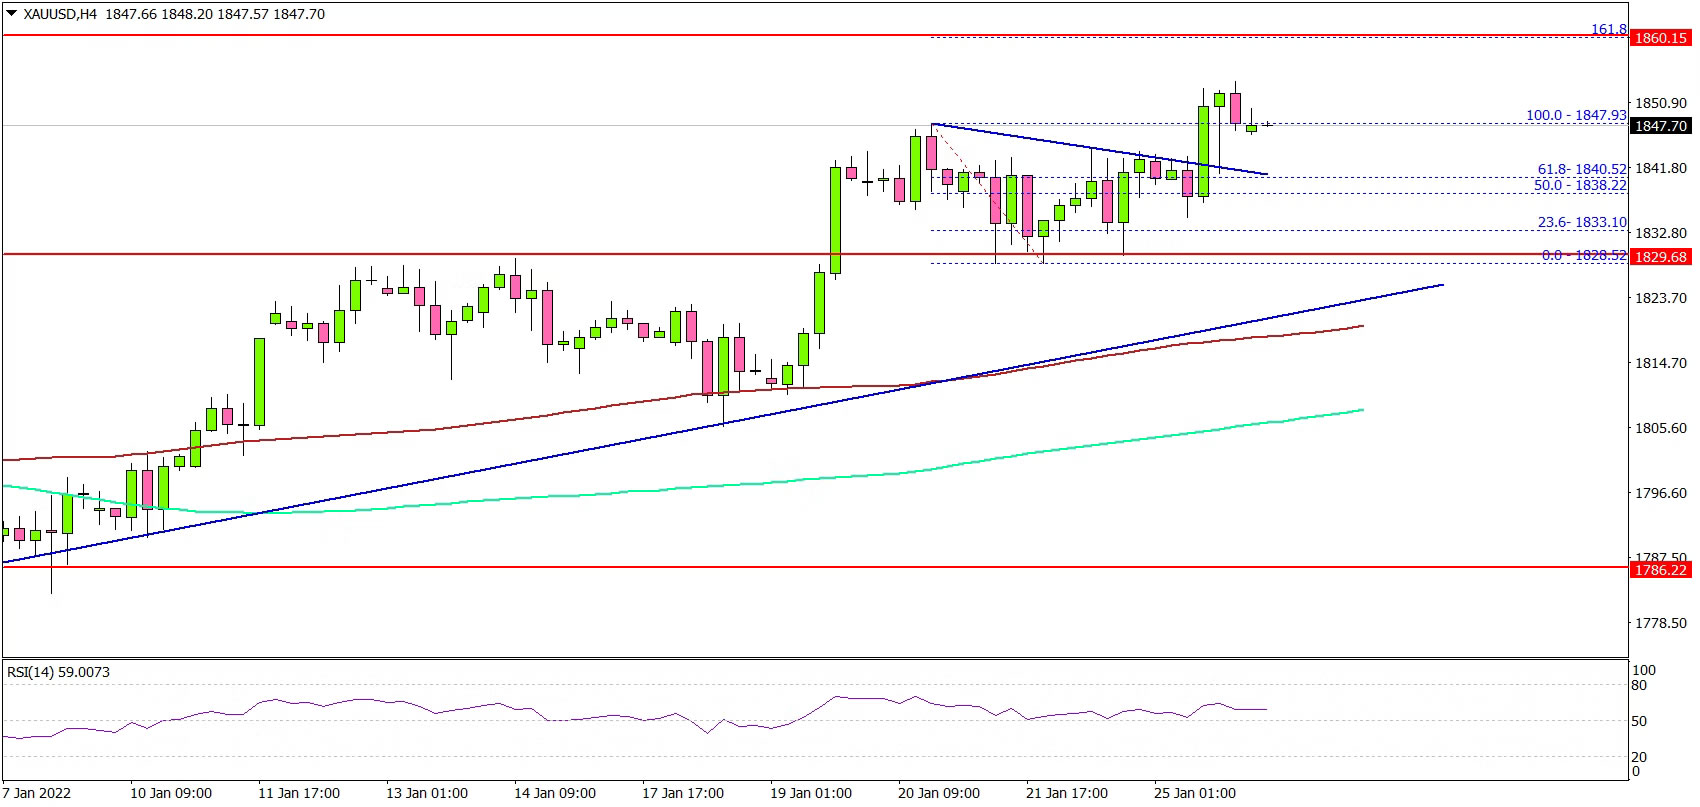
The 4-hours chart of XAU/USD indicates that the price jumped above the $1,840 level. The price settled well above the 100 simple moving average (red, 4-hours) and the 200 simple moving average (green, 4-hours).
Recently, there was a break above a connecting bearish trend line at $1,842 on the same chart. The price spiked above the $1,850 level.
On the upside, the price is facing resistance near the $1,855 level. The next resistance is near the $1,865 level. A clear break above $1,865 could send the price toward the $1,880 resistance zone in the near term.
On the downside, there is a short-term support forming near the $1,840 level. The next major support is near $1,830, below which there is a risk of a move towards $1,820. Any more losses might send the price towards $1,800.
Looking at EUR/USD, the pair failed to stay above the 1.1300 support and extended decline. Besides, GBP/USD was able to stay above the 1.3440 support zone.
Economic Releases to Watch Today
- Fed Interest Rate Decision – Forecast 0.25%, versus 0.25% previous.
- BoC Interest Rate Decision – Forecast 0.25%, versus 0.25% previous.
Fed to be a non-event, NASDAQ looks into 14k handle
Fed will more likely stick to script today and the FOMC meeting could be a non-event. It's clearly communicated that net asset purchases will end in March. Markets are expecting a 25bps hike in March too. Chair Jerome Powell is unlikely to say something that deviate from such expectations and rock the boat.
The baseline remains that there will be only three hikes, and no change would be revealed until March economic projections. Powell would also remain non-committal on the timing of balance run-off. So, these two questions would remain unanswered.
Some previews on Fed:
- FOMC Meeting Preview: Is There Still a "Fed Put"?
- Fed meeting: Will Asset Purchases End Early?
- January Flashlight for the FOMC Blackout Period
- Fed: End of Money Printing Brrrrr – (At Least) Four 25bp Rate Hikes this Year and QT in September
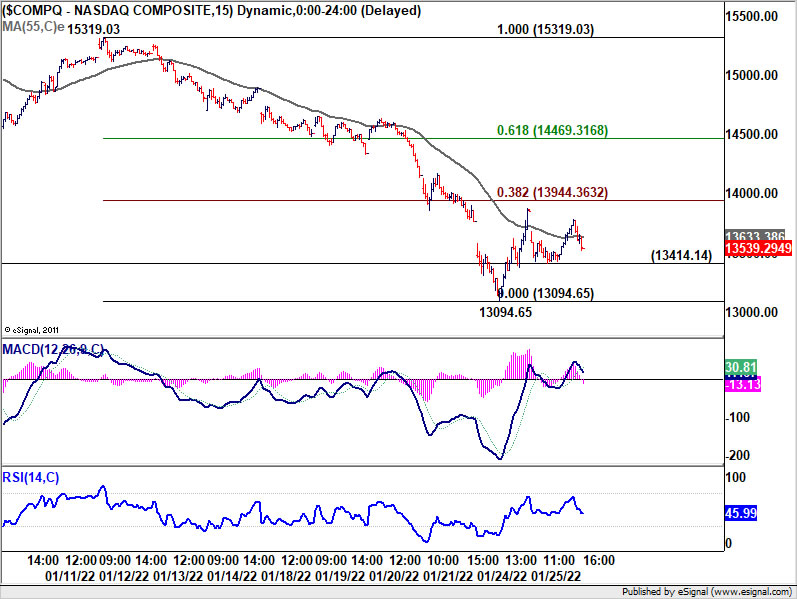
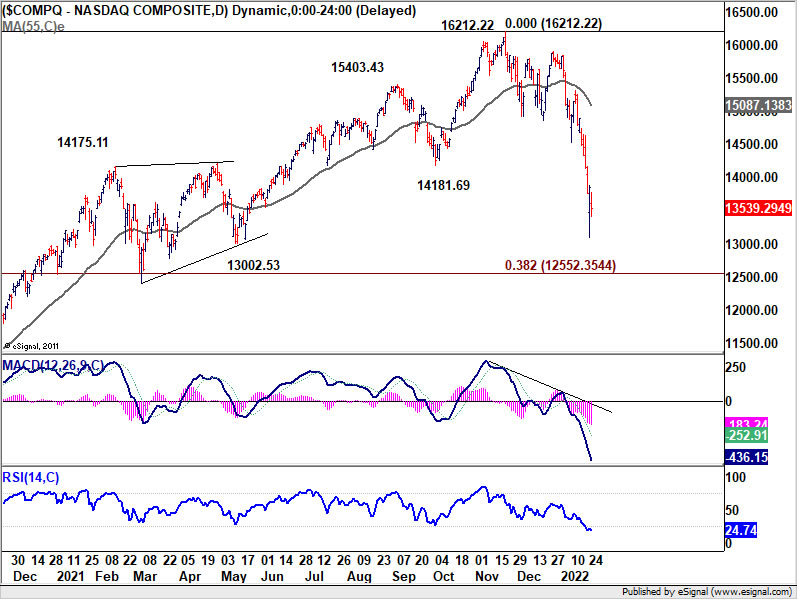
Markets will probably look more into other developments like tensions surrounding Ukraine for guidance. NASDAQ's u-turn on Monday was impressive but there was no follow through buying. For now, there is no clearly sign that the steep fall from 16212.22 is ending. The question is whether there would be slightly lengthier interim consolidations first, or the decline would resume right away.
A close above 14k, which is close to 38.2% retracement 15319.03 to 13094.65 at 13944.36, will suggest the recovery is going to last longer, and possibly further to 61.8% retracement at 14469. However, a close below 13414.14 minor support will raise the chance that free fall is coming back.
Previews on BoC and a look at CAD/JPY
The opinions on whether BoC will raise interest today are divided. Some expected the tightening cycle to start imminently, with a total of 150bps rate hike this year to 1.75%. Yet, there are conservative opinions that BoJ would wait until April to act and deliver only 75bps hikes this year.
It should be noted that BoC has mentioned before that the condition for rate hikes would be met in the "middle quarters" of 2022. But some argued that the central bank is already behind the curve on controlling inflation. With the publishing of monetary policy report and economic projections, January and April meeting are the more appropriate choice then March. But could BoC keep its hand off until April. It's a close call.
Some previews on BoC:
- BoC Policy Meeting: It's Time for a Rate Hike
- Currency Pair of the Week: USD/CAD
- Bank of Canada Preview: Is the BOC Ready to Hike Rates?
- Bank of Canada to Make Highly-Anticipated Rate Decision
- Canada: Rate Hikes Close, But Not Quite Yet
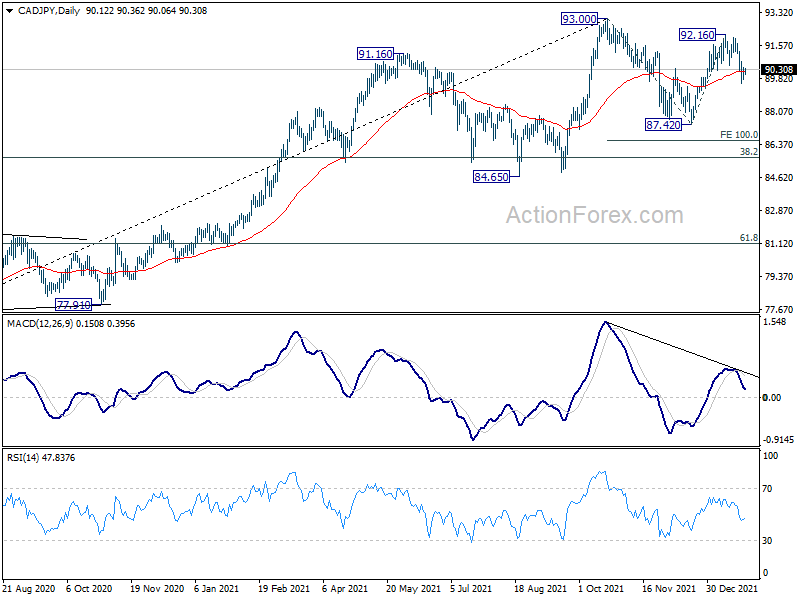
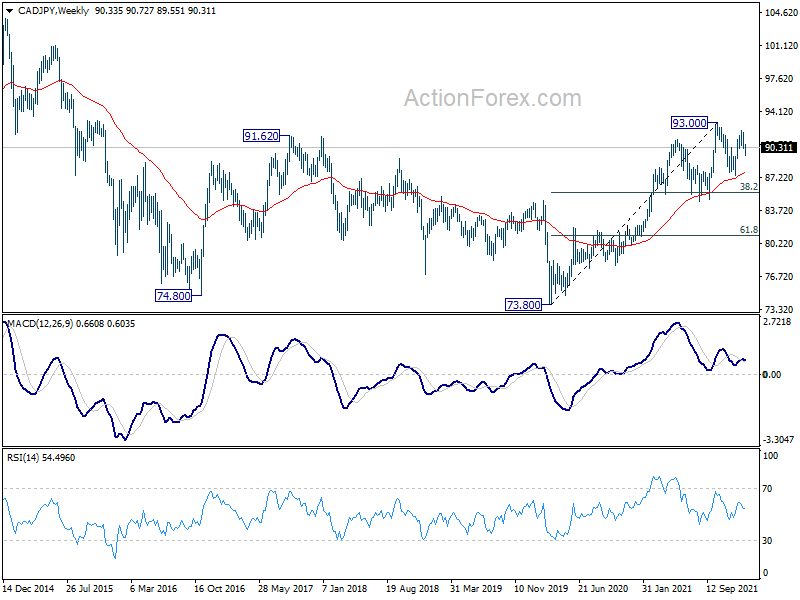
Canadian Dollar's next move will depends on all factors including BoC, Fed and overall risk sentiment. Technically speaking, CAD/JPY is now seen as in the third leg of a consolidation pattern from 93.00. Deeper fall is in favor back to 87.42, or further to 100% projection of 93.00 to 87.42 from 92.16 at 86.58. We're not expecting a break of 38.2% retracement of 73.80 to 93.00 at 85.66. On the upside, a firm break of 93.00 high is not expected for now give the overall mixed sentiment.
So the range should be set between 85.66 and 93.00. A strong breakout on either side would imply a rather dramatic underlying development.
Elliott Wave View: GBPUSD Rally May Fail in 3 Waves
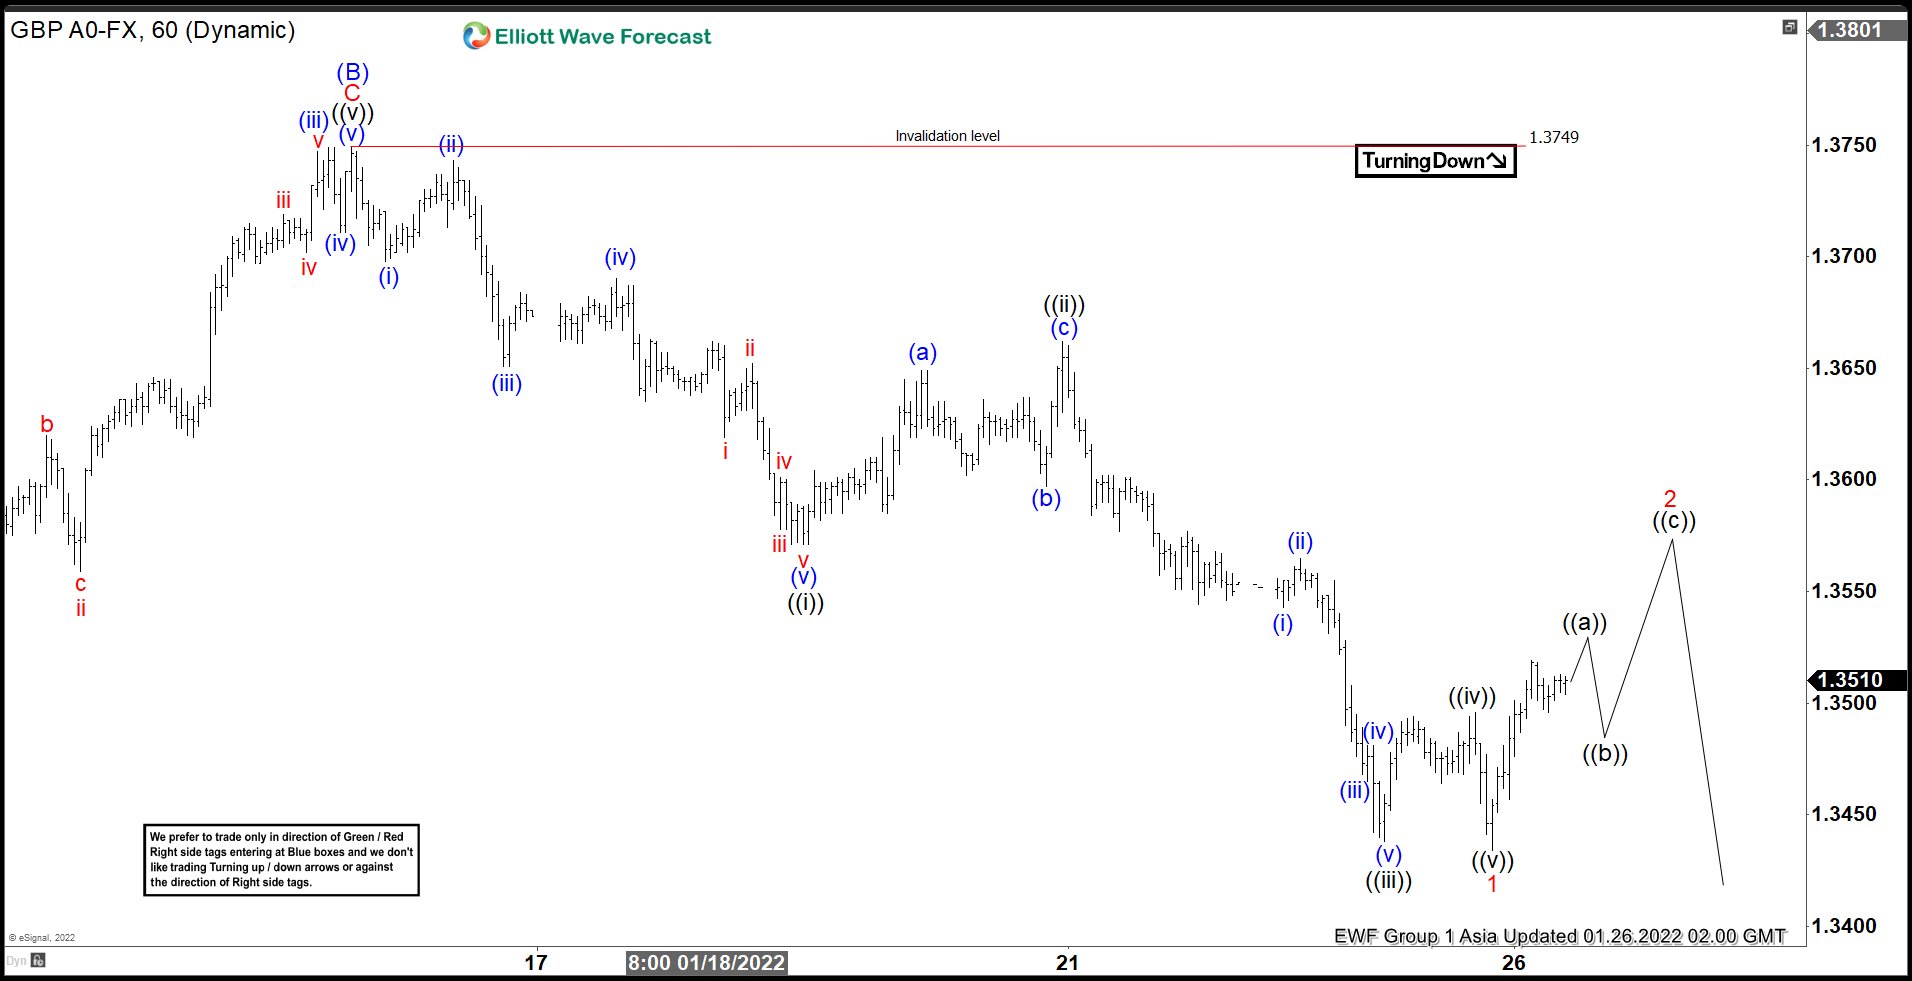
Short Term Elliott Wave view in GBPUSD suggests the rally to 1.3749 Ended wave (B). Pair has turned lower in wave (C) with internal subdivision as a 5 waves impulse structure. Down from wave (B), wave (i) ended at 1.3698, and rally in wave (ii) ended at 1.3743. Pair then extends lower in wave (iii) towards 1.3651, and bounce in wave (iv) ended at 1.3690. Final leg lower wave (v) ended at 1.3571 and this completed wave ((i)). Rally in wave ((ii)) ended at 1.3662 with internal subdivision as a zigzag. Up from wave ((i)), wave (a) ended at 1.3649, wave (b) ended at 1.3597, and wave (c) ended at 1.3662.
Pair then resumed lower in wave ((iii)) with subdivision as a 5 waves impulse. Down from wave ((ii)), wave (i) ended at 1.354 and rally in wave (ii) ended at 1.4565. Wave (iii) ended at 1.3465, wave (iv) ended at 1.3481, and wave (v) ended at 1.3438. This completed wave ((iii)) in higher degree. Bounce in wave ((iv)) ended at 1.3496, and wave ((v)) lower ended at 1.3434 which completed wave 1. Wave 2 corrective rally is now in progress to correct the cycle from January 13, 2022 high before the decline resumes. Near term, as far as pivot at 1.3749 high stays intact, expect rally to fail in 3, 7, or 11 swing for further downside.
GBPUSD 60 Minutes Elliott Wave Chart
BoJ: Economy to grow well above potential in 2022
In the Summary of Opinions at the January 17-18 meeting, BoJ said, "a pick-up in Japan's economy has become evident" and the economy is "likely to continue recovering moderately". In fiscal 2022, it's "highly likely to grow at a pace that is well above its potential growth rate".
Though, attentions should be paid to risk of COVID-19 spread in China and that could have a "negative impact on Japan's economy through downward pressure on external demand and amplification of supply-side constraints."
CPI is expected to "exceed 1 percent" and may "momentarily rise to a level close to 2 percent" from April 2022 onward. It will then be "important to analyze what lies behind this inflation and whether it turns out to be sustainable."
A member noted "the key factor in assessing the underlying trend in the CPI is developments in wages. In order for the CPI to increase as a trend, it is necessary that services prices rise along with wage increases.
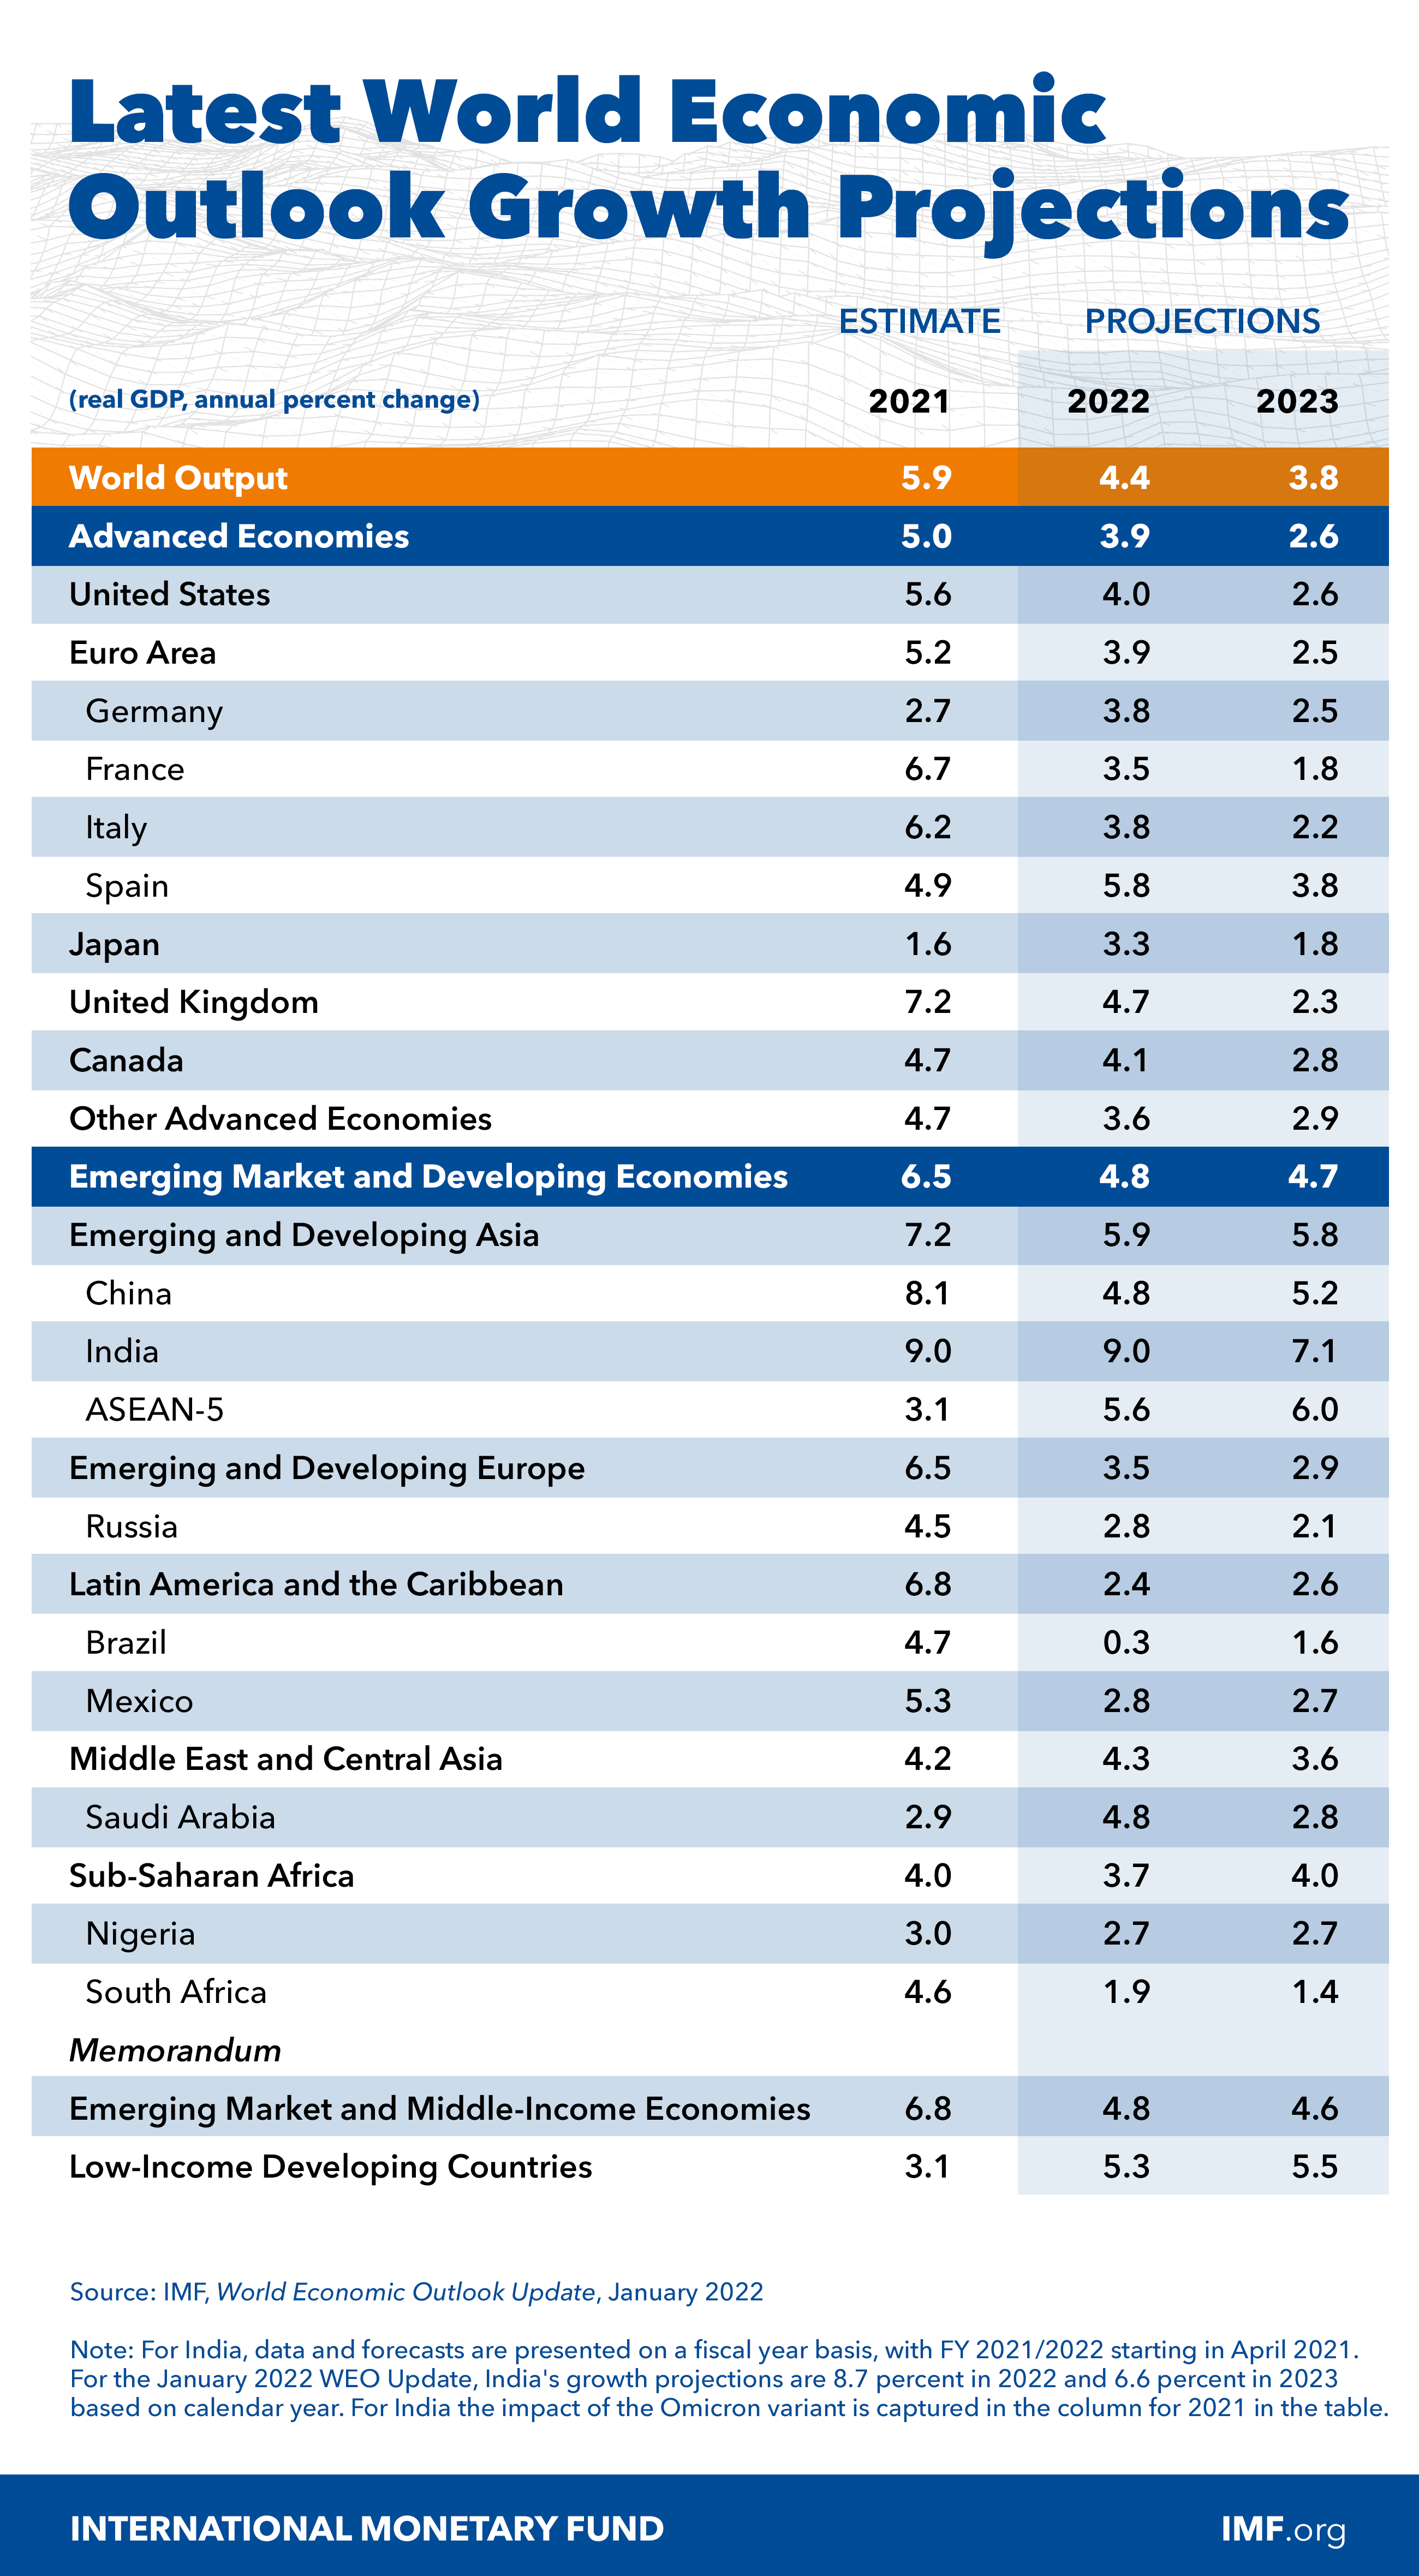
IMF downgrade global growth forecasts on Omicron, inflation, China
IMF said the global economy enters 2022 in a "weaker position" as the spread of Omicron led to reimposed mobility restrictions. Rising energy prices and supply disruptions have resulted in higher and more broad-based inflation than anticipated, notably in the United States and many emerging market and developing economies. Also, the ongoing retrenchment of China's real estate sector and slower-than-expected recovery of private consumption also have limited growth prospects.
New GDP growth forecasts:
- Global: 2022 at 4.4% (downgraded by -0.5%); 2023 at 3.8% (upgraded by 0.2%).
- US: 2022 at 4.0% (downgraded by -1.2%; 2023 at 2.6% (upgraded by 0.4%).
- Eurozone: 2022 at 3.9% (downgraded by -0.4%); 2023 at 2.5% (upgraded by 0.5%).
- Japan: 2022 at 3.3% (upgraded by 0.1%); 2023 at 1.8% (upgraded by 0.4%).
- UK: 2022 at 4.7% (downgraded by -0.3%); 2023 at 2.3% (upgraded by 0.4%).
- Canada: 2022 at 4.1% (downgraded by -0.8%); 2023 at 2.8% (upgraded by 0.2%).
- China: 2022 at 4.8% (downgraded by -0.8%); 2023 at 5.2% (downgraded by -0.1%).
NAS100 – Heading for Bear Market Territory?
Fed a big test on Wednesday
It’s been a wild ride so far this year and there may still be plenty more to come.
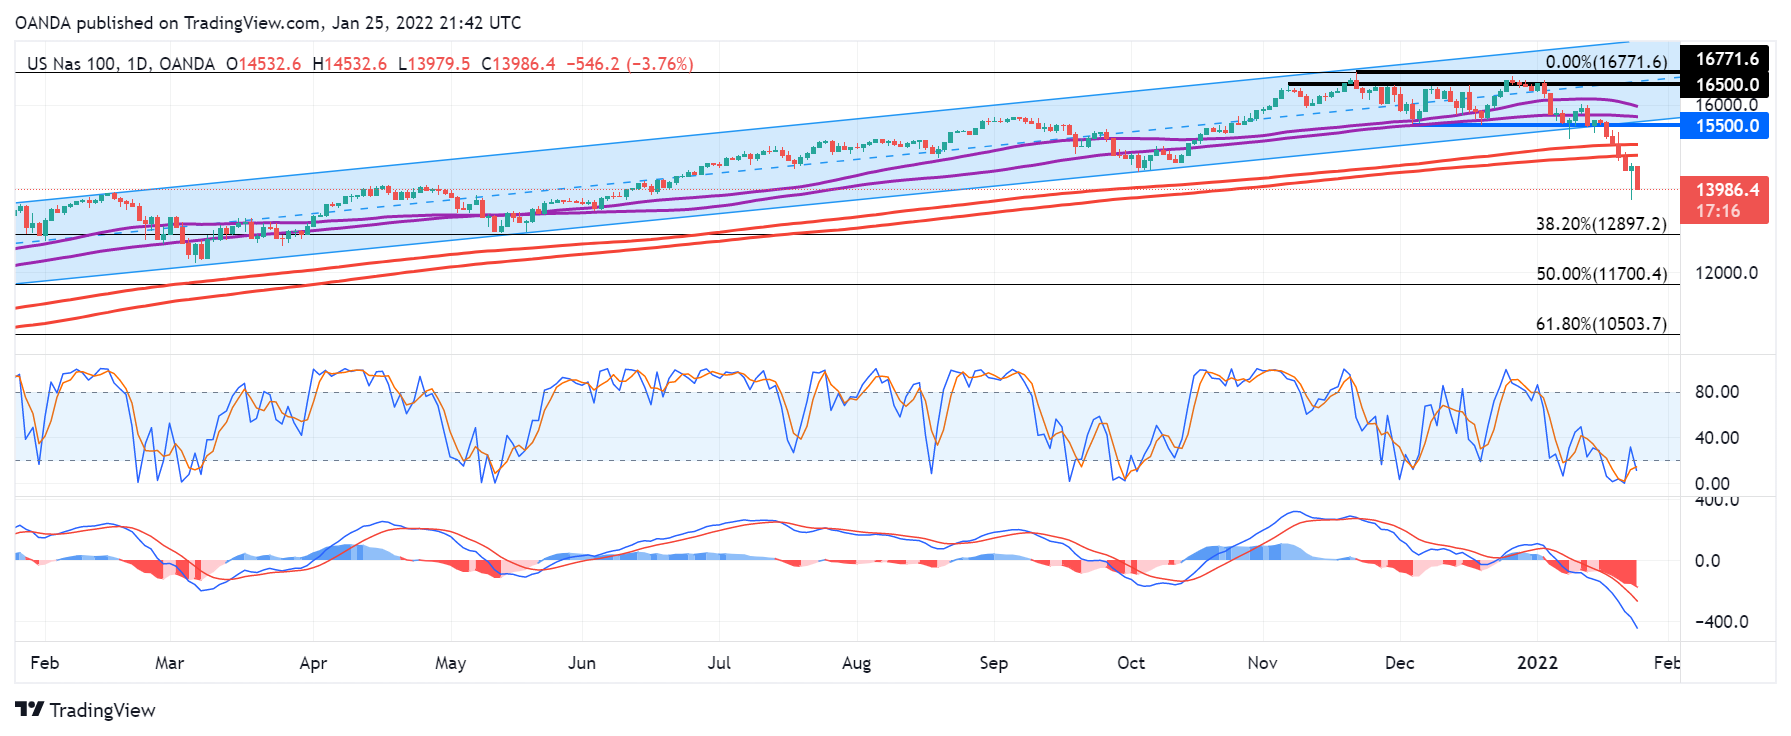
The NAS100 has smashed through key support levels on an almost weekly basis and now sits around 15% off its highs, thanks to a remarkable rebound on Monday.
The index has trended lower once more today but remains above yesterday’s lows which could be a promising signal. Turnarounds like yesterday don’t happen very often and the power of the rebound could be viewed as an encouraging signal.
Of course, we are witnessing markets where fear is dominating and that could be ramped up over the next 48 hours depending on how the Fed and big tech earnings perform.
If the NAS100 continues to slide, the momentum indicators could offer insight into whether yesterday’s rebound has slowed the sell-off, with some major levels lurking below.
The 20% correction mark – which technically leaves the index in bear market territory – falls around 13,416 – so we could see support appear around here, perhaps even a little higher given the potential psychological impact around 13,500.
Below here, the 38.2% Fibonacci retracement level – which covers the pandemic lows to highs – falls around 13,000 which will make that a major test.
Whether we get that far is hard to say but what we’ve seen so far this week suggests there may be plenty more volatility to come.
Gold Market Awaits FOMC Meeting
Gold’s price moved higher for the second consecutive week ending 23rd of January, while it remains in positive territory in the current. Gold traders may be in rather excited state, as economic data released in the following days have the potential of increasing volatility substantially. This week’s report will focus on some important fundamental developments that could be behind Gold’s recent price action. The information presented in this report can be used to form accurate decisions on the Gold market while our technical analysis at the end will assist traders with important price levels to keep in mind.
Among Gold’s top characteristics is that the precious metal tends to increase in value during periods of economic risk and geopolitical uncertainty. On the 19th of January, Gold performed a rather significant day upwards, as its price gained approximately $28 reaching a new monthly high. In our opinion, the current tensions on the Ukraine border with Russia building a number 100K troops, seems to be keeping traders on the edge and lifting the Gold market higher. The fact that the US and Europe are already involved and preparing for an event to take place, can be evidence that the world stage is currently on top of the matter and can be affected by any military tensions. Gold prices not only jumped but also stabilized higher indicating the market may need more information prior to making changes to orders. Even today, headlines on a number of televised media sources stated that the escalation of the matter is ongoing. We would suggest Gold traders keep an eye on the subject as the tensions could possibly send Gold prices higher.
On a separate note, the ongoing spread of the omicron variant continues to strain economies around the world. The rising infection rates observed in January, can be keeping more workers sidelined at the moment, creating difficulties with production and distribution of goods. Preliminary US Markit PMI Manufacturing and Services figures for January where down as indicated in the past days, possibly as a result of the pre mentioned while supply could be impacted in the short term. However, the positivity on this front seems to be that consumers demand remains strong pushing prices higher. In this case Gold’s recent upward movement could have also been triggered due to its nature as a hedging instrument that counters higher prices.
On Wednesday the 26th of January, the FOMC meeting stands out as the star event of the week. The meeting consists of the FOMC Statement and the Interest Rate decision that will be announced simultaneously, while the FOMC press conference with Jerome Powell’s remarks, will follow 30 minutes later. Comments on the uncomfortably high inflation rates are expected to be of particular interest to analysts and traders. With inflation rates seemingly getting out of hand, the matter is currently a priority for the FOMC and may even force the Fed to take consistent action throughout the current year in order to bring the rates lower. This maybe a promise for a rollercoaster ride for the markets but also for Gold as its sensitivity to changes in monetary policy may be displayed. Overall, Wednesday’s event is much anticipated, as the FOMC could confirm the market’s expectations for the central bank’s first rate hike in 2022, which is forecasted to be in March. Caution is advised as Gold’s price action can be undertaken by temporary large swings throughout the event. Finally, in the farfetched scenario of an unexpected rate hike, volatility in the Gold market could rise abruptly and traders are cautioned to make adjustments to protect their accounts.
Looking towards the following days, the economic calendar is pact with a number of releases that can be useful to Gold traders as they may create opportunities. As noted, the FOMC meeting on the 26th for January stands out, while on the 27th we get the US GDP Advanced and the Core PCE Prices Advance rates both for Q4, along with the Initial Jobless claims figure for the week. On the 28th we get the Core PCE Price Index rate for December and the Final University of Michigan Sentiment for January. Finally, on the 1st of February we get the very important ISM Manufacturing PMI figure for January.
Technical Analysis
XAU/USD H4
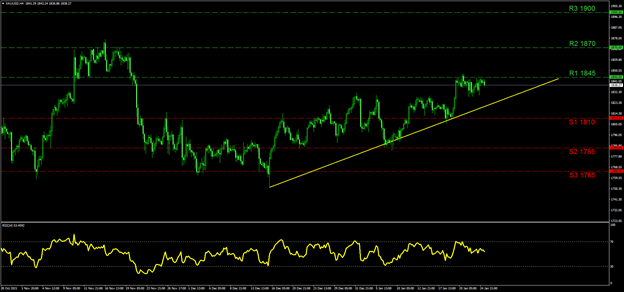
At the moment, Gold is currently in an upward trend line which has commenced since the 15th of December. The upward trend is highlighted with the ascending line colored with yellow on our chart. The price action at the moment remains stable close to the (R1) 1845 resistance level, while this level remains the top so far in January. If the trend upwards persists then the (R2) 1870 which was a top level back in November, could become a target for buyers. The highest resistance is the (R3) 1900 line which can be a great challenge for the bulls, as it was not breached since the previous June and can be used in the scenario of an extended buying strategy. If the bears take over, then the (S1) 1810 support level can be engaged first as it was in the previous week. Lower we note the (S2) 1785 line that was tested various times from mid-December to the 7th of January. At the end the (S3) 1765 which was used as a support level in December, can be used if the bears take extensive action and dominate the scene. The RSI indicator remains nearby 50 on the four hour chart and we believe this can be a sign that traders may be in a wait and see position for the events to be released in the following days.
European Stocks Likely to Outperform Wall St
Before discussing the potential for European markets to outperform, the key question right now is when will the markets bottom out? Also: what ever happened to Turnaround Tuesday?
Well, technically, the day hasn’t ended, so there’s still hope for the bulls.
The markets turned sharply off their lows late in the day on Monday, before resuming lower in overnight trading. But so far today we are yet to any signs of a more meaningful recovery, suggesting Monday’s rebound was driven mainly by short-covering. So, are we going to remain in a more protracted downward trend, or will dip buyers step back in later?
Powell, tech earnings and the economy
Insofar as Wall Street is concerned, there isn’t going to be an awful lot to concentrate on in terms of macroeconomics today, but the Fed is meeting tomorrow. All the focus will be on whether the US central bank and its president will be able to save the markets. He could tone down his hawkishness in light of the big stock market sell-off. But how likely is that? I certainly don’t expect to see too much of a walk back from Powell on the Fed’s hawkish intentions.
Thus, if stocks were to make a comeback, it would have to be because of optimism about the economy or company earnings.
On the latter front, we do have more tech earnings to look forward to, with Microsoft and Texas Instruments to report their results after the bell tonight; Tesla and Intel to follow tomorrow night, and Apple on Thursday. These companies better deliver some positive surprises to at least slow down the tech rout.
European markets could cheer stock market bulls
Meanwhile, optimism about the economic recovery should help some of the other sectors of the stock market. I am leaning more towards Europe, because here the markets have not rallied to the level of craziness that was consistently observed on Wall Street all these years.
European markets have a lot of catching up to do in that regard. What’s more, with the ECB going to keep printing more QE money for longer, this should support the markets relatively more than on Wall Street, and other regions where such support is no longer available. Furthermore, travel restrictions continue to ease as omicron cases decline and more people get double or tripled vaccinated. There is a lot of pent up demand for holidays within Europe. Hopefully, we will see confidence returns and people start going on holidays more often this year. So, I certainly am feeling positive towards the European stock markets compared to Wall Street.
DAX testing massive support area
Speaking of European markets, the DAX is testing a massive area of support here around the 15K zone:
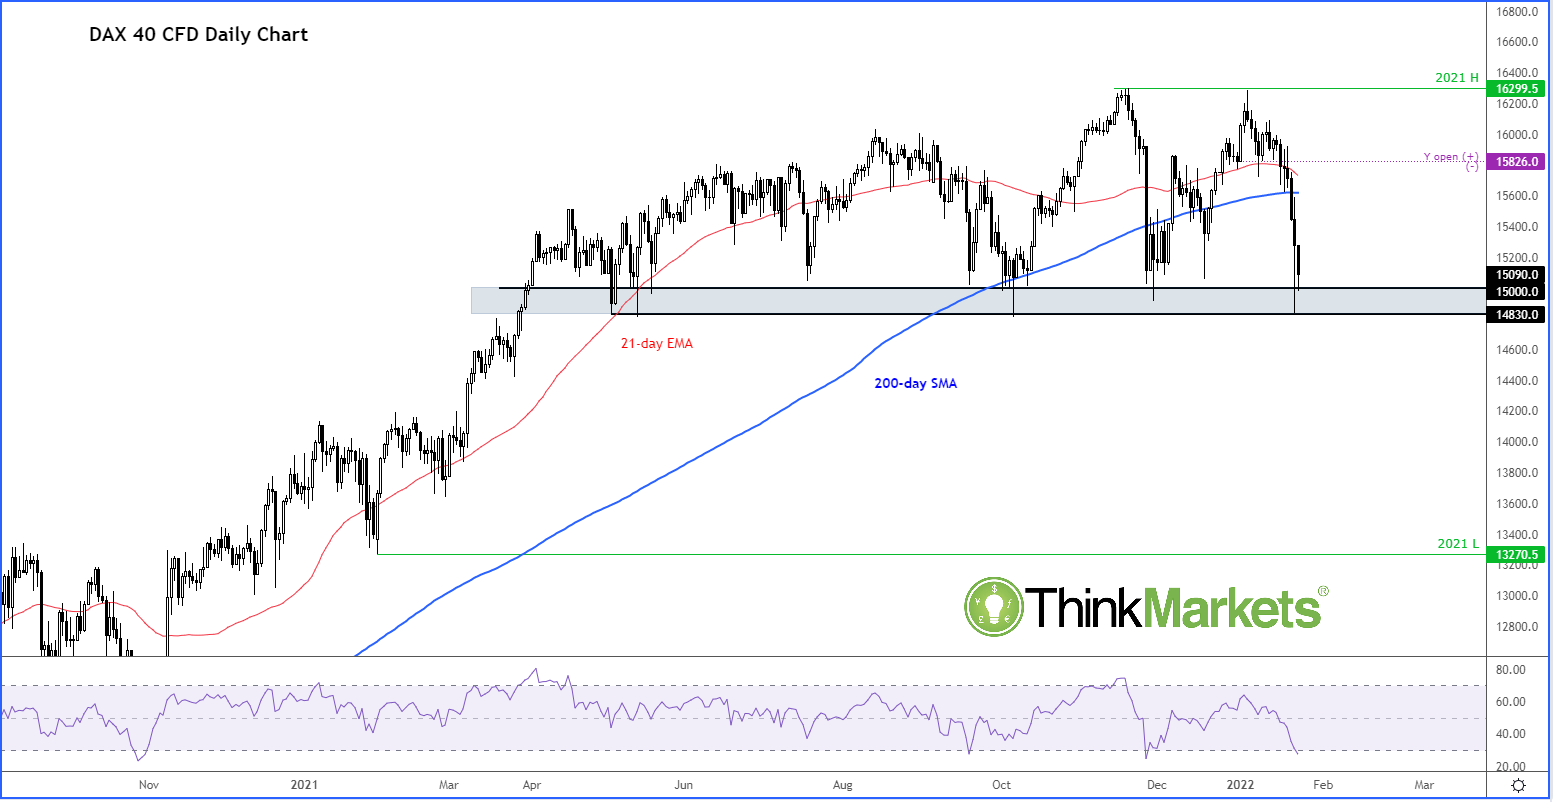
Will the dip buyers once again step in to defend their ground here, given the above macro considerations and the fact that the RSI is at “oversold” levels of <30 on the daily time frame? However, a closing break below this area would nullify the bullish argument until we see another reversal signal at lower levels.
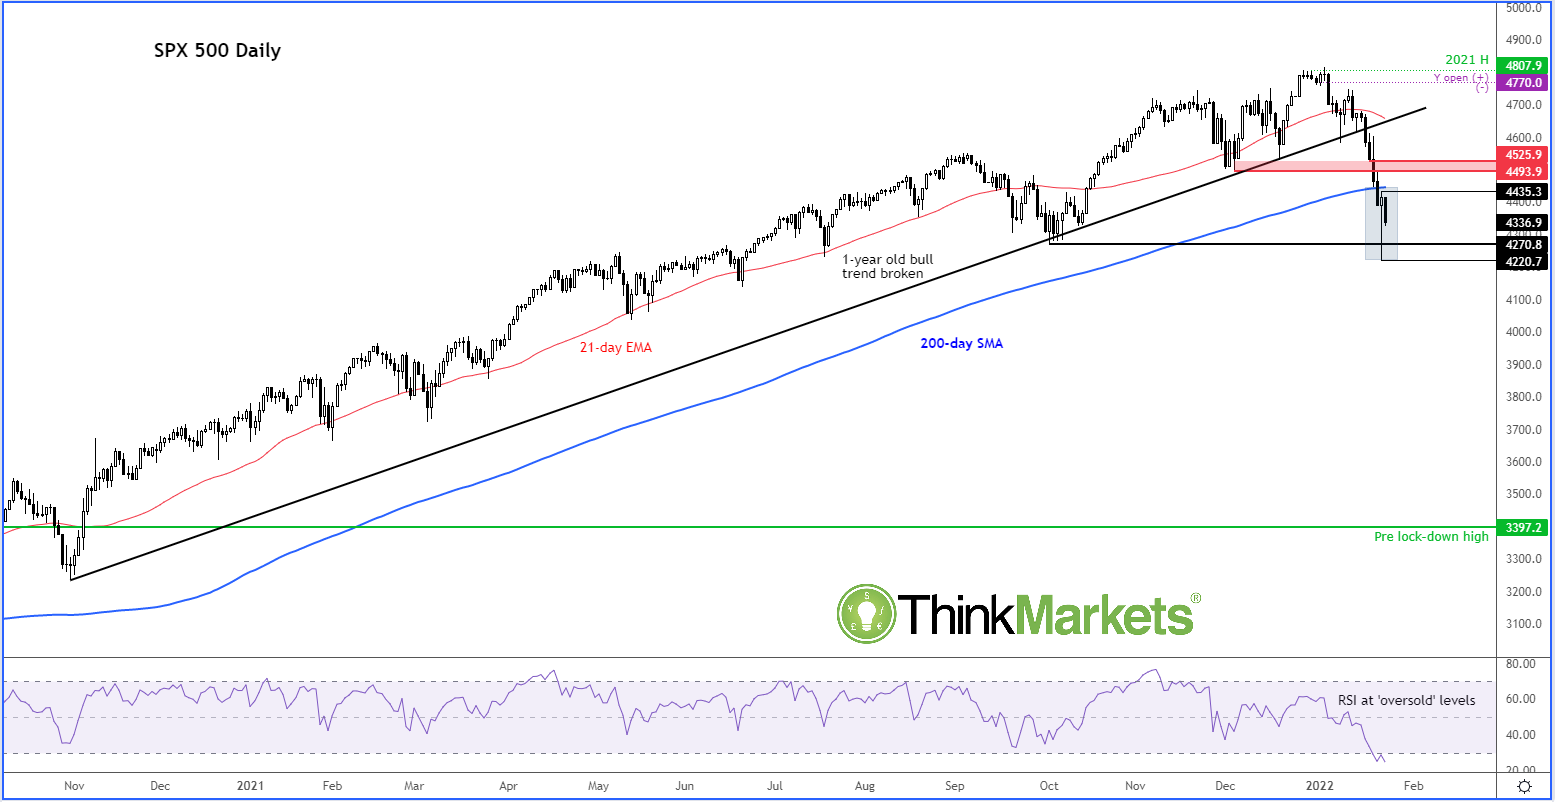
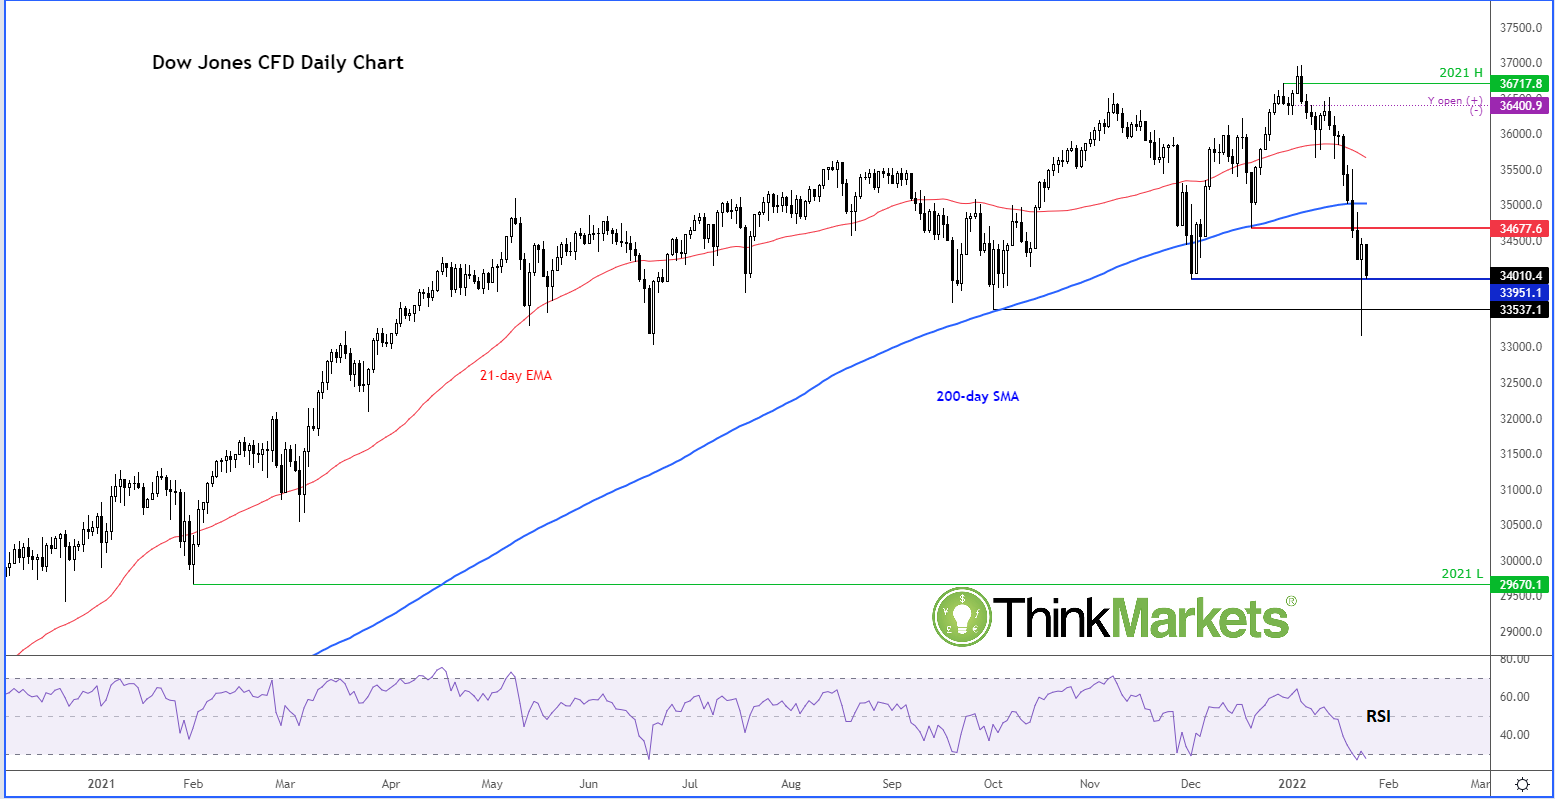
Meanwhile, the major US indices have printed possible reversal signals (hammer candles on daily) but need to see some follow-through: