Sample Category Title
US Inflation in Focus as Traders Price Faster Fed Hikes
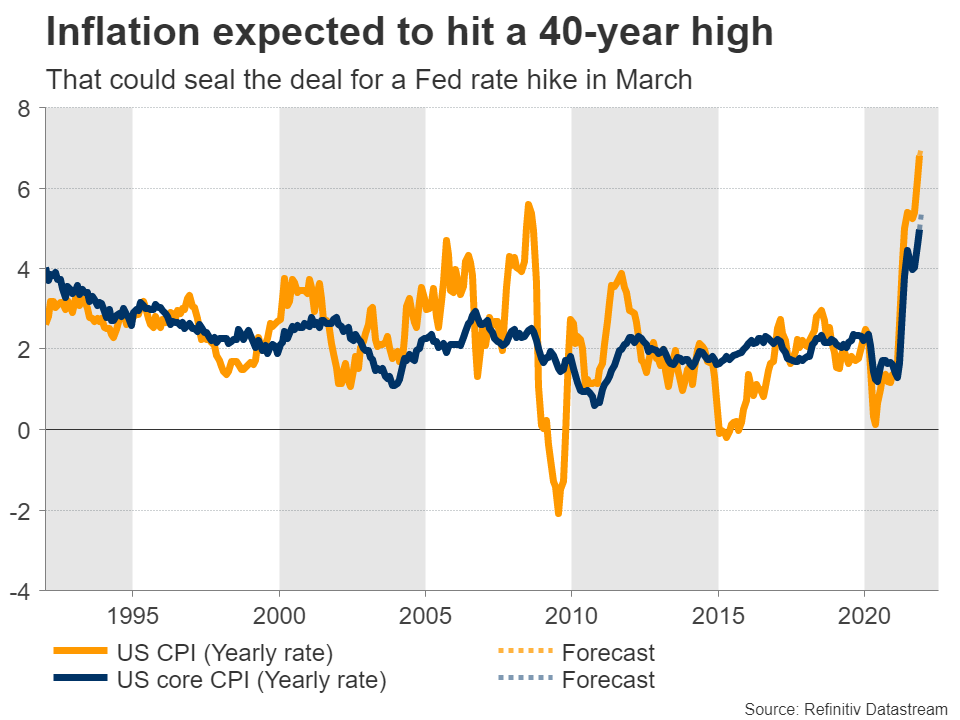
The latest US inflation data will be published on Wednesday at 13:30 GMT, ahead of the retail sales report on Friday. Consumer prices are expected to have risen at the fastest clip in 40 years, which could seal the deal for a Fed rate hike in March. That said, there is scope for disappointment in the spending numbers, so it could be a rollercoaster ride for the dollar.
Fed gets rolling
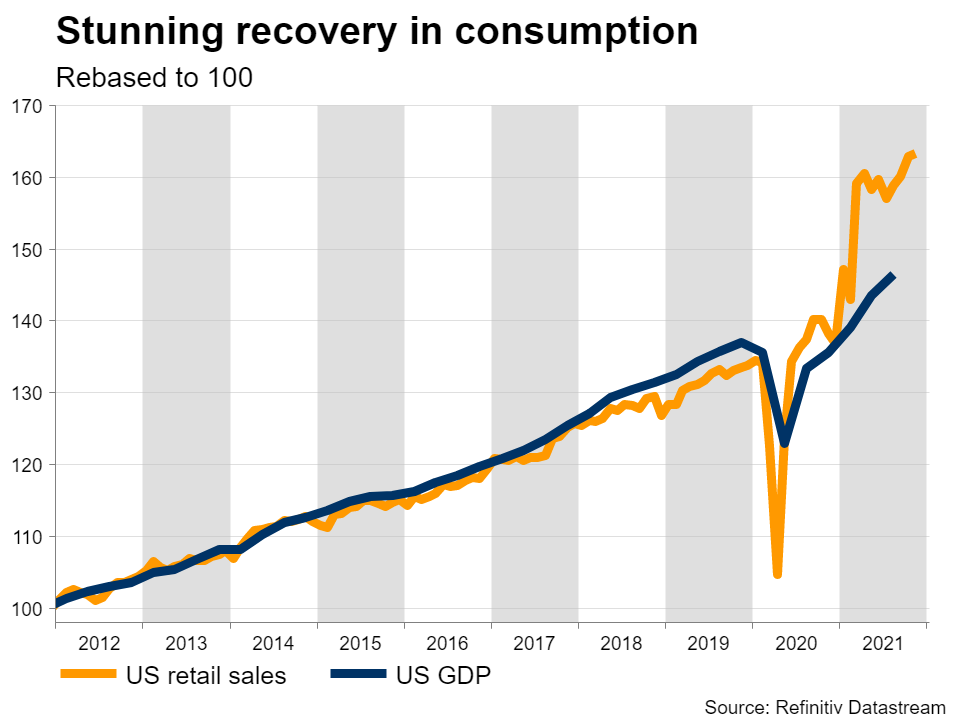
The US economy is firing on all cylinders. Consumption has been incredibly strong, economic growth in the last quarter is seen at 6.8% according to the Atlanta Fed’s GDPNow model, and the labor market is approaching full employment with impressive speed.
Most importantly, wage growth has fired up. When the Fed sees a tight labor market and accelerating wages, the conclusion is that this could lead to a wage-price spiral that feeds inflationary pressures. Since inflation is extremely hot already, Fed officials want to avoid that outcome. The solution is to tighten monetary policy.
As such, traders have brought forward the expected timing of Fed rate increases lately. The implied probability for a rate hike in March currently stands at 90%. In total, markets are pricing in three rate increases this year and equal odds for a fourth one.
Inflation to heat up
On the data front, forecasts suggest the annual CPI inflation rate hit 7% in December, up from 6.8% in November. The core rate that strips out volatile items like energy and food is expected to have risen to 5.4%, from 4.9% previously.
These projections are supported by the Markit PMI surveys, which showed that selling prices by companies “rose steeply”, although at the slowest pace in three months. That’s in line with the forecasts for the monthly CPI print.
Turning to retail sales, the tea leaves point to disappointment. The retail control group - which is used in GDP calculations - is expected to have risen by 0.1% on a monthly basis. However, credit card spending data from Bank of America and JP Morgan suggest a far weaker number, possibly negative, as worries around Omicron dampened consumption.
Dollar rollercoaster ahead
As for the dollar, it could be a volatile week. A strong inflation report may seal the deal for a rate hike in March and boost the reserve currency, before a potential disappointment in retail sales wipes out some of the gains.
In the bigger picture, the outlook remains bright over the next few months. The economy is booming and there’s still room for markets to price in a fourth rate increase for this year. Beyond rate hikes, the Fed’s plans about shrinking its balance sheet could be an additional force that supports the dollar against low-yielding currencies like the yen.
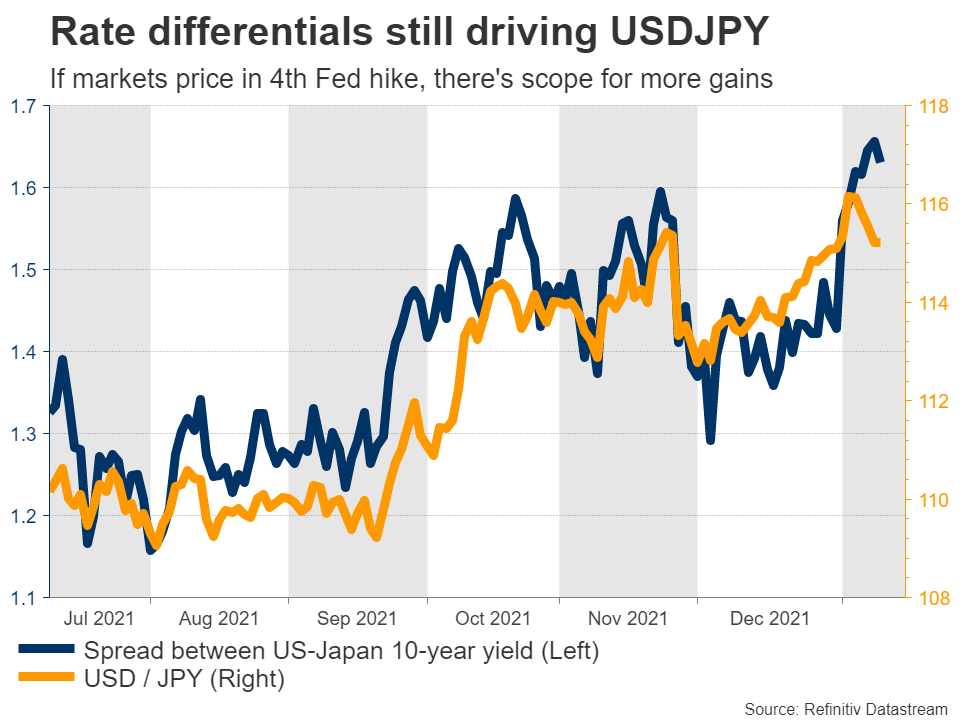
The main risk to this view would be any signs that inflation has peaked moving forward. If investors sense the heydays of inflation are behind us now that energy prices are stabilizing and government spending is fading, they could dial back bets for Fed tightening. But that’s probably a story for April or later, as that’s when the year-over-year comparisons in inflation become much tougher.
Taking a technical look at dollar/yen, if the bulls manage to pierce above the 5-year high of 116.30, the next barrier to provide resistance may be 117.80, which was the inside swing high of December 2016.
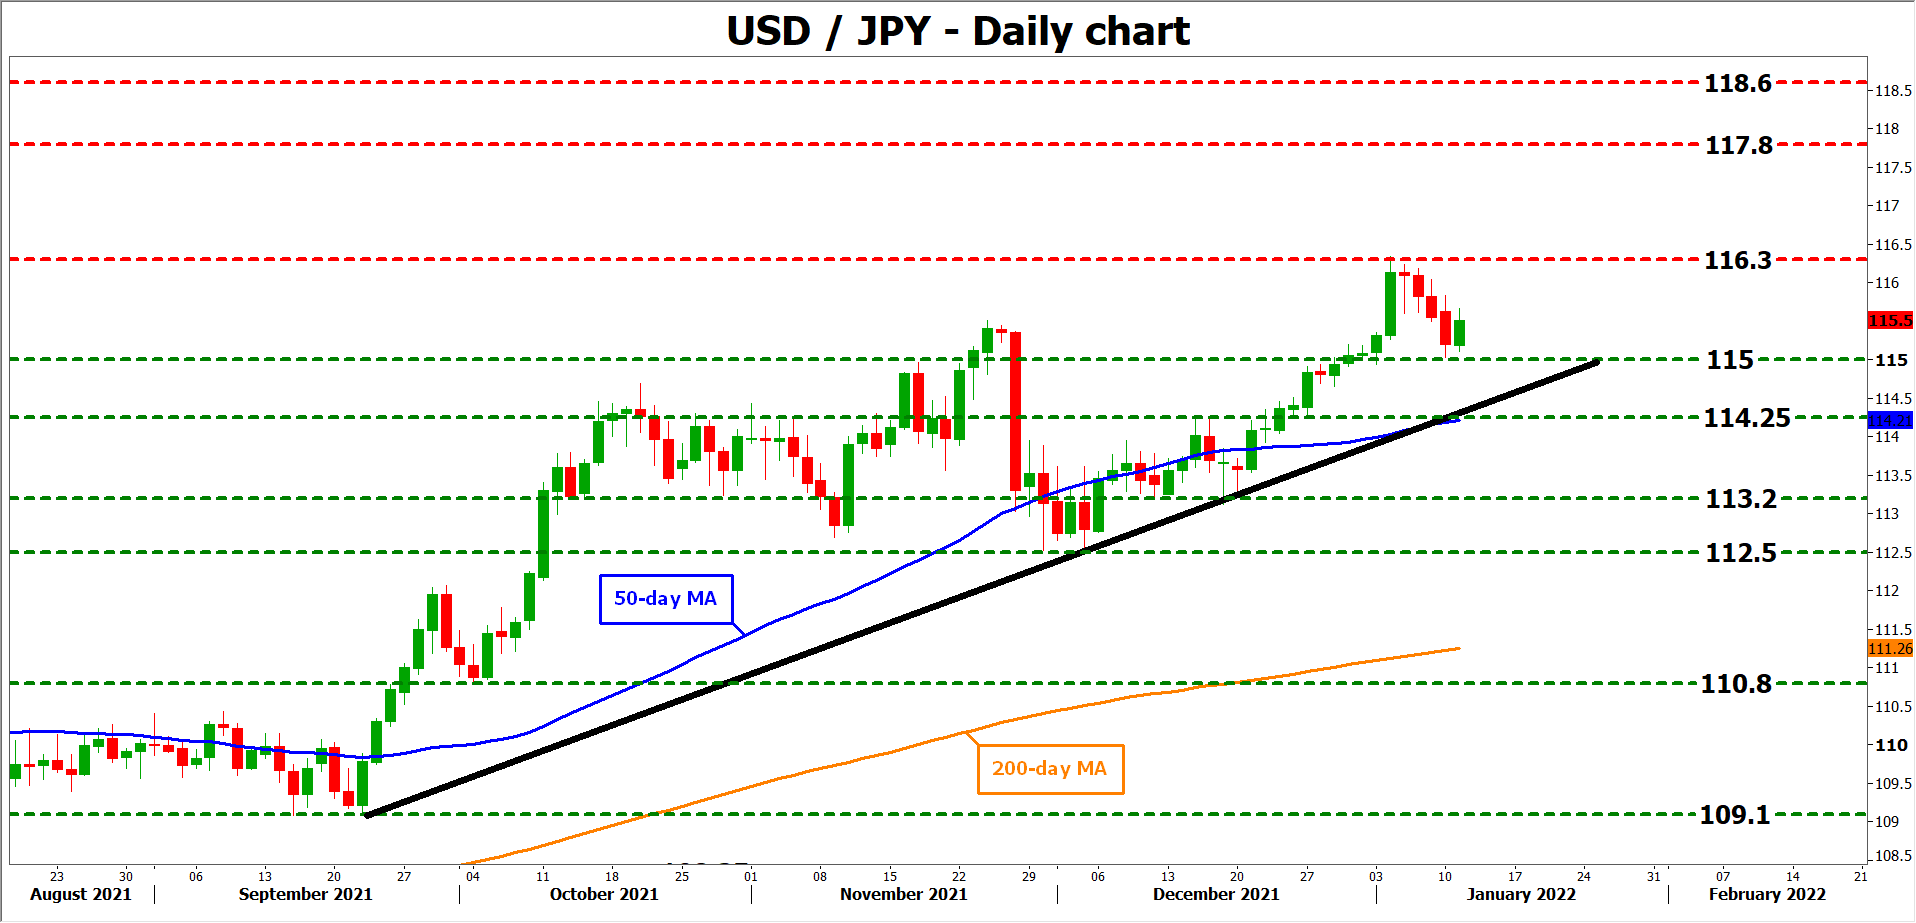
On the downside, initial support to declines may be found at 115.00. A potential violation would turn the focus to 114.25, a region that overlaps with the 50-day moving average and the uptrend line drawn from the September lows.
AUD/USD Faces Key Resistance at 0.7200, US CPI Next
Key Highlights
- AUD/USD started a downside correction from 0.7270.
- It traded below a key bullish trend line with support near 0.7200 on the 4-hours chart.
- EUR/USD is still struggling below 1.1380, and GBP/USD is trading well above 1.3500.
- The US CPI could increase 7% in Dec 2021 (YoY), up from 6.8%.
AUD/USD Technical Analysis
This past week, the Aussie Dollar attempted an upside break above 0.7250 against the US Dollar. However, AUD/USD struggled near 0.7270 and recently corrected lower.
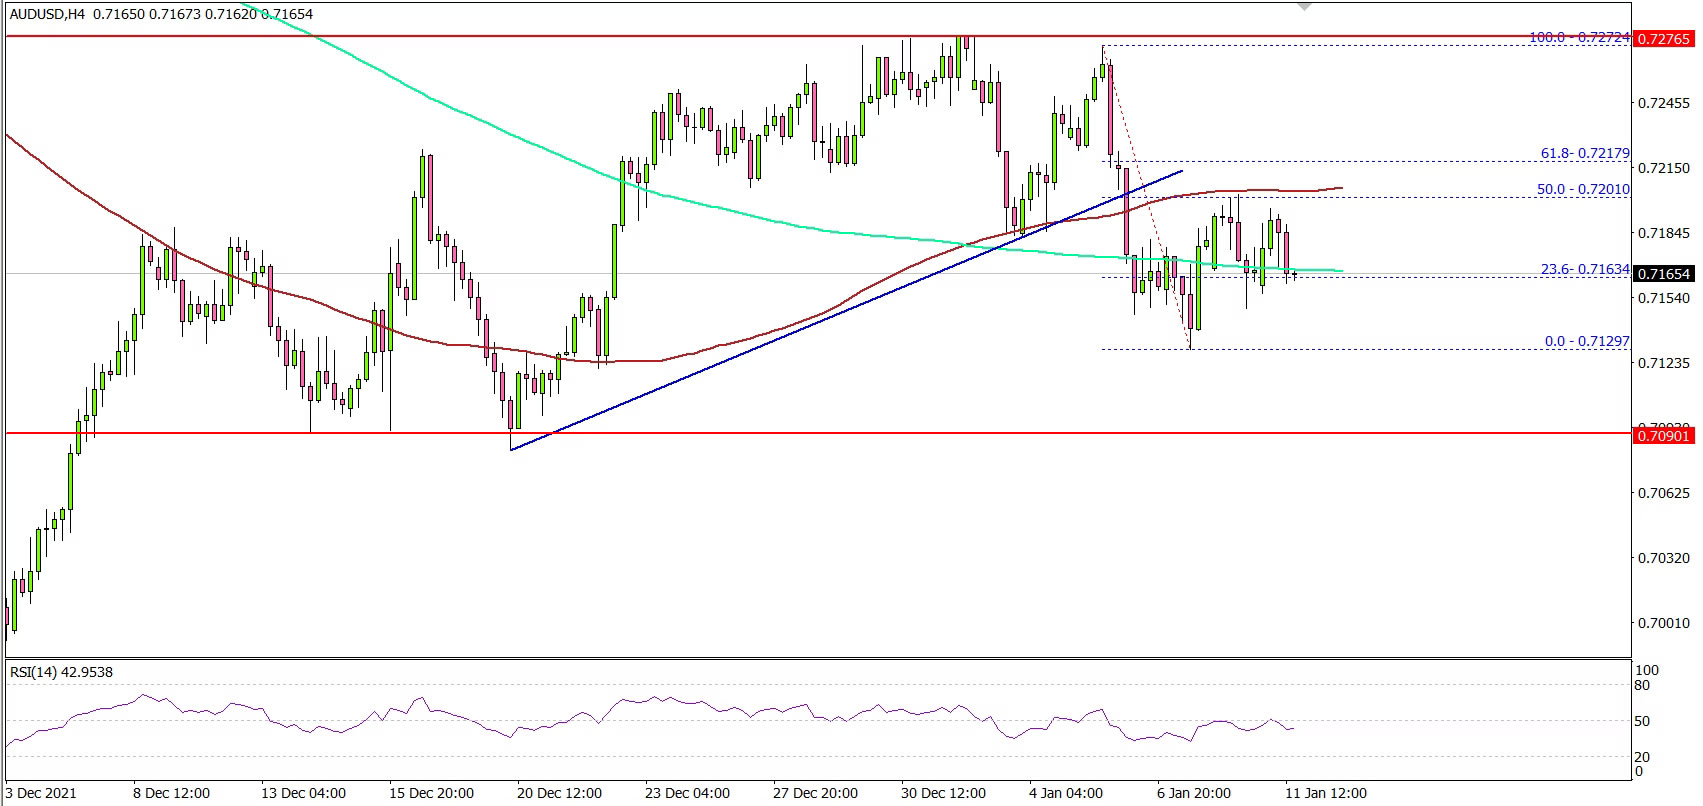
Looking at the 4-hours chart, the pair traded as high as 0.7272 before correcting lower. There was a break below the 0.7220 and 0.7200 support levels. Besides, there was a break below a key bullish trend line with support near 0.7200 on the same chart.
The pair even spiked below the 100 simple moving average (red, 4-hours) and the 200 simple moving average (green, 4-hours). A low was formed near 0.7129 and the pair is now consolidating.
On the downside, there is a decent support forming near 0.7125. The main support is forming near the 0.7090 level, below which the pair could drop to 0.7000.
On the upside, the pair is facing resistance near 0.7200 level and the 100 simple moving average (red, 4-hours). The next major resistance is near the 0.7220 level, above which the pair could revisit 0.7270.
Looking at EUR/USD, the pair is still struggling to gain pace above the 1.1380 zone. Besides, GBP/USD is trading in a positive zone above 1.3500.
Economic Releases
- US Consumer Price Index for Dec 2021 (MoM) – Forecast +0.4%, versus +0.8% previous.
- US Consumer Price Index for Dec 2021 (YoY) – Forecast +7.0%, versus +6.8% previous.
- US Consumer Price Index Ex Food & Energy for Dec 2021 (YoY) – Forecast +5.4%, versus +4.9% previous.
NZDCHF Wave Analysis
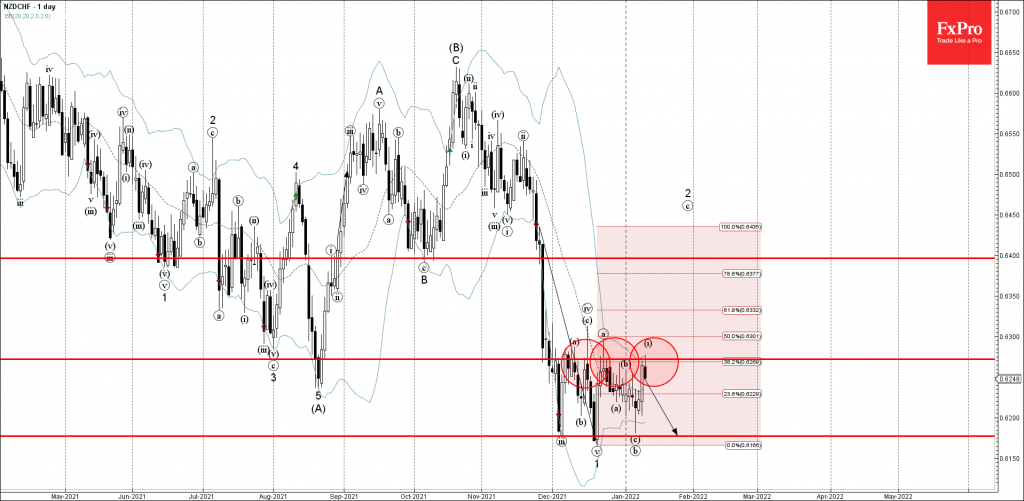
- NZDCHF reversed key resistance level 0.6275
- Likely to fall to support level 0.6177
NZDCHF recently reversed down from the powerful resistance level 0.6275 (which has been reversing the price from the start of December), intersecting with the upper daily Bollinger Band and the 38.2% Fibonacci correction of the downward impulse from November.
The downward reversal from the resistance level 0.6275 stopped the earlier short-term impulse waves (i).
Given the strength of the resistance level 0.6275 – NZDCHF currency pair can be expected to fall further toward the next support level 0.6177 (low of the previous waves (iii), 1 and (b)).
Rally Is Not Over For Risk Assets
What is happening?
In December 2021, the main question on global markets was: “When will the FED increase the key rate?” Traders and investors were transferring their capitals into USDs, waiting for the great dump worldwide. Today, many of the “growth stocks” lost more than 50% from their highs. Since November, Bitcoin has plunged by 40%. The US indices are once again trading around the bottom border of the rising global channel.
Will this bearish trend continue, or have we already found the bottom for the next couple of months?
FBS analysts’ opinion
We believe that market members have overestimated tapering risks, and right now is the perfect moment to look for long traders in risk assets.
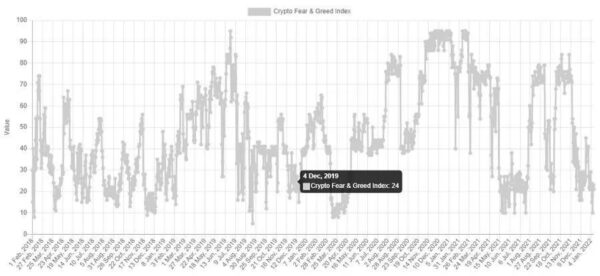
For example, according to the Fear & Greed index, Bitcoin has already found its global support. If you look at the picture below, you will realize Bitcoin reverses every time the crypto market’s F&G index hits 10.
BTC/USD daily chart
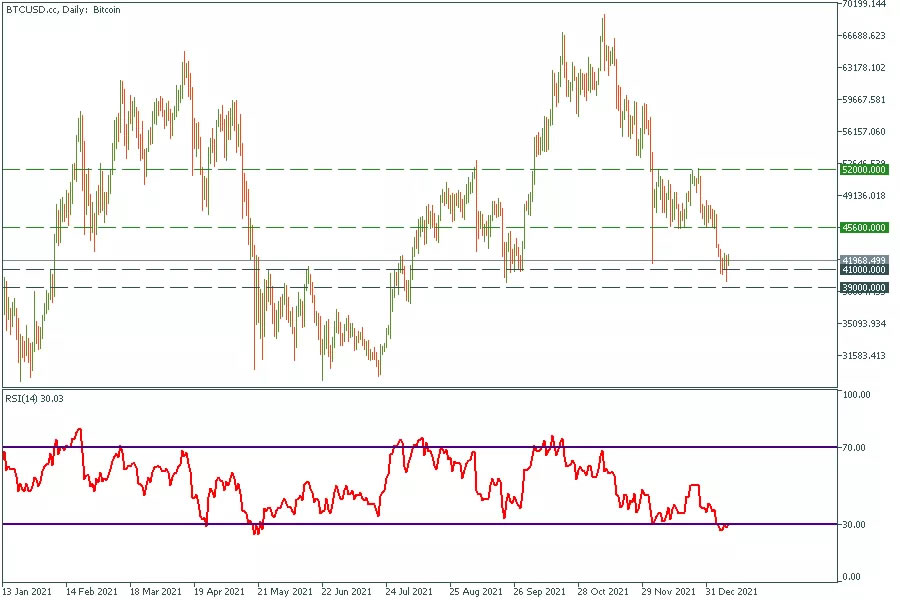
The price has reached a powerful range between $39 000 and $41 000. We can notice that the price has always reacted to these levels, so there is no doubt that the pullback will happen this time. The target for this movement is $45 600. Unfortunately, if bears can drag Bitcoin under $39000, the price will head towards $30 000.
US500 daily chart
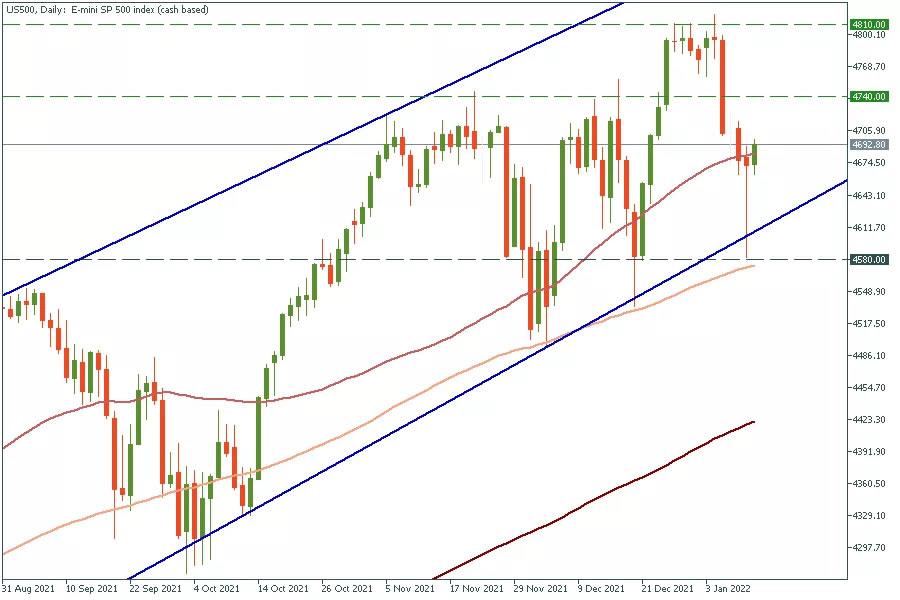
The US500 bounced off the bottom line of the global ascending channel again. The 100-day moving average is still an insurmountable barrier for sellers. We expect the US500 to renew its all-time high by mid-February. As soon as the price breaks through 4810, it will head towards 4870.
US100 daily chart
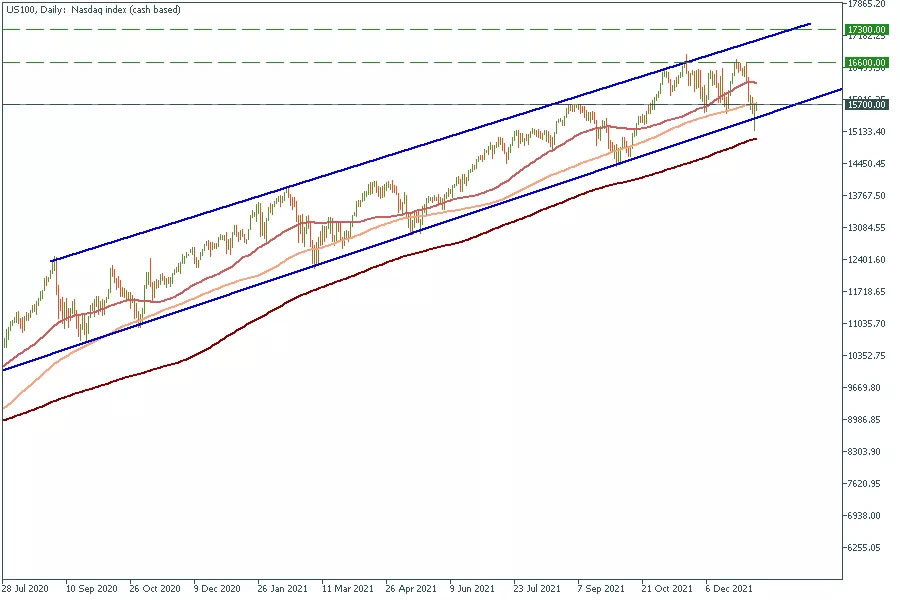
The US100 index has also bounced off the global trend line. The triple bottom pattern has appeared on the chart. As soon the price breaks through 16 600, it will reach 17 300.
NAS100 – Correction Complete?
Or further to go?
It’s been a shaky start to the new year, with interest rate anxieties dragging on sentiment and hitting the NAS100 particularly hard.
The index fell more than 8% over the last week, breaking through key support in the process which could have led to a much deeper correction. Instead, the index bounced strongly in the final hours of trading on Monday and failed to close below the rising channel.
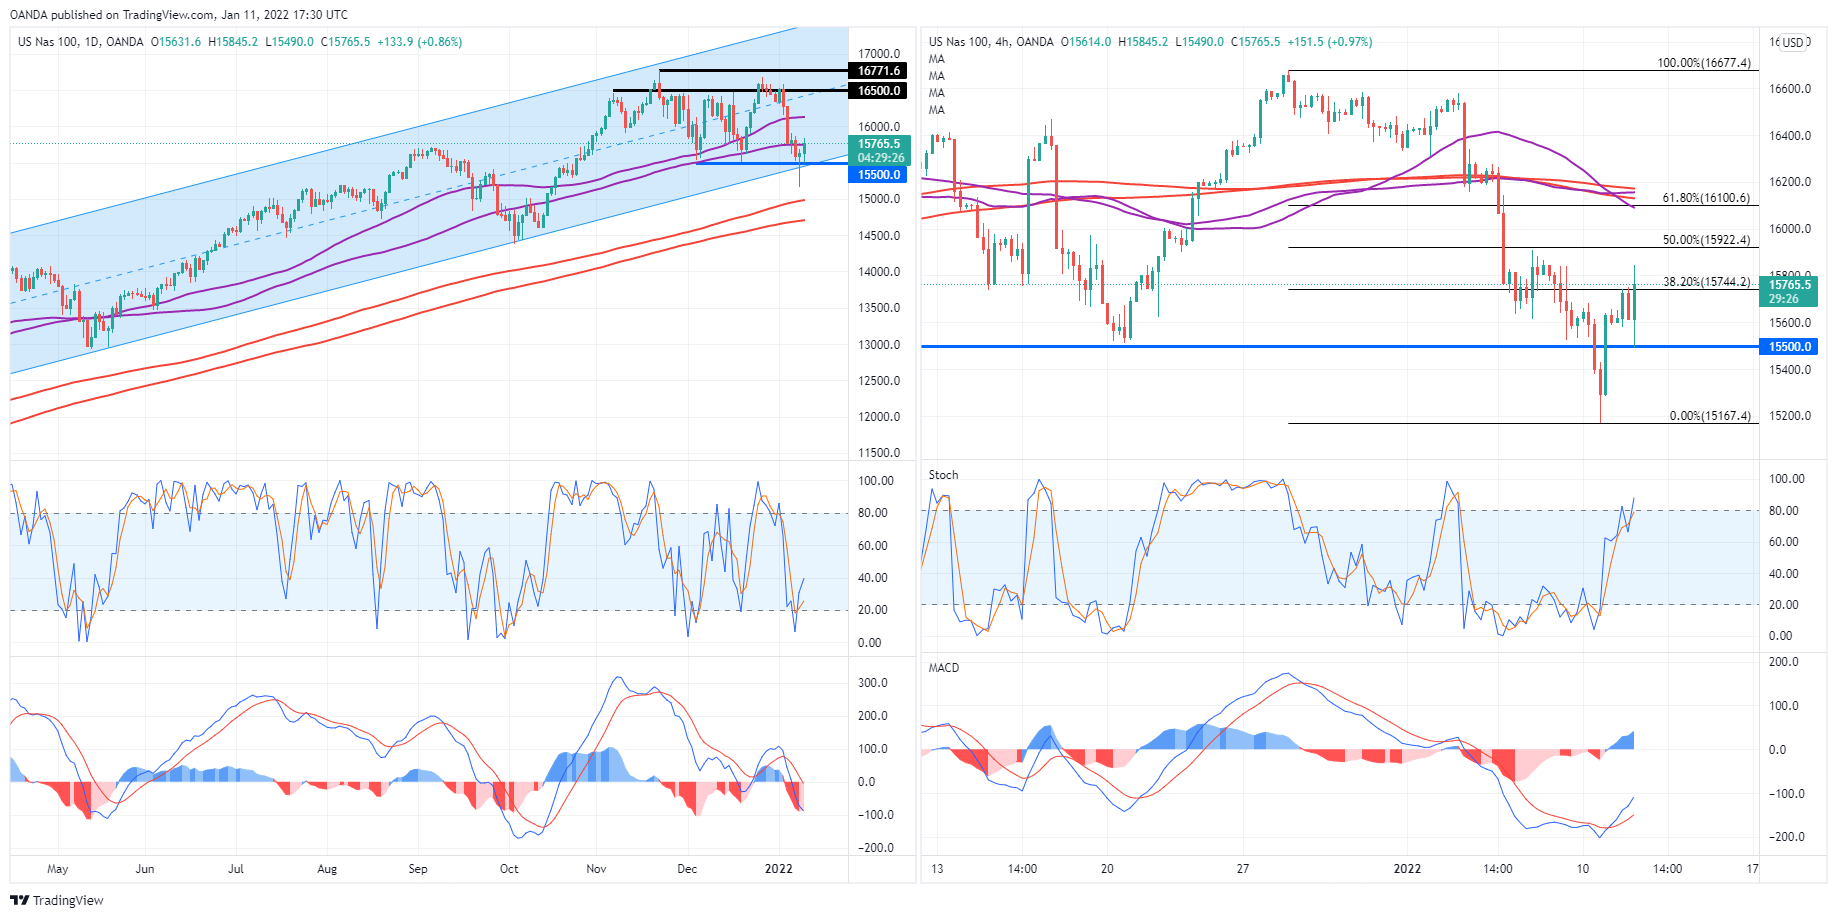
While a deeper correction could still be on the cards, the false breakout – as it now appears to have been – could signal the end of the panic in tech stocks.
If the index can overcome a few key tests above – potentially aided by earnings season which is about to get underway – it could continue the trend we’ve seen since the lows of March 2020.
The first test is around 15,900-15,922, where prior resistance combines with the 50% Fibonacci retracement level. Above here, around 16,100-16,150 will be interesting, combining the 50/89-day SMA band, with the 61.8 fib and the 55/89 and 200/233-period SMA bands on the 4-hour chart.
A move above here could see the NAS100 gather pace to the upside.
The Start of the Fightback?
Stock markets are enjoying some reprieve after a rocky start to the week and investors will be hoping earnings season provides more cause for optimism in the weeks ahead.
The January blues are alive and well and with markets now eyeing up the possibility of four rate hikes this year, we may be approaching peak fear just in time for earnings season. We've quickly pivoted from the transitory inflation narrative to aggressive tightening including a combination of accelerated tapering, multiple rate hikes, and impending balance sheet reduction. That's quite the shift.
I'm not sure the inflation data tomorrow is going to put investors' minds at ease, with CPI seen hitting a multi-decade high above 7%. A higher reading could spook investors once again just as equity markets appear to be stabilizing.
We saw a strong recovery in the final hours of trading on Wall Street on Monday, which is carrying over into today's session. But that could prove fragile if price pressures intensify more than expected; although I do wonder just how much more hawkish the markets can realistically be.
Which may make the timing of earnings season all the more welcome. We've had the scare of omicron, the relief rally, and now interest rate anxiety. That's a lot of uncertainty for investors to contend with. Earnings season should be a timely reminder that the economy remains in a strong position despite all of this.
Oil eyes Autumn highs
Oil prices are rebounding higher again on Tuesday, up more than 1%, and with sights seemingly set on the late Autumn highs. We saw some heat come out of the market over the last couple of days but pullbacks were always likely to be limited given the broader dynamics.
Of course, omicron offers some demand uncertainty over the coming months but the market is tight as OPEC+ slowly turns the taps back on. And OPEC struggling to deliver on targets doesn't help alleviate any of that tightness in the market. Prices could remain elevated for some time yet.
Can gold mount a rally as yields rise?
Gold has shown remarkable resilience in the current environment of rising rate expectations and higher yields, to such an extent that it makes me really question whether it can in fact rally in the short-term. There doesn't appear much rationale behind the move unless we see weakness in the dollar but it's impossible to ignore price action.
And the yellow metal is continuing to force the move higher, pushing strongly against the $1,800 barrier to the upside with some short-term success before being pushed back. Today it's rallied as high as $1,810 and has once again been driven back but it's holding above $1,800. A close above here could be a bullish signal, albeit a confusing one.
Can Bitcoin hold $40,000?
We're seeing a battle emerge in the bitcoin market after it dipped briefly below $40,000 on Monday. The cryptocurrency fought back to defend key support before peaking back above $42,500. It's since settled back around $41,500, leaving us none the wiser about where the next move will come. Clearly, there's plenty of support at $40,000 but if bitcoin is as sensitive to monetary tightening as it appears, how long can it hold?
Fed George prefer earlier balance sheet runoff, Mester could support March hike
Kansas City Fed President Esther George said, "my own preference would be to opt for running down the balance sheet earlier rather than later as we plot a path for removing monetary accommodation."
Separately, Cleveland Fed President Loretta Mester said, "If the economy in March looks like it does today and the outlook is similar ... then I would support moving the funds rate up at that meeting and starting to move back from some of the extraordinary accommodation we needed earlier in the pandemic."
EURCHF Recoups Lost Ground as Bullish Tone Bolsters
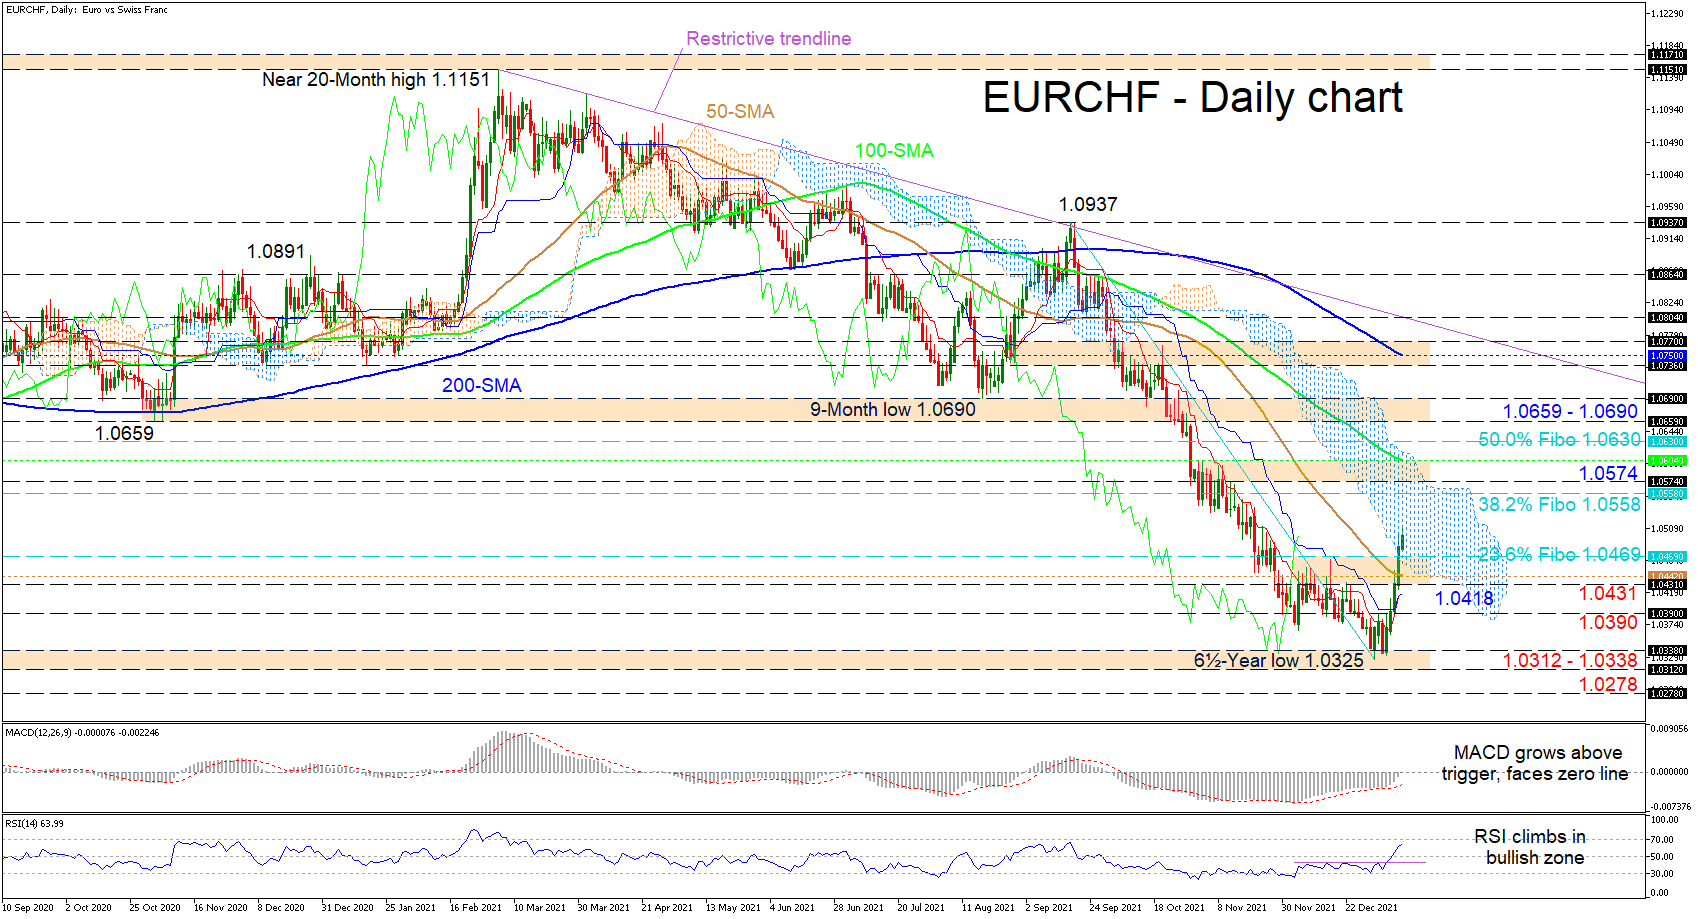
EURCHF buyers have dominated ever since touching a 6½-year low of 1.0325, plotting four consecutive green candles, which has steered the price above the 50-day SMA of 1.0442 and the 1.0469 level, which is the 23.6% Fibonacci retracement of the down leg from 1.0937 until 1.0325. Despite the latest climb in the price, the SMAs are still sponsoring the negative trend in the pair.
The Ichimoku lines are indicating that an upside drive is countering the bearish bias, while the short-term oscillators are reflecting that the bulls have gained the upper hand. The MACD, is strengthening above its red trigger line and looks set to prod north of the zero threshold, while the RSI is heading for the 70 overbought level.
If the pair continues to claw in additional lost ground, preliminary upside constraints could arise from the 38.2% Fibo of 1.0558 ahead of the resistance zone from the 1.0574 barrier until the 100-day SMA at 1.0604. Should the pair overcome the cloud, buyers may then tackle the 50.0% Fibo of 1.0630 prior to challenging the key 1.0659-1.0690 boundary (previous support-now-resistance), which extends back to November 2020.
Alternatively, if sellers resurface, an initial support zone could develop between the 23.6% Fibo of 1.0469 and the 1.0431 obstacle. Diving lower, the Ichimoku lines may delay the test of the 1.0390 barrier and the support section of 1.0312-1.0338. Should the latter barricade, which includes the 6½-year low give way, the bears could then target the 1.0278 trough from the end of May 2015.
Summarizing, EURCHF is exhibiting a bearish bias below the 1.0600 handle, and specifically the 1.0574-1.0604 resistance area. Nevertheless, buyers are currently dominating and have yet to show any signs of weakness.