Sample Category Title
USD/CHF Mid-Day Outlook
Daily Pivots: (S1) 0.8025; (P) 0.8046; (R1) 0.8066; More….
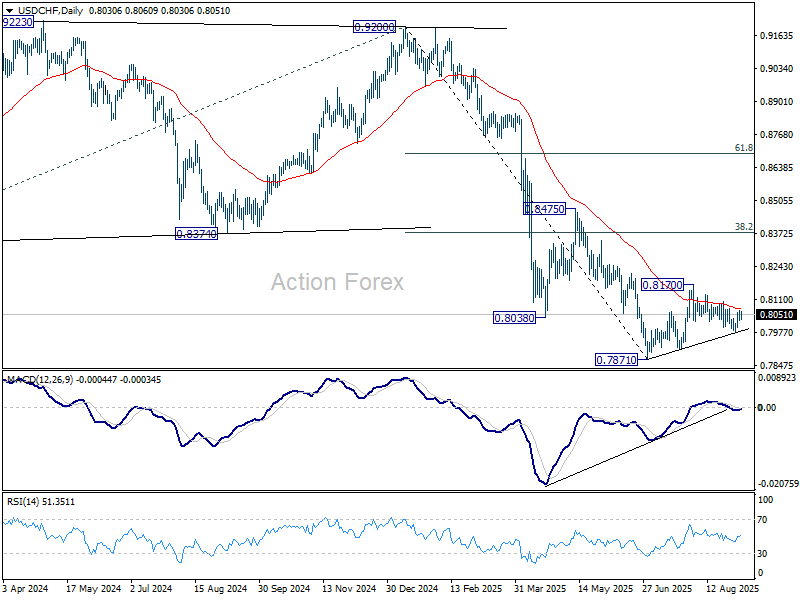
Intraday bias in USD/CHF stays neutral for the moment. On the downside, break of 0.7984 will resume the fall from 0.8170 to 0.7910 support first, and then retest of 0.7871 low. However, break of 0.8103 resistance will turn bias to the upside to resume the rebound from 0.7871 through 0.8170.
In the bigger picture, long term down trend from 1.0342 (2017 high) is still in progress. Next target is 100% projection of 1.0146 (2022 high) to 0.8332 from 0.9200 at 0.7382. In any case, outlook will stay bearish as long as 0.8475 resistance holds.
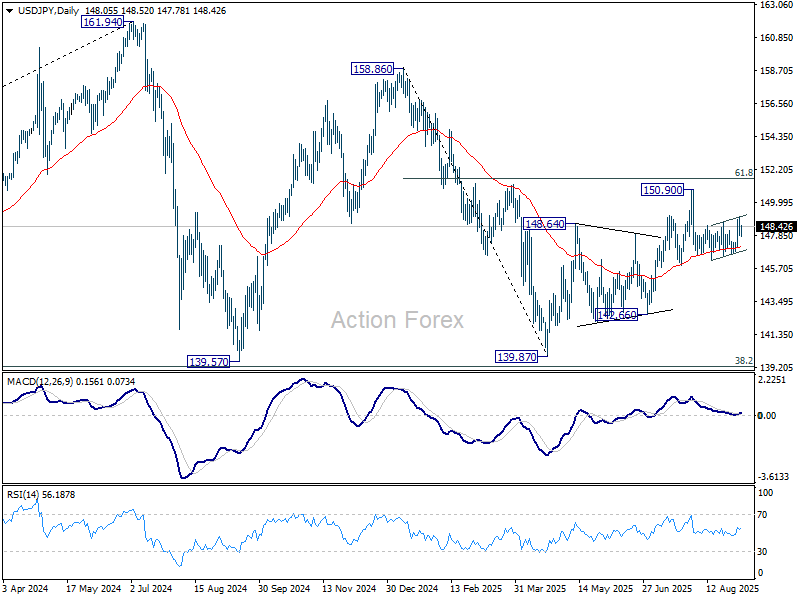
USD/JPY Mid-Day Outlook
Daily Pivots: (S1) 147.61; (P) 148.38; (R1) 148.87; More...
Intraday bias in USD/JPY remains neutral at this point. On the upside, above 149.12 will resume the rebound from 146.20 to retest 150.90 high. Break there will resume the rise from 139.87 to 151.22 fibonacci level. However, on the downside, break of 146.65 support will resume the decline from 150.90 through 146.20 instead.
In the bigger picture, price actions from 161.94 (2024 high) are seen as a corrective pattern to rise from 102.58 (2021 low). Decisive break of 61.8% retracement of 158.86 to 139.87 at 151.22 will argue that it has already completed with three waves at 139.87. Larger up trend might then be ready to resume through 161.94 high. In case the corrective pattern extends with another fall, strong support is expected from 38.2% retracement of 102.58 to 161.94 at 139.26 to bring rebound.
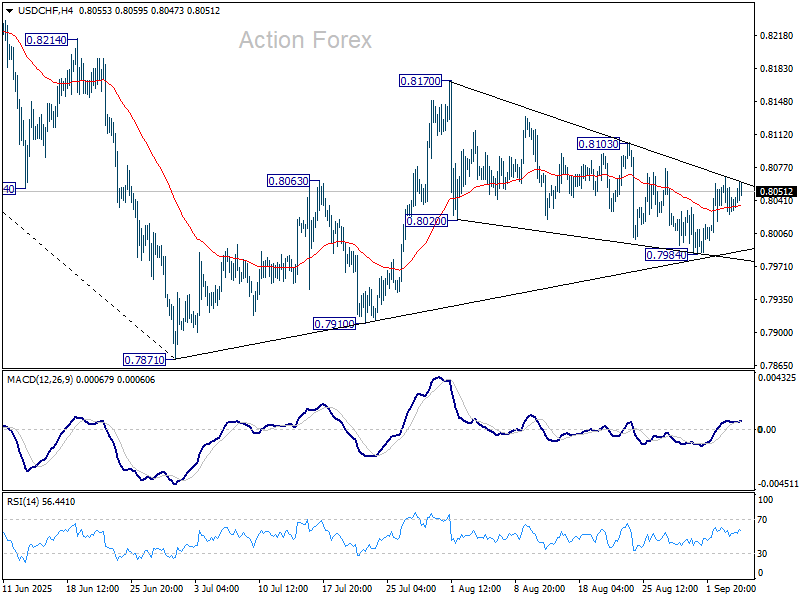
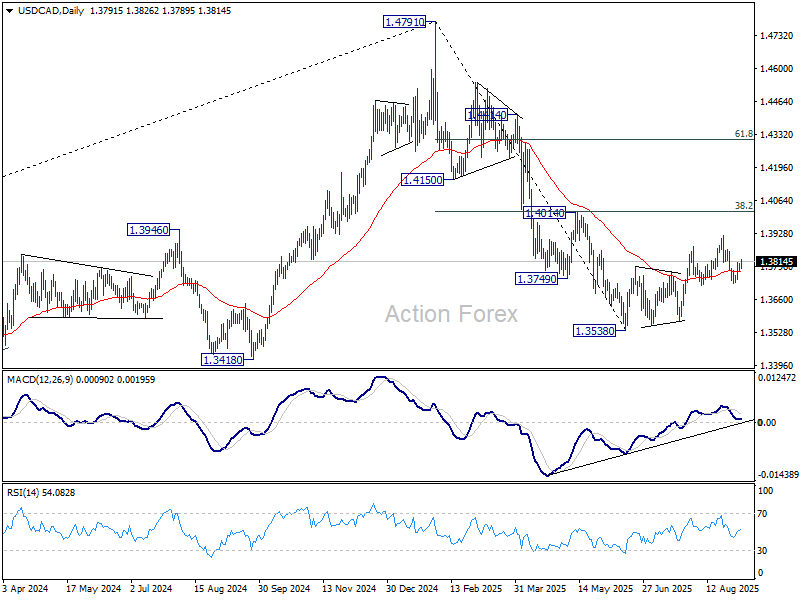
USD/CAD Mid-Day Outlook
Daily Pivots: (S1) 1.3777; (P) 1.3793; (R1) 1.3808; More...
USD/CAD's break of 1.3813 support turned resistance argues that corrective pullback from 1.3923 has completed at 1.3725, ahead of 1.3720 support. Intraday bias is back on the upside for retesting 1.3923 resistance first. Firm break there will resume whole corrective rise from 1.3538. For now, risk will stay on the upside as long as 1.3725 support holds, in case of retreat.
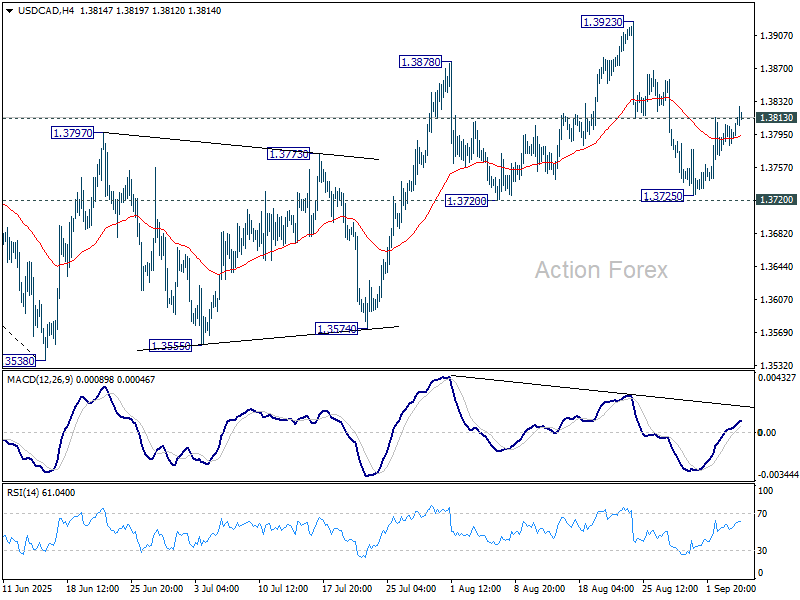
In the bigger picture, price actions from 1.4791 medium term top could either be a correction to rise from 1.2005 (2021 low), or trend reversal. In either case, further decline is expected as long as 1.4014 cluster resistance (38.2% retracement of 1.4791 to 1.3538 at 1.4017) holds. Next target is 61.8% retracement of 1.2005 (2021 low) to 1.4791 at 1.3069.
Dollar Holds Firm as US Jobs Data Weaker But Not Disastrous
Today’s US job data pointed to a softer labor market but stopped short of signaling a collapse. The numbers reinforced the message that hiring is slowing, though not disastrously, giving the Fed justification to ease policy modestly without raising alarm over economic stability. Markets remain almost unanimous in pricing a 25bps cut this month.
The outlook beyond this month remains uncertain. Fed fund futures show the probability of an October cut at just over 50%, effectively a coin toss. The prevailing base case is that policymakers may move at a gradual pace, delivering one cut per quarter until policy converges closer to neutral. But much depends on the next test—tomorrow’s nonfarm payroll report.
Caution is visible elsewhere in the markets. US equity futures were flat in early trading. Gold eased slightly after setting fresh record highs. Importantly, bullion remains steady above the 3,500 level, suggesting the pullback is more consolidation than reversal. Bitcoin is attempting to rebound but continues to struggle for momentum above the 110,000 mark.
In currency markets, risk-sensitive pairs came under pressure, with Kiwi and Aussie leading declines for today so far, followed by Euro. The Dollar, by contrast, outperformed, helped by safe-haven demand and resilient yields. Sterling rebounded after earlier weakness, placing second on the leaderboard, while Swiss Franc also held firm. Yen and Loonie were mid-pack performers.
In Europe, at the time of writing, FTSE is up 0.23%. DAX is up 0.63%. CAC is down -0.34%. UK 10-year yield is down -0.03 at 4.719. Germany 10-year yield is down -0.03 at 2.713. Earlier in Asia, Nikkei rose 1.53%. Hong Kong HSI fell -1.12%. China Shanghai SSE fell -1.25%. Singapore Strait Times rose 0.17%. Japan 10-year JGB yield fell -0.032 to 1.605.
US ADP jobs up 54k, hiring momentum slows further
US private employers added 54k jobs in August, short of expectations for 72k, according to ADP. Goods-producing industries created 13k positions, while services added 42k. Hiring by firm size showed modest gains across the board, with small companies up 12k, medium-sized firms up 25k, and large firms up 18k.
Wage dynamics were mixed. Year-over-year pay growth for job-stayers held steady at 4.4%, while job-changers saw wages rise 7.1%, slightly faster than July’s 7.0%.
ADP’s chief economist Nela Richardson said hiring momentum has been “whipsawed by uncertainty,” citing factors such as labor shortages, skittish consumer demand, and potential disruption from artificial intelligence adoption. The data add to concerns that job creation is losing momentum ahead of Friday’s official nonfarm payrolls report.
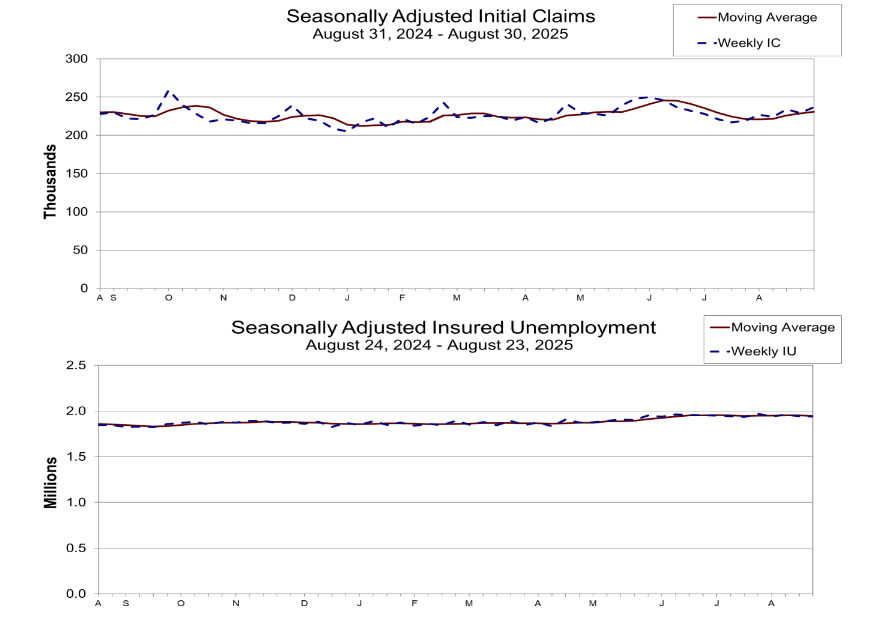
US initial jobless claims rise to 237k vs exp 232k
US initial jobless claims rose 8k to 237k in the week ending August 30, above expectation of 232k. Four-week moving average of initial claims rose 2.5k to 231k.
Continuing claims fell -4k to 1940k in the week ending August 23. Four-week moving average of continuing claims fell -7k to 1947k.
Eurozone retail sales fall -0.5% mom, food and fuel drag
Eurozone retail sales fell -0.5% mom in July, steeper than expectations of a -0.2% mom decline. Food, drinks, and tobacco sales dropped -1.1%, while automotive fuel purchases slumped -1.7%. Non-food sales edged higher by just 0.2%, offering little offset to the overall weakness.
Across the broader EU, sales slipped -0.4% mom on the month. The divergence among member states was notable: Croatia (-4.0%), Estonia (-2.0%), and Germany (-1.5%) recorded the sharpest drops, while Lithuania (+1.5%), Latvia (+1.4%), and the Netherlands (+1.1%) posted gains.
Swiss CPI subdued at 0.2% yoy, but no immediate deflation threat seen
Swiss consumer prices slipped in August, with headline CPI falling -0.1% mom, below expectations for a flat reading. Core CPI, which excludes fresh products and energy, also dropped -0.1% on the month, as both domestic and imported product prices declined by -0.1% mom.
On an annual basis, inflation held steady at just 0.2% yoy, in line with expectations. Core CPI eased further to 0.7% yoy from 0.8% yoy previously. Domestic price growth slowed to 0.6% yoy from 0.7% yoy, while imported prices contracted by -1.3% yoy, a slight improvement from -1.4% yoy in July.
The data confirm that inflation in Switzerland remains exceptionally subdued. Yet, deflation risk is not imminent. That leaves little urgency for the SNB to bring back negative interest rates for now.
USD/CAD Mid-Day Outlook
Daily Pivots: (S1) 1.3777; (P) 1.3793; (R1) 1.3808; More...
USD/CAD's break of 1.3813 support turned resistance argues that corrective pullback from 1.3923 has completed at 1.3725, ahead of 1.3720 support. Intraday bias is back on the upside for retesting 1.3923 resistance first. Firm break there will resume whole corrective rise from 1.3538. For now, risk will stay on the upside as long as 1.3725 support holds, in case of retreat.
In the bigger picture, price actions from 1.4791 medium term top could either be a correction to rise from 1.2005 (2021 low), or trend reversal. In either case, further decline is expected as long as 1.4014 cluster resistance (38.2% retracement of 1.4791 to 1.3538 at 1.4017) holds. Next target is 61.8% retracement of 1.2005 (2021 low) to 1.4791 at 1.3069.
US initial jobless claims rise to 237k vs exp 232k
US initial jobless claims rose 8k to 237k in the week ending August 30, above expectation of 232k. Four-week moving average of initial claims rose 2.5k to 231k.
Continuing claims fell -4k to 1940k in the week ending August 23. Four-week moving average of continuing claims fell -7k to 1947k.
US ADP jobs up 54k, hiring momentum slows further
US private employers added 54k jobs in August, short of expectations for 72k, according to ADP. Goods-producing industries created 13k positions, while services added 42k. Hiring by firm size showed modest gains across the board, with small companies up 12k, medium-sized firms up 25k, and large firms up 18k.
Wage dynamics were mixed. Year-over-year pay growth for job-stayers held steady at 4.4%, while job-changers saw wages rise 7.1%, slightly faster than July’s 7.0%.
ADP’s chief economist Nela Richardson said hiring momentum has been “whipsawed by uncertainty,” citing factors such as labor shortages, skittish consumer demand, and potential disruption from artificial intelligence adoption. The data add to concerns that job creation is losing momentum ahead of Friday’s official nonfarm payrolls report.
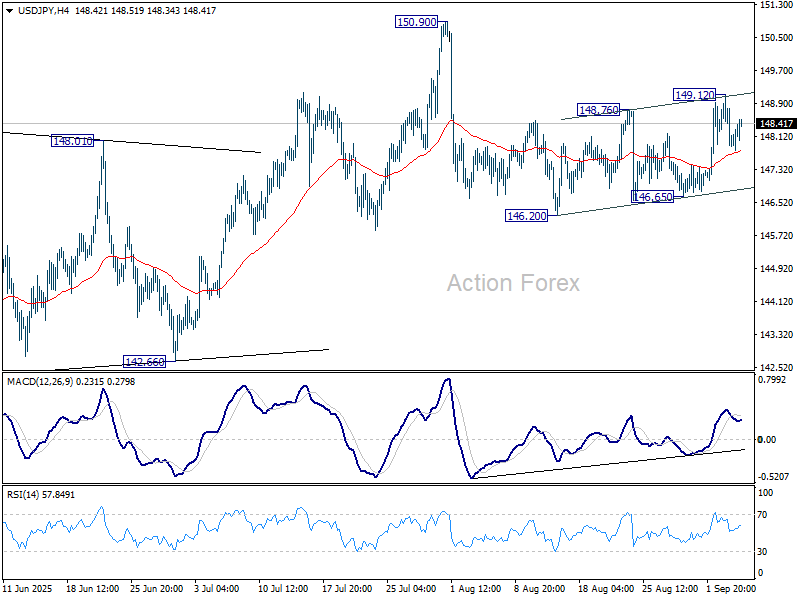
USD/JPY in Equilibrium as Volatility Rises
The USD/JPY pair held steady on Thursday, trading around 148.13 as the yen modestly recovered from the losses incurred in the previous session. The US dollar came under pressure following the release of softer US labour market data, which bolstered expectations of an impending Federal Reserve rate cut.
Domestically, Bank of Japan Governor Kazuo Ueda reiterated on Wednesday the central bank's commitment to a gradual pace of rate hikes, contingent on economic growth and inflation aligning with its projections.
Market participants now await further direction from the latest wage statistics, due for release on Friday.
Meanwhile, political uncertainty continues to weigh on the Japanese currency. The pair briefly touched a one-month low yesterday amid news that Hiroshi Moriyama, the ruling party's secretary-general and a key ally of Prime Minister Shigeru Ishiba, had resigned. Speculation has since intensified that Ishiba himself may step down. Among the potential successors is Sanae Takaichi, a noted proponent of maintaining ultra-low interest rates, a factor likely to keep the yen under pressure.
Technical Analysis: USD/JPY
H4 Chart:
On the H4 chart, USD/JPY continues to develop a corrective wave within a defined ascending channel. The current move suggests a continuation of the correction towards the channel's lower boundary near 146.77. Upon completion of this pullback, the pair could form another leg higher, with an initial target at 149.00 and a further objective at 150.75. This outlook is technically supported by the MACD indicator. The histogram has begun to decline, while the signal line has crossed beyond the histogram and is turning lower.

H1 Chart:
On the H1 chart, having tested the 149.00 level, the pair is now forming a corrective decline. The support level at 146.77 serves as the initial target for this pullback. This scenario is confirmed by the Stochastic oscillator. Its signal line is currently in the overbought zone above 80.0. A decisive break below the 80.0 level would signal a likely continuation of the corrective move.

Conclusion
USD/JPY is currently balancing between a dovish Fed and a cautious BoJ, amplified by domestic political risks. While the near-term bias is for a continued correction lower, the broader uptrend remains intact pending a break of key channel support. All eyes are on Friday's wage data for the next significant catalyst.
Bitcoin Too Cautious, XRP More Relaxed
Market Picture
The cryptocurrency market cap has not changed over the past day, remaining close to $3.81 trillion. On Wednesday, the market rose to $3.9T, but was unable to maintain its growth trajectory. Among the top coins, Ethereum has been the growth leader for over 24 hours, but its 1.4% rise is less than half of Wednesday’s gains.
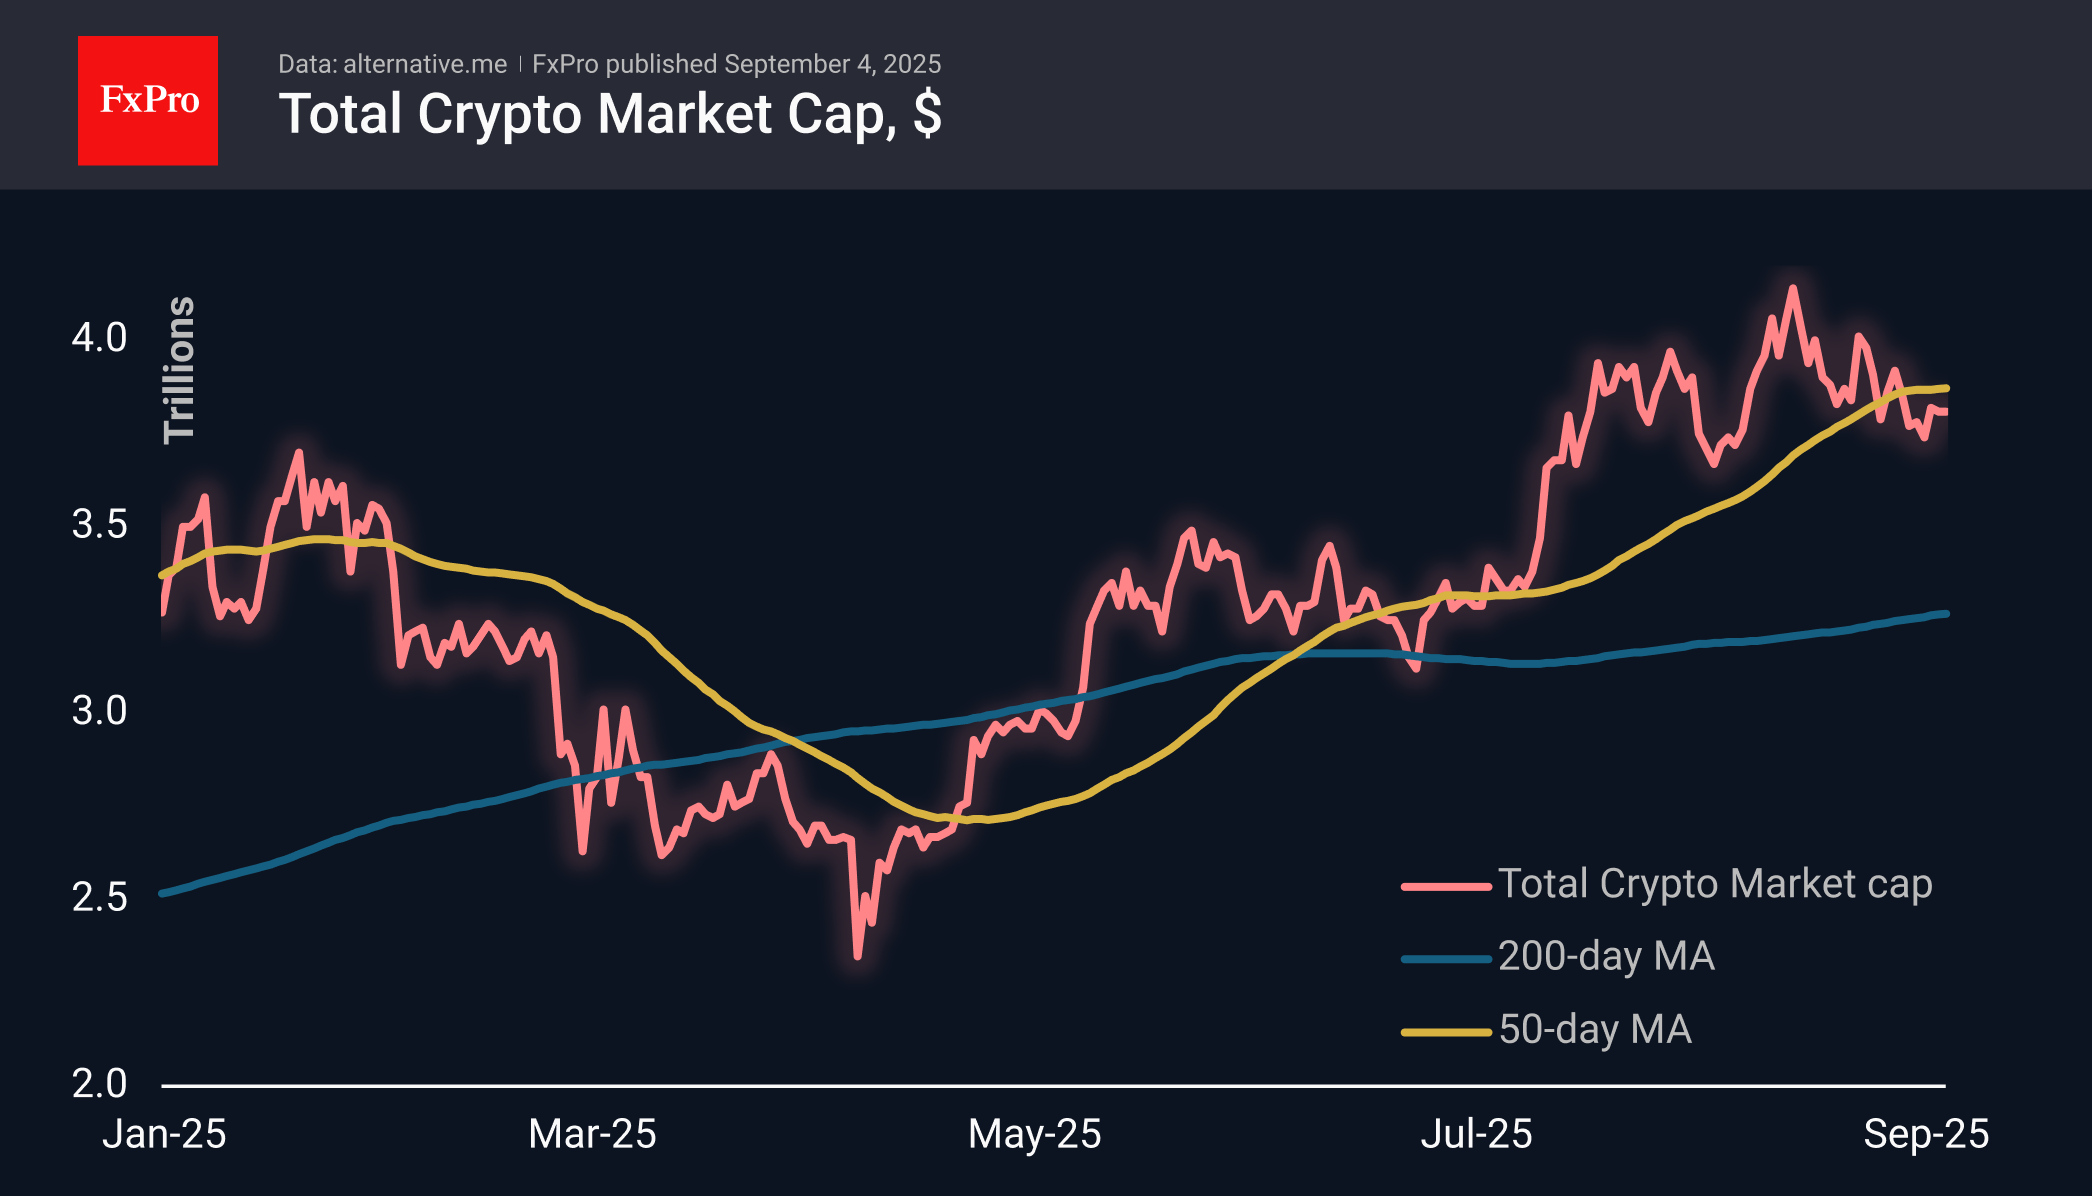
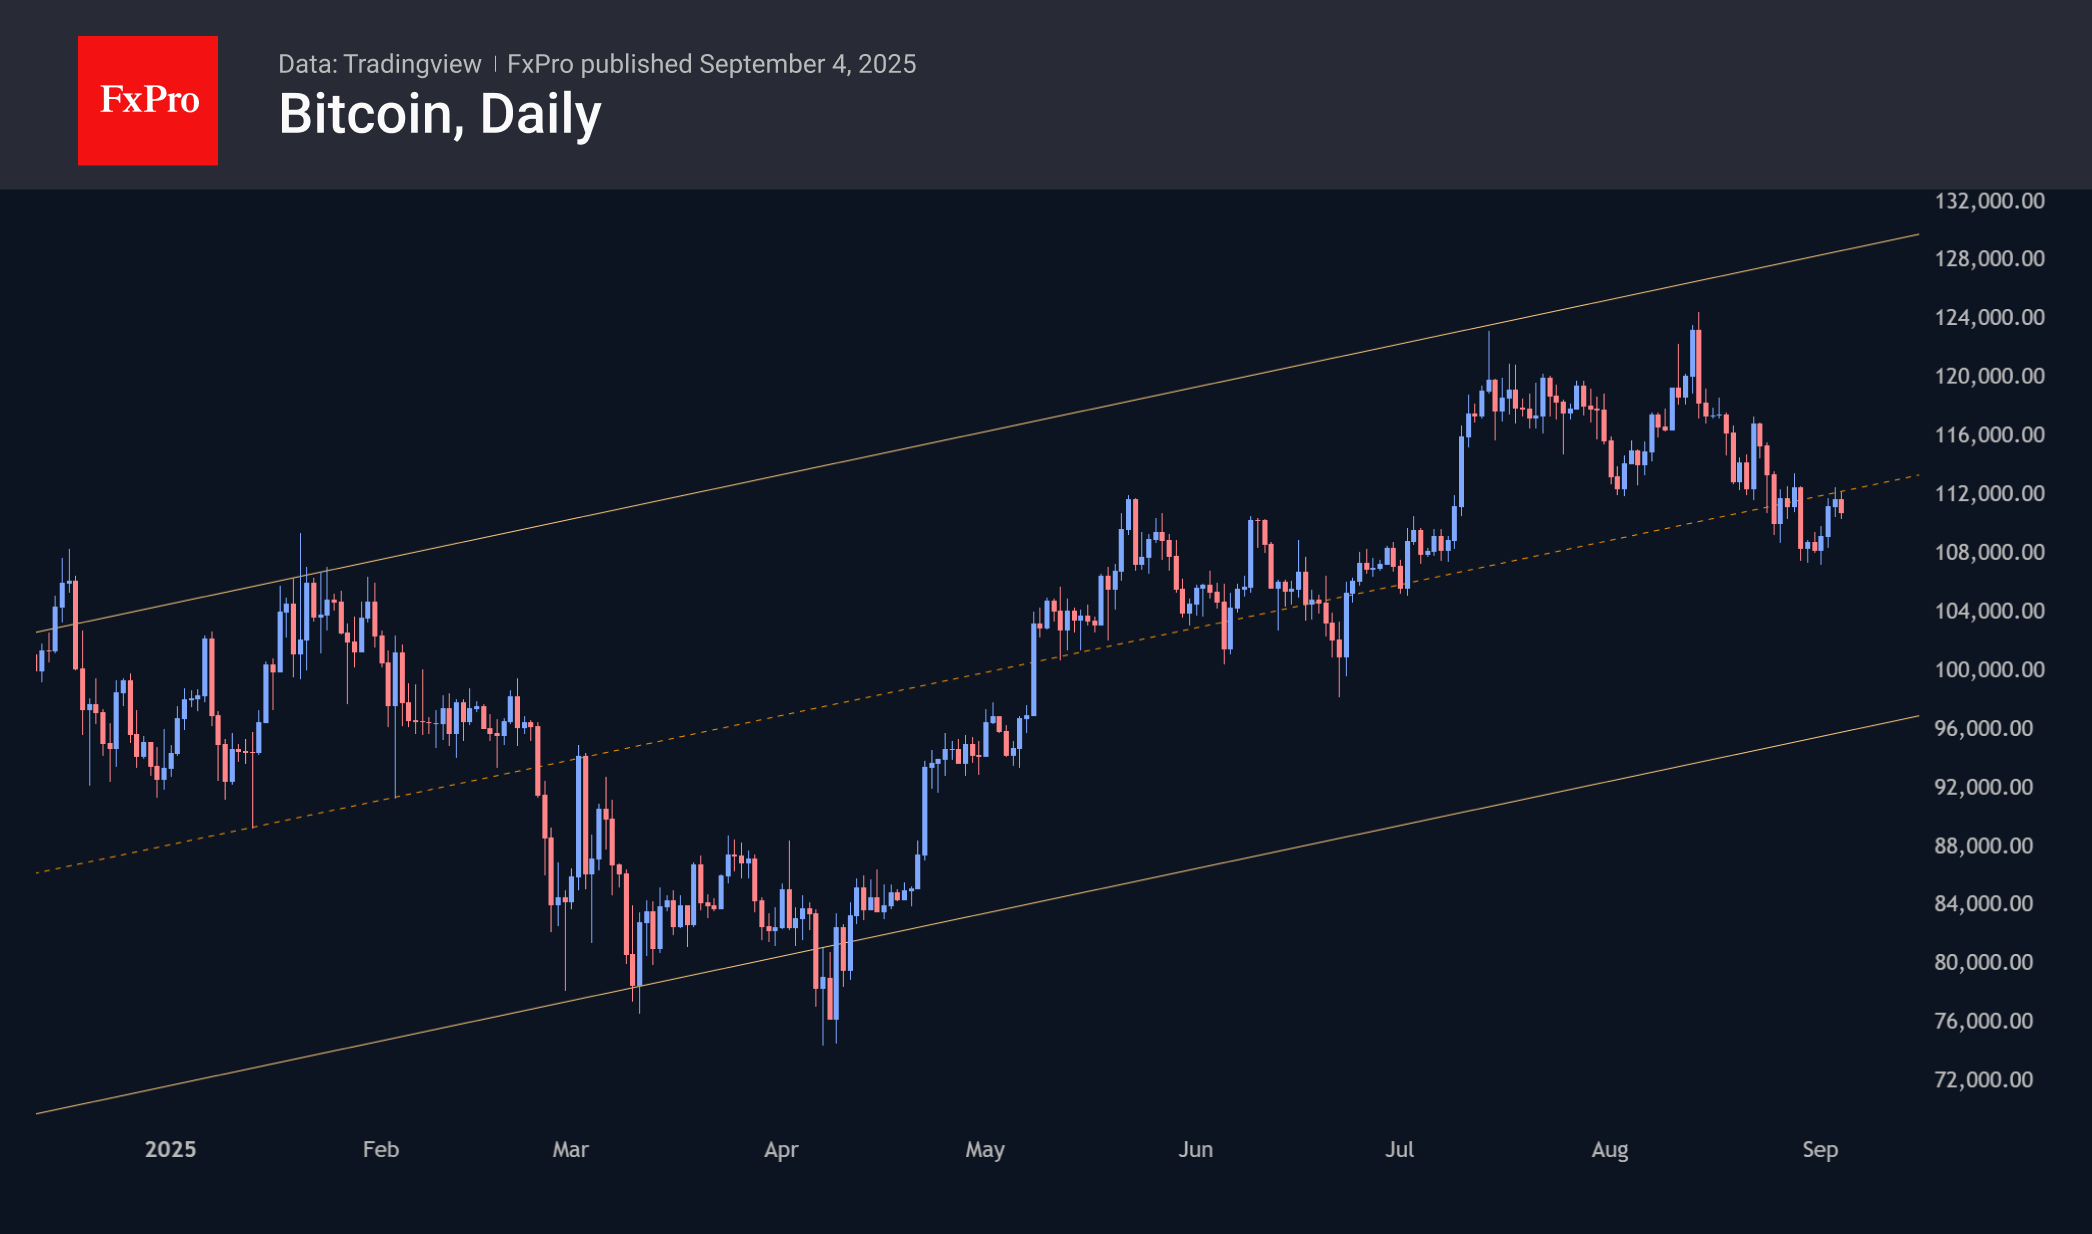
Bitcoin is trading just above $110K, down 1.5% since the start of the day on Thursday. We believe the reason for the pullback is caution ahead of Friday’s employment release, as BTC is the most sensitive to macroeconomic data among all cryptocurrencies. There may be many false signals within the $108K to $113K range, but a breakout from this consolidation can be seen as a more reliable signal of the trend direction for the coming days.
XRP escaped Thursday’s general gloom, recovering fairly quickly to the day’s opening levels after a weak start. This is an indicator of the internal strength of buyers, who are waiting for the risks of uncertainty to decrease, but are generally optimistic about tomorrow.
News Background
The pursuit of high returns from storing Ethereum carries serious risks for companies, warns SharpLink Gaming, itself the second-largest public holder of ETH by assets.
The queue to enter Ethereum staking has reached a two-year high, with an average waiting time of 14 days. The queue to exit staking has decreased by 20% after reaching a record high of 1 million ETH on 29 August.
According to The Block, the total volume of cryptocurrency trading on exchanges in August reached the levels seen at the beginning of the year.
The SEC and CFTC intend to coordinate the launch of spot crypto asset trading on regulated platforms, according to a joint statement from the agencies. The initiative aims to strengthen US leadership in blockchain technology.
The Solana community has approved the Alpenglow update, which will significantly speed up transaction finalisation and the operation of decentralised applications. According to MEXC forecasts, SOL could reach $250 by the end of the year.
The number of searches for meme tokens on Google has increased after several months of low activity. The indicator reached 57 points on a 100-point scale. This is significantly lower than the peak of 100 points recorded in January, which was fuelled by the hype surrounding the launch of the TRUMP token.
Silver Price Retreats from a 14-Year High
As the XAG/USD chart shows, yesterday silver climbed above $41.40 per ounce. The last time silver traded at this level was in September 2011. The rise in XAG/USD was supported by gold surging to a record high, which we reported yesterday.
Furthermore, Goldman Sachs analysts have issued a gold price forecast for mid-2026, according to which XAU/USD could rise to:
→ $4,000 under the base case;
→ $5,000 if 1% of the private US Treasury market flows into gold. This scenario would imply a loss of Federal Reserve independence, higher inflation, and the US dollar weakening as a so-called reserve currency.
Technical Analysis of XAG/USD
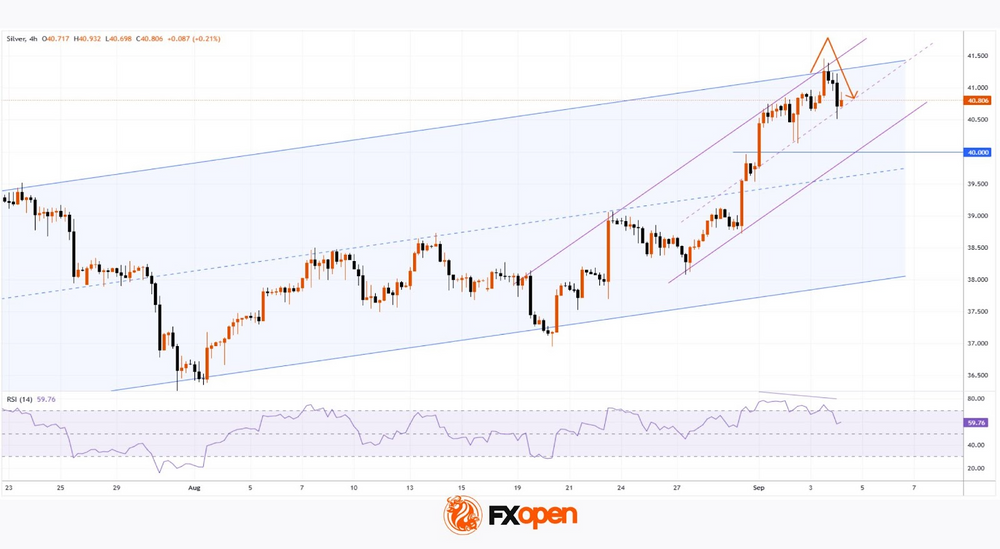
Analysing XAG/USD fluctuations, we can identify two ascending channels:
→ Medium-term (shown in blue): in play since early summer;
→ Short-term (shown in purple): reflecting increased demand over the past two weeks.
Within this context, it is evident that silver has encountered a resistance cluster formed by the upper boundaries of these channels. For short- and medium-term traders, this suggests that XAG/USD may be considered overvalued → potentially triggering a wave of profit-taking on long positions.
Signs of demand exhaustion include:
→ A bearish divergence on the RSI indicator;
→ The aggressive decline from the upper channel boundary (highlighted by the orange arrow).
Bulls may find support at the median line and lower boundary of the purple channel.
Given the above, we might assume that the purple channel could still sustain silver’s upward momentum by inertia. At the same time, the formation of a bearish reversal pattern (e.g. a double top) near the upper blue boundary could occur, followed by a correction towards the psychological $40 level (where a buyer imbalance was previously observed).
Start trading commodity CFDs with tight spreads. Open your trading account now or learn more about trading commodity CFDs with FXOpen.
This article represents the opinion of the Companies operating under the FXOpen brand only. It is not to be construed as an offer, solicitation, or recommendation with respect to products and services provided by the Companies operating under the FXOpen brand, nor is it to be considered financial advice.
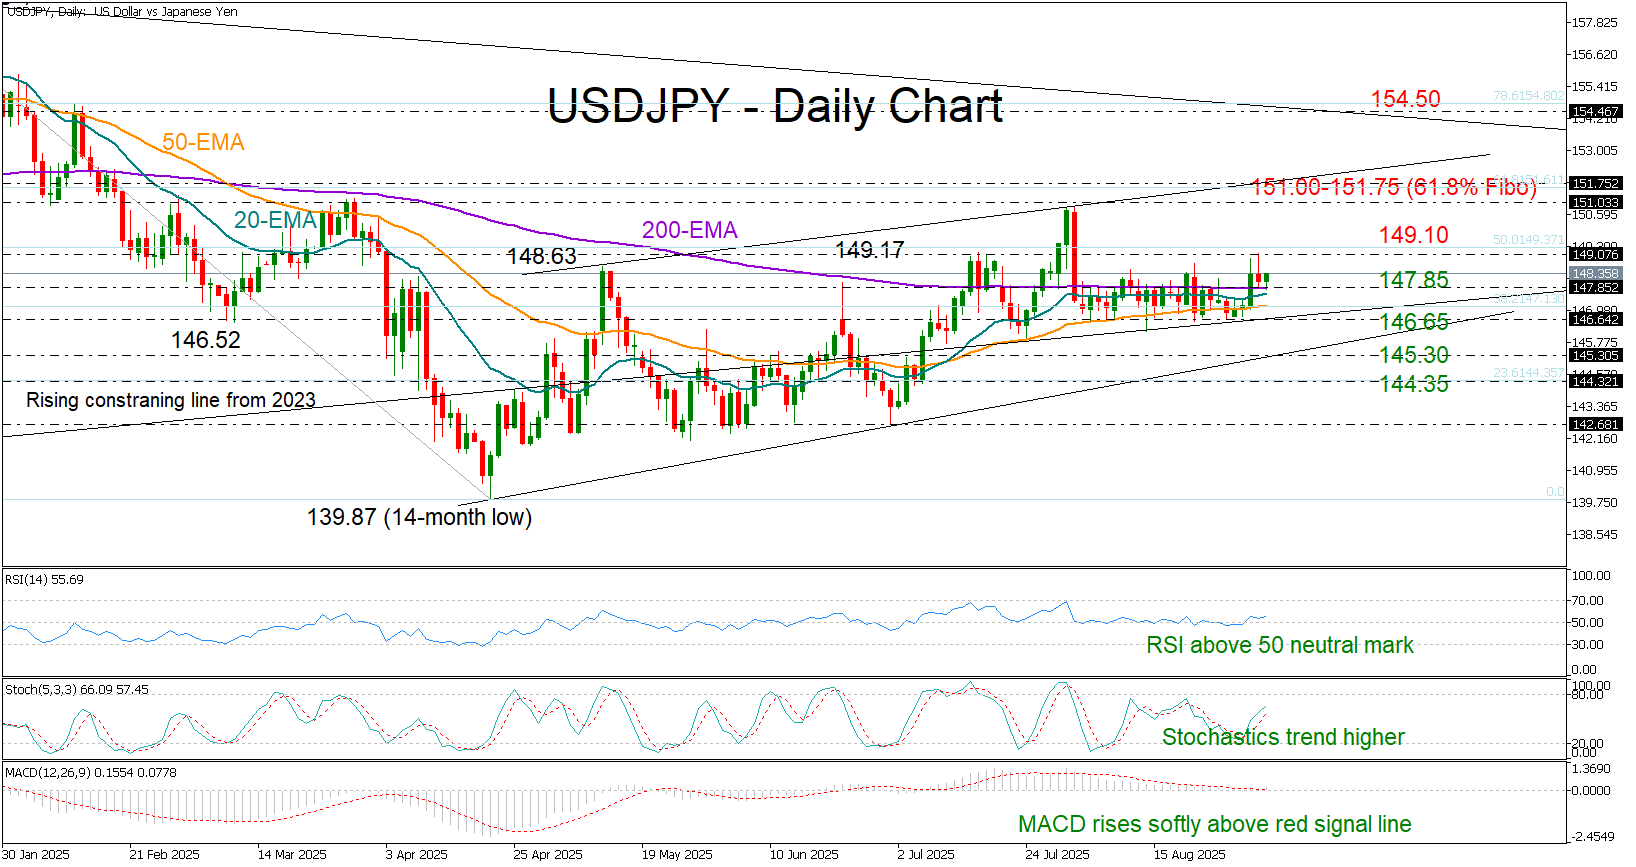
USD/JPY Holds Flat, But Bulls Remain on Watch
- USD/JPY fails to close above 149.00 ahead of key jobs figures.
- Bulls could make another attempt if the 147.85 floor holds firm.
USDJPY closed flat again around the 148.35 level on Wednesday, staying trapped within the monthly sideways pattern after weaker-than-expected JOLTS job openings prevented a breakout above the 149.00 area.
Given the credibility concerns surrounding Friday’s nonfarm payrolls report, volatility could resurface when the private ADP employment report is released later today at 12:15 GMT, with forecasts pointing to a slowdown to 73k from 104k previously.
The short-term bias remains tilted to the upside, as the technical indicators continue to fluctuate within bullish territory, with the MACD preparing to cross above its red signal line for the first time since June.
Still, the floor around the 200-day exponential moving average (EMA) at 147.85 must hold firm for the bulls to successfully pierce the 149.10 resistance and drive the pair toward the next barrier at 151.00–151.75. The 61.8% Fibonacci retracement level of the January–April downtrend overlaps with this area. A successful breakout there could open the door for further gains toward 154.60.
On the downside, sellers may re-emerge below the 146.65 support area, where a break could initially bring stabilization near the tentative ascending trendline at 145.30, followed by the 23.6% Fibonacci retracement level at 144.35.
Overall, Wednesday’s pullback in USDJPY has not eliminated short-term upside potential, as bulls continue to defend the 147.85 area, while bears may only gain traction if the price drops below 146.65.