Sample Category Title
Elliott Wave View: Impulsive Rally In FTSE Favors Upside
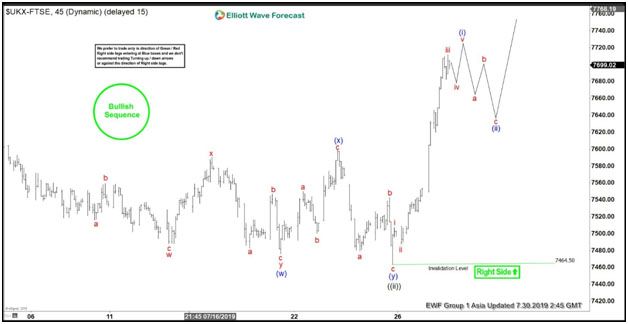
Elliott Wave view suggests FTSE ended a double three correction in wave ((ii)) on July 25 low (7464.50). We can see from the chart below the internal of wave ((ii)) as a double three. Wave (w) ended at 7475.49, wave (x) ended at 7598.60, and wave (y) of ((ii)) ended at 7464.50. After ending wave ((ii)) pullback, the rally in FTSE from July 25 low (7464.50) is unfolding a 5 waves impulse structure. In addition, the Index also shows an Elliott Wave bullish sequence from June 3 low (7079.71) and December 27, 2018 low (6536.53). This suggests that further upside is favored as far as pivot at 7464.50 low stays intact.
Up from 7464.50 low, wave i ended at 7506.85, wave ii ended at 7486.74, and wave iii ended at 7711.34. Expect Index to pullback in wave iv then do another leg higher in wave v before ending wave (i) in higher degree. Alternatively, wave (i) could have already ended and Index can start wave (ii) pullback already. Wave (ii) pullback should unfold in 3, 7, or 11 swing. As far as pivot at 7464.50 low stays intact, expect Index to see more upside.
FTSE 1 Hour Elliott Wave Chart
USD/CAD Daily Outlook
Daily Pivots: (S1) 1.3147; (P) 1.3165; (R1) 1.3181; More...
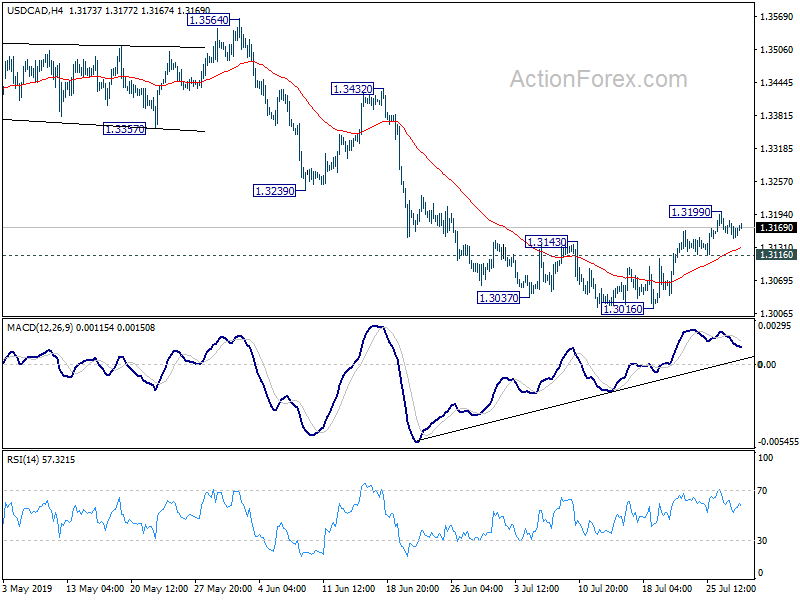
USD/CAD's rebound lost momentum ahead of 55 day EMA and intraday bias is turned neutral first. For now, further rebound is mildly in favor with 1.3116 minor support intact. Break of 1.3199 will target 1.3564/3664 resistance zone. On the downside, break of 1.3116 minor support will turn bias back to the downside for 1.3016 low instead.
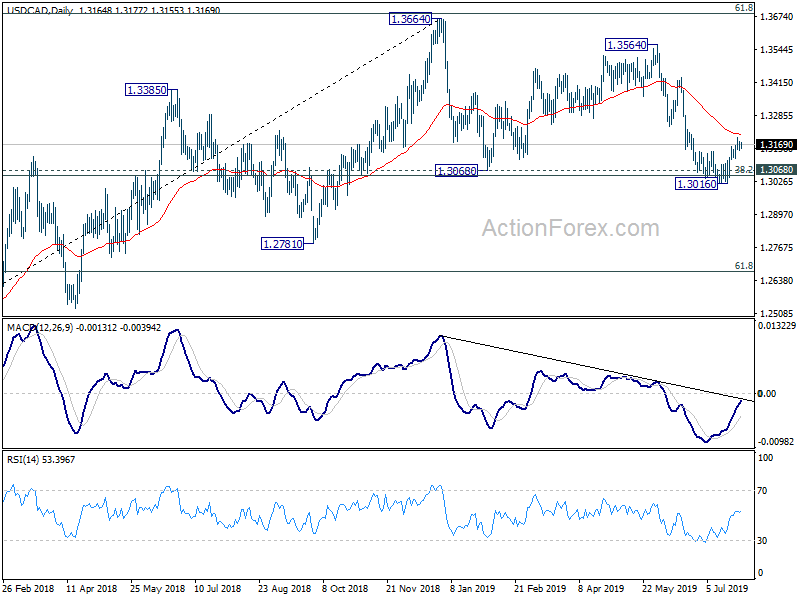
In the bigger picture, focus stays on 1.3068 cluster support (38.2% retracement of 1.2061 to 1.3664 at 1.3052) will confirm completion of up trend from 1.2061 (2017 low). Further fall should be seen to 61.8% retracement at 1.2673 next. On the upside, sustained break of 61.8% retracement of 1.4689 (2016 high) to 1.2061 at 1.3685, is needed to confirm resumption of up trend from 1.2061 (2017 low). Otherwise, risk will stay on the downside.
Euro Trading A Tad Lower In The Asian Session
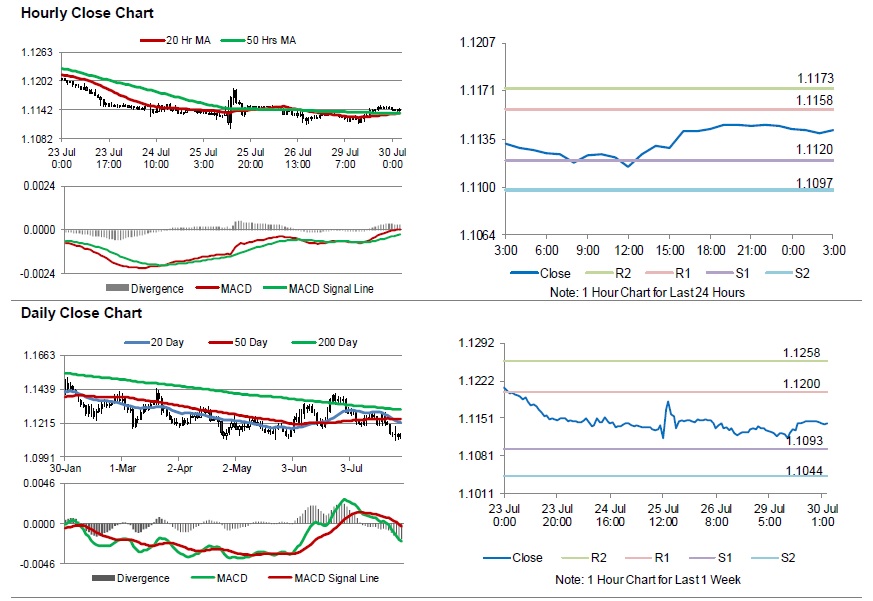
For the 24 hours to 23:00 GMT, the EUR rose 0.11% against the USD and closed at 1.1145.
In the US, data showed that the Dallas Fed manufacturing business index rose to a level of -6.3 in July, compared to a level of -12.1 in the previous month. Market participants had anticipated the index to record an advance to a level of -6.0.
In the Asian session, at GMT0300, the pair is trading at 1.1142, with the EUR trading slightly lower against the USD from yesterday’s close.
The pair is expected to find support at 1.1120, and a fall through could take it to the next support level of 1.1097. The pair is expected to find its first resistance at 1.1158, and a rise through could take it to the next resistance level of 1.1173.
Looking ahead, traders would keep an eye on Euro-zone’s economic confidence, industrial confidence, services confidence and consumer confidence indices, all for July followed by Germany’s consumer price index for July and the Gfk consumer confidence index for August, set to release in a few hours. Later in the day, the US personal income, personal spending and pending home sales, all for June, along with the consumer confidence index for July, will garner significant amount of investors’ attention.
The currency pair is trading above its 20 Hr and 50 Hr moving averages.
UK’s Mortgage Approvals Advanced More-Than-Expected In June
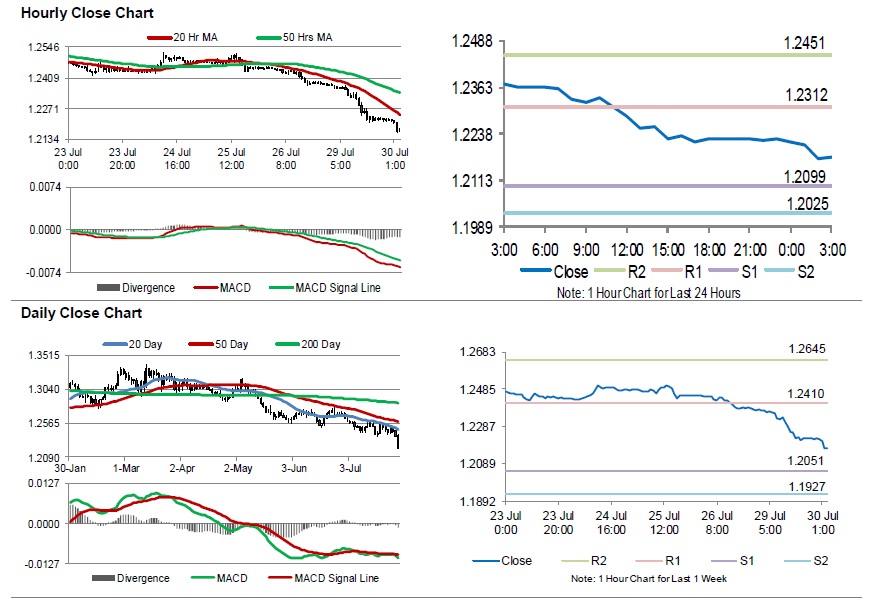
For the 24 hours to 23:00 GMT, the GBP declined 1.23% against the USD and closed at 1.2224, after Boris Johnson’s government reiterated that Britain is prepared to leave the European Union without a deal on 31 October, unless the European Union renegotiated.
On the data front, UK’s net consumer credit advanced £1.0 billion in June, following a revised rise of £0.9 billion in the prior month. Moreover, the nation’s mortgage approvals for house purchases climbed to a level of 66.4K in June, higher than market consensus for a rise to a level of 65.8K. In the previous month, mortgage approvals for house purchases had registered a revised level of 65.6K.
In the Asian session, at GMT0300, the pair is trading at 1.2174, with the GBP trading 0.41% lower against the USD from yesterday’s close.
The pair is expected to find support at 1.2099, and a fall through could take it to the next support level of 1.2025. The pair is expected to find its first resistance at 1.2312, and a rise through could take it to the next resistance level of 1.2451.
Trading trend in the Sterling today, is expected to be determined by UK’s GfK consumer confidence index and Lloyds business barometer, both for July, se to release overnight.
The currency pair is trading below its 20 Hr and 50 Hr moving averages.
BoJ Leaves Its Key Interest Rates Unchanged At -0.10%, Lowers Inflation Forecast
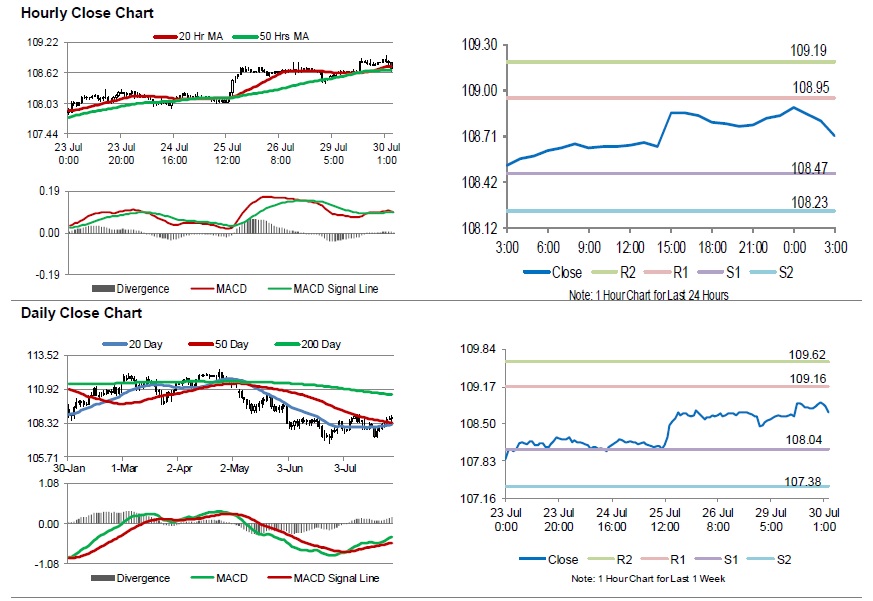
For the 24 hours to 23:00 GMT, the USD rose 0.33% against the JPY and closed at 108.84.
In the Asian session, at GMT0300, the pair is trading at 108.71, with the USD trading 0.12% lower against the JPY from yesterday’s close.
The Bank of Japan (BoJ), in its July monetary policy meeting, opted to leave its benchmark interest rate unchanged at -0.10%, as widely. The central bank stated that it will take additional easing measures if the economy loses momentum toward achieving the target inflation rate of 2%. Further, the bank decided to maintain interest rates at current ultra-low levels at least through around spring 2020. Meanwhile, the BoJ lowered its inflation forecast for fiscal 2019 to 1.0% from 1.1% and also downgraded its growth outlook for the fiscal 2019 to 0.7% from 0.8%.
On the macro front, Japan’s unemployment rate unexpectedly fell to 2.3% in June, defying market expectations for an unchanged reading. In the previous month, unemployment rate had recorded a reading of 2.4%. Meanwhile, the nation’s flash industrial production dropped 4.1% on an annual basis in June, marking its largest fall in 1 year and more than market consensus for a fall of 2.0%. In the prior month, industrial production slid 2.1%.
The pair is expected to find support at 108.47, and a fall through could take it to the next support level of 108.23. The pair is expected to find its first resistance at 108.95, and a rise through could take it to the next resistance level of 109.19.
In absence of key economic releases in Japan today, investor sentiment would be determined by global macroeconomic events.
The currency pair is showing convergence with its 20 Hr and 50 Hr moving averages.
Swiss Franc Extends Its Gains In The Morning Session
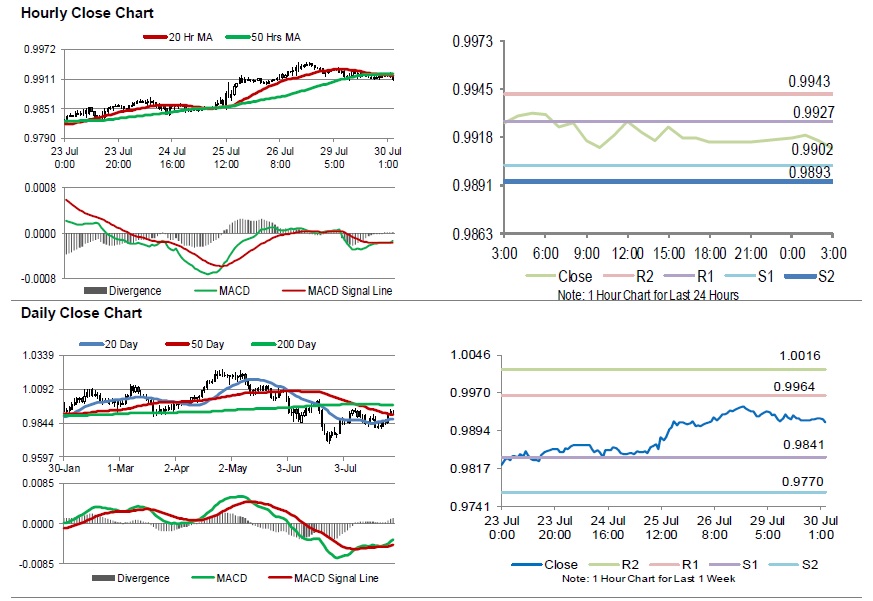
For the 24 hours to 23:00 GMT, the USD declined 0.06% against the CHF and closed at 0.9917.
In economic news, Switzerland’s total sight deposits rose to a level of CHF581.2 billion in the week ended 26 July 2019, from CHF579.5 billion in the previous week.
In the Asian session, at GMT0300, the pair is trading at 0.9911, with the USD trading 0.06% lower against the CHF from yesterday’s close.
The pair is expected to find support at 0.9902, and a fall through could take it to the next support level of 0.9893. The pair is expected to find its first resistance at 0.9927, and a rise through could take it to the next resistance level of 0.9943.
Going ahead, traders would await Switzerland’s KOF leading indicator for July, slated to release in a few hours.
The currency pair is showing convergence with its 20 Hr moving average and trading below its 50 Hr moving average
AUD/USD Daily Outlook
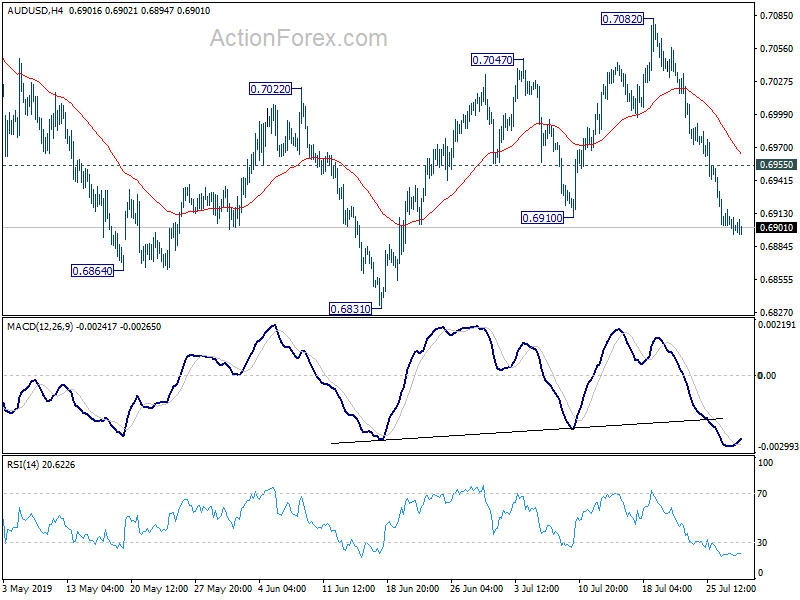
Daily Pivots: (S1) 0.6892; (P) 0.6904; (R1) 0.6914; More...
No change in AUD/USD's outlook. Corrective rebound from 0.6831 should have completed at 0.7082 already. The three wave corrective structure suggests that larger decline from 0.7295 is in progress and is possibly resuming. Further fall should be seen back to 0.6831 support first. Break will confirm and target 0.6722 low next. On the upside, break of 0.6955 minor resistance will turn intraday bias neutral again.
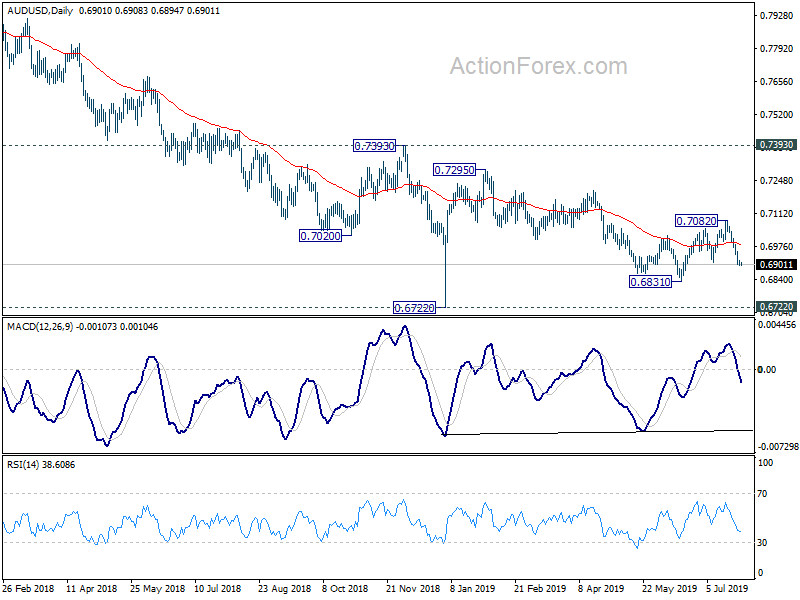
In the bigger picture, with 0.7393 key resistance intact, medium term outlook remains bearish. The decline from 0.8135 (2018 high) is seen as resuming long term down trend from 1.1079 (2011 high). Decisive break of 0.6826 (2016 low) will confirm this bearish view and resume the down trend to 0.6008 (2008 low). However, firm break of 0.7393 will argue that fall from 0.8135 has completed. And corrective pattern from 0.6826 has started the third leg, targeting 0.8135 again.
USD/JPY Daily Outlook
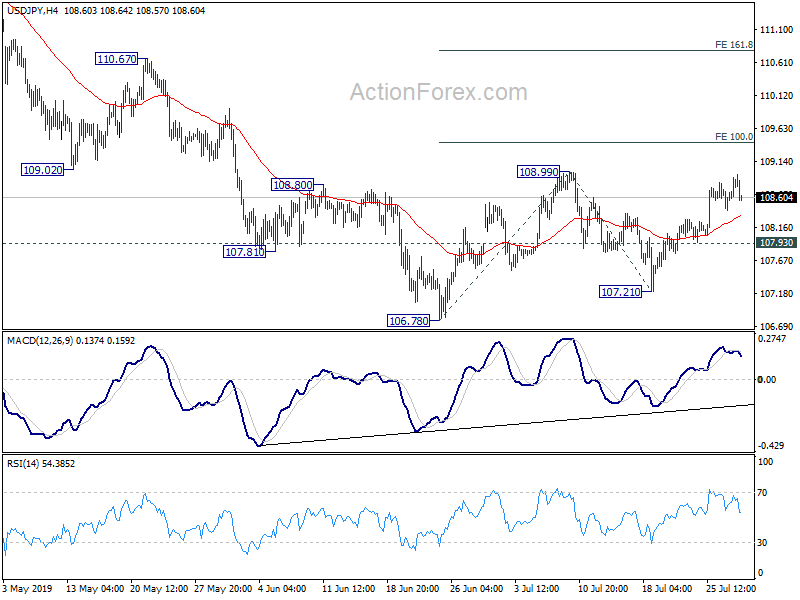
Daily Pivots: (S1) 108.51; (P) 108.70; (R1) 108.99; More...
Intraday bias in USD/JPY is turned neutral with 4 hour MACD crossed below signal line. Further rise is expected with 107.93 minor support intact. Break o 108.99 will resume the rebound from 106.78 for 100% projection of 106.78 to 108.99 from 107.21 at 109.42 and then 161.8% projection at 110.78. On the downside, below 107.93 minor support will turn bias back to the downside instead.
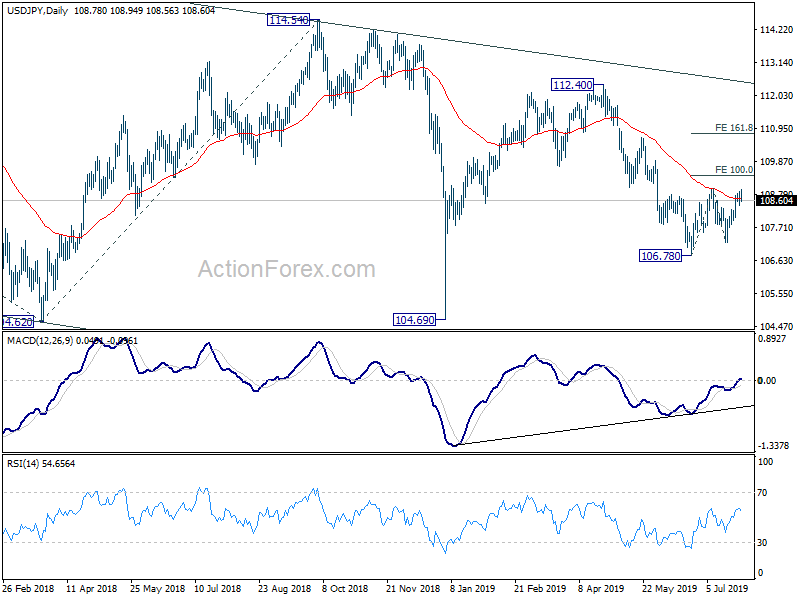
In the bigger picture, decline from 118.65 (Dec 2016) not completed yet, with the pair staying inside long term falling channel. Break of 104.62 will target 100% projection of 118.65 to 104.62 from 114.54 at 100.51. For now, we’d expect strong support above 98.97 (2016 low) to contain downside to bring rebound. In any case, break of 112.40 is needed to the first serious sign of medium term bullishness. Otherwise, further decline will remain in favor in case of rebound.
USD/CHF Daily Outlook
Daily Pivots: (S1) 0.9905; (P) 0.9921; (R1) 0.9934; More.....
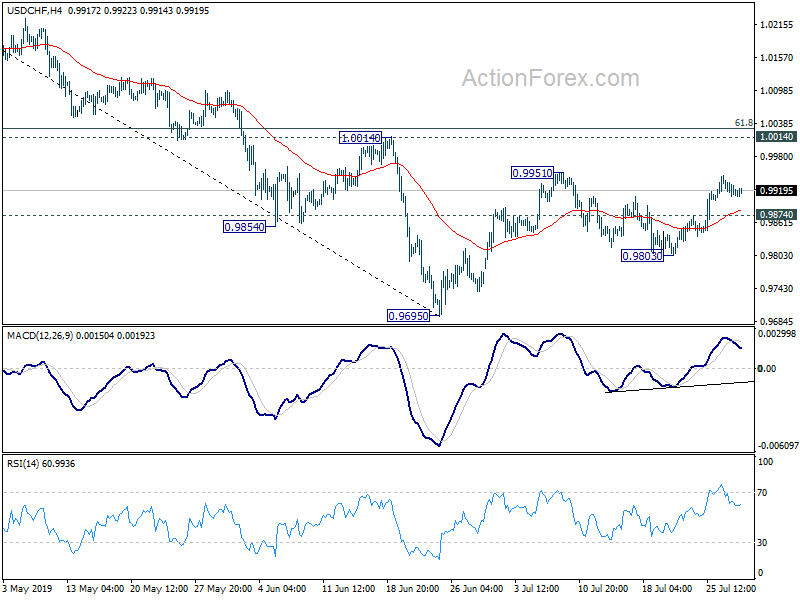
With 4 hour MACD crossed below signal line, intraday bias in USD/CHF is turned neutral first. Further rise is expected with 0.9874 minor support intact. Break of 0.9951 resistance will resume the rebound from 0.9695 to 1.0014 resistance next. On the downside, break of 0.9874 minor support will turn bias back to the downside for 0.9803 support and below.
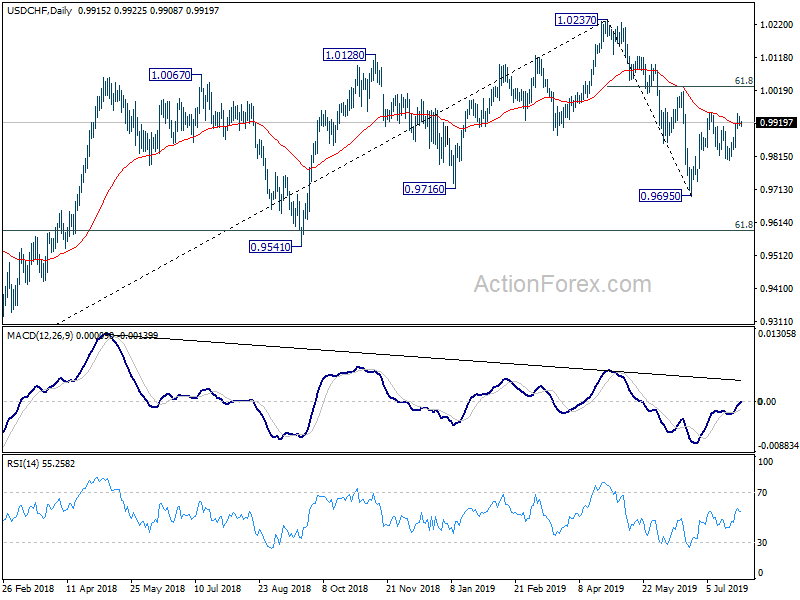
In the bigger picture, up trend from 0.9186 (2018 low) should have completed at 1.0237 already. Deeper decline would be seen to 61.8% retracement of 0.9186 to 1.0237 at 0.9587 and below. For now, USD/CHF is seen as in long term range pattern between 0.9186 and 1.0342. Hence, we'd pay attention to bottoming signal below 0.9587. However, sustained break of 1.0014 will revive medium term bullishness and turn focus back to 1.0237 high.
EUR/USD Daily Outlook
Daily Pivots: (S1) 1.1122; (P) 1.1136 (R1) 1.1160; More.....
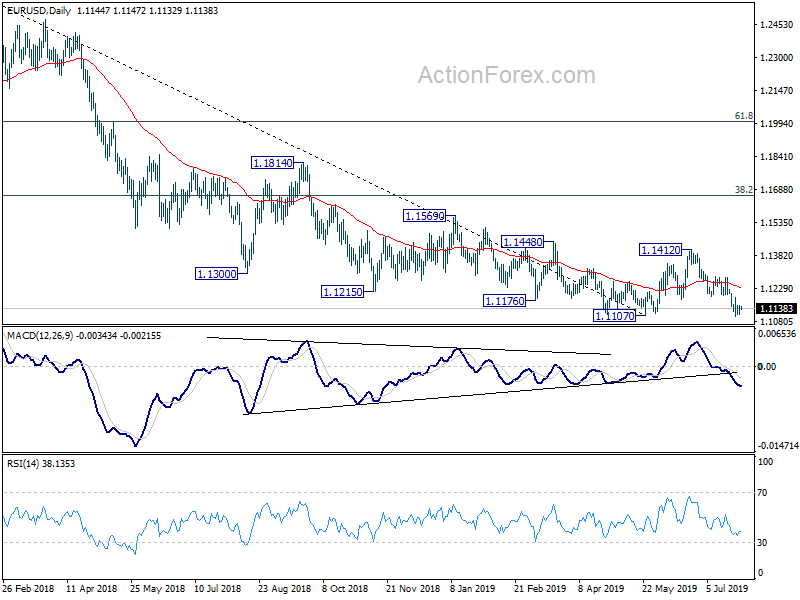
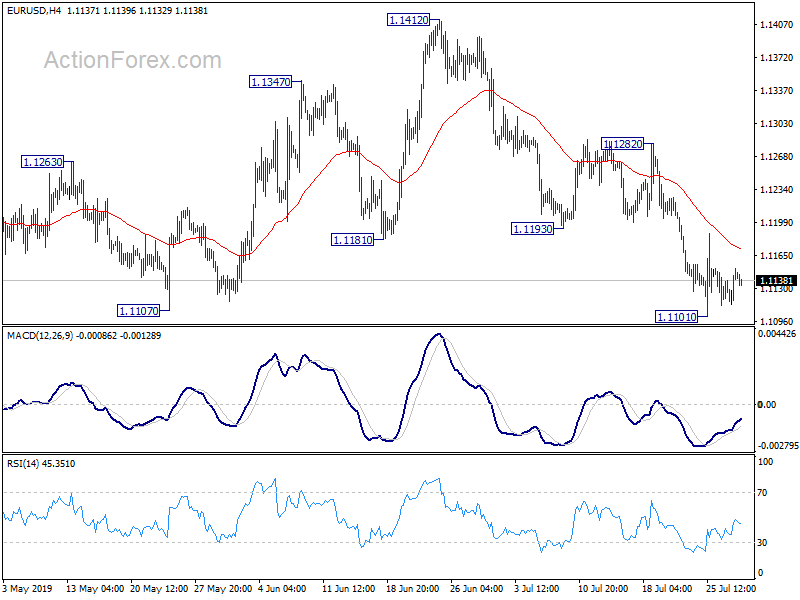
No change in EUR/USD's outlook and intraday bias remains neutral for consolidation above 1.1101 temporary low. Another recovery cannot be rule out. But still, as long as 1.1282 resistance holds, further decline is expected. Sustained break of 1.1107 low will resume larger down trend from 1.2555. Though, firm break of 1.1282 will bring stronger rise to 1.1412 resistance.
In the bigger picture, on the one hand, 1.1107 is seen as a medium term bottom on bullish convergence condition in weekly MACD. On the other hand, rejection by 55 week EMA retains medium term bearishness. Outlook stays neutral for now. On the downside, break of 1.1107 will resume the down trend from 1.2555 (2018 high) to 78.6% retracement of 1.0339 to 1.2555 at 1.0813. Meanwhile, break of 1.1412 will resume the rebound to 38.2% retracement of 1.2555 to 1.1107 at 1.1660.