Sample Category Title
EUR/USD Outlook: Extended Consolidation Likely To Precede Fresh Attack At Key 1.11 Support Zone
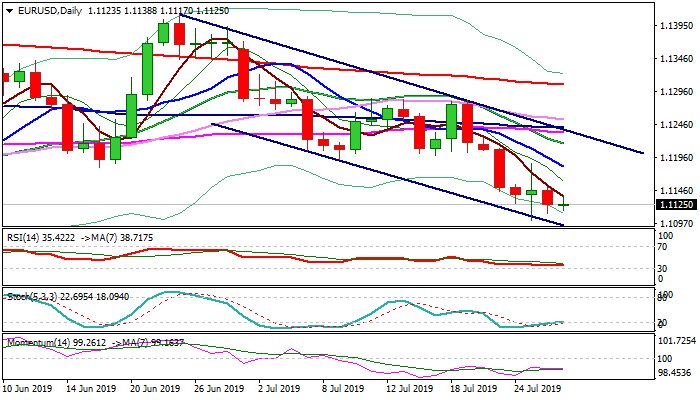
The Euro holds in extended consolidation above new 2019 low (1.1101) but remains biased lower, following limited upside action and technical studies in full bearish setup.
Bears look for eventual break through cracked key 1.11 support zone that would open way towards psychological 1.10 support.
Meanwhile, the pair may hold in prolonged consolidation, awaiting fresh signals from Fed rate decision later this week.
Fresh upticks can be also anticipated as daily stochastic is emerging from oversold territory, but flat momentum warns of another limited recovery attempt.
Falling 5DMA offers immediate resistance at 1.1137, with more significant barriers at 1.1180/90 zone (10DMA / former congestion lows), expected to cap and keep larger bears intact.
Only firm break above 1.1211/17 (Fibo 61.8% of 1.1280/1.1101 / 20DMA) would sideline bears and signal further recovery.
Res: 1.1137, 1.1150, 1.1190, 1.1211
Sup: 1.1117, 1.1101, 1.1050, 1.1019
USD Keeps Gain After GDP Release
The USD remained rather strong against a number of its counterparts after the release for the preliminary US GDP for Q2. The GDP growth rate outperformed expectations reducing worries for a prolonged easing period by the Fed were reduced. The Fed is widely expected to cut rates in its next meeting, yet analysts point out that the cut may be of a preemptive nature. It should be noted that other currencies such as the EUR and the GBP have been weak for the past few days underscoring the strength of the USD. We expect volatility to be maintained for the USD this week as the Fed’s interest rated decision on Wednesday and the Employment data on Friday are due out. EUR/USD remained below the 1.1140 (R1) resistance line during today’s Asian session, maintaining a rather sideways motion. We could see the pair have some bullish tendencies, should the market start positioning itself for the FOMC interest rate decision on Wednesday. Should the pair’s long positions be favored by the market, we could see it breaking the 1.1140 (R1) resistance line and aim for the 1.1180 (R2) resistance level. Should EUR/USD come under the selling interest of the market, we could see it breaking the 1.1100 (S1) support line and aim for lower grounds.
Oil remains rather steady in midst of talks with Iran
Oil prices remained rather steady despite worries seemingly easing somewhat about Iran. Iran had described emergency talks with some of the signatories of the Iran nuclear deal as constructive, easing worries somewhat. It should be noted though that there are still unresolved issues and Persia is expected to continue to reduce its commitments on its nuclear program, if European counterparts fail to strike a deal. Also, please bear in mind that tensions seem to be still ongoing near the straits of Hormuz, as the Iranians have still not released the British tanker seized. Also there seems to be an effort to form a multinational naval force to guard safe passage for shipping at the sensitive area. On another front the US-Sino negotiations are to restart and could also affect oil prices. WTI prices, maintained a rather range bound motion on Friday and today during the Asian session, comfortably supported by the 56.00 (S1) support line. Should the bears dictate the commodity’s direction, we could see it breaking the 56.00 (S1) support line and aim for the 54.45 (S2) support barrier. Should the bulls take over, we could see it breaking the 57.70 (R1) resistance line and aim for higher grounds.
Other economic highlights, today and early tomorrow
It could be a slow Monday today, yet tomorrow during the Asian session, we get BoJ’s interest rate decision. The bank is widely expected to remain on hold at -0.10%, yet the accompanying statement’s tone could be tilted to the dovish side. Should that be the case we could see the JPY slipping somewhat.
As for the rest of the week:
On Tuesday, Eurozone’s preliminary CPI rate for July, the US consumer confidence for July and the US Pending home sales also for July. On Wednesday, we get Australia’s CPI rate for Q2, China’s NBS Mfg PMI for July, Germany’s employment data for July and Canada’s GDP for June and the long awaited FOMC interest rate decision for the US. On Thursday, we get China’s Caixin Mfg PMI for July, from the UK BoE’s interest rate decision and form the US the ISM manufacturing PMI for July. On Friday, we get from Australia June’s retail sales growth rate, the US employment report for July, the US factory orders growth rate for June and Canada’s trade balance for June.
EUR/USD H4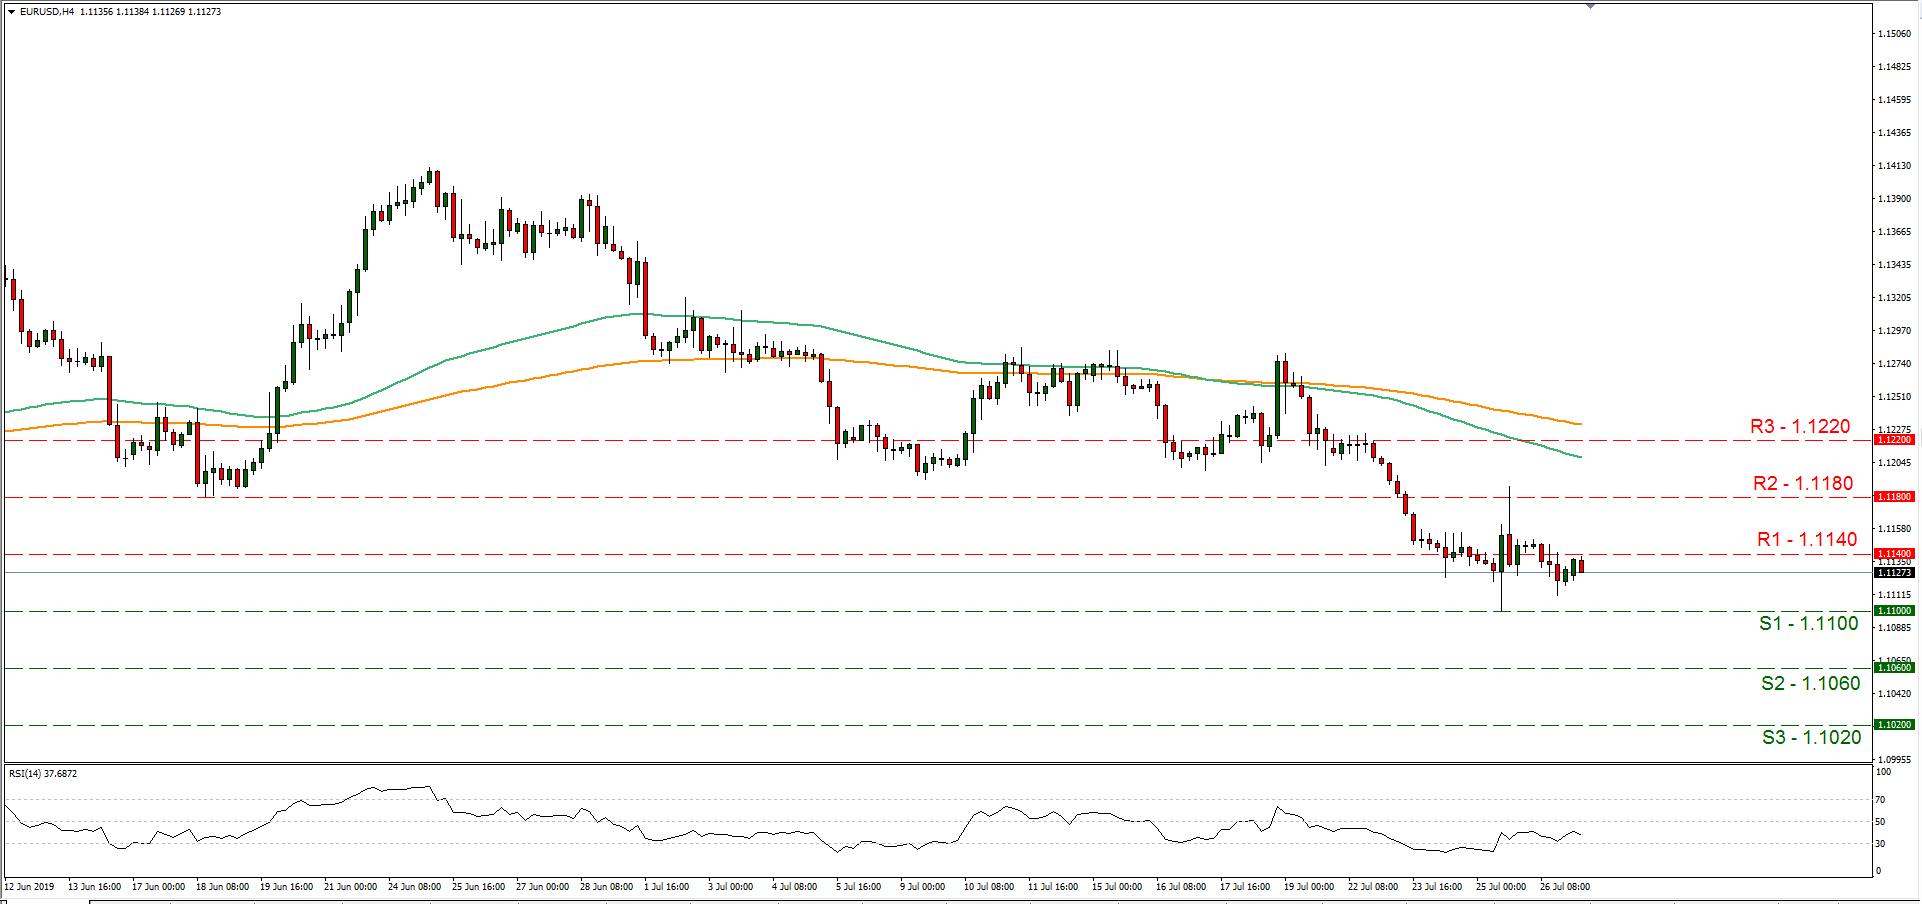
Support: 1.1100 (S1), 1.1060 (S2), 1.1020 (S3)
Resistance: 1.1140 (R1), 1.1180 (R2), 1.1220 (R3)
WTI H4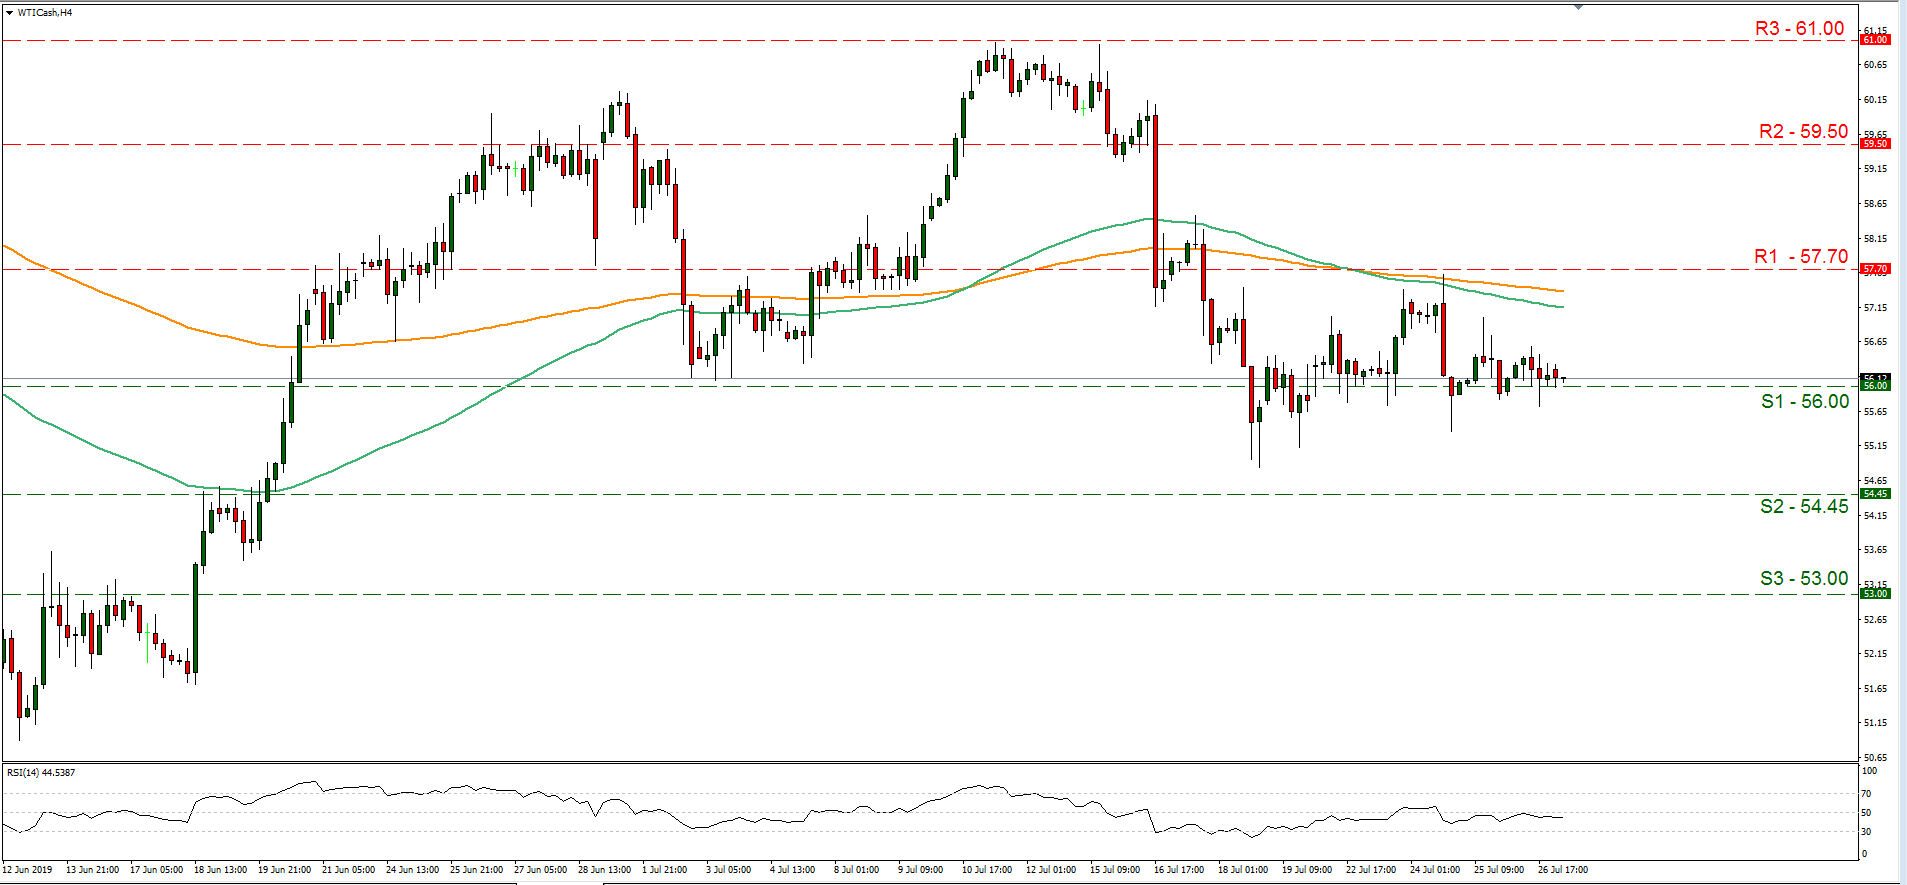
Support: 56.00 (S1), 54.45 (S2), 53.00 (S3)
Resistance: 57.70 (R1), 59.50 (R2), 61.00 (R3)
EUR/JPY Stranded Between SMAs
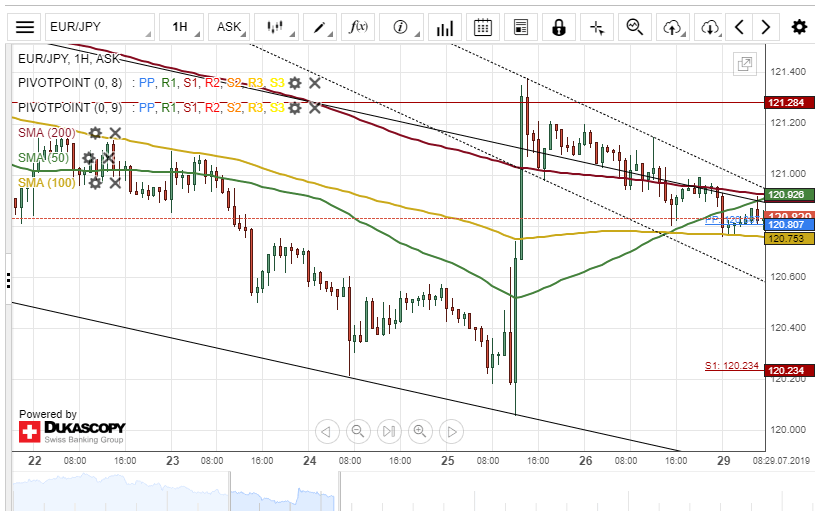
The single European currency is currently trading in a narrow descending channel pattern against the Japanese Yen.
The 50– and 200-hour SMAs were providing resistance for the currency pair at 120.89 during the morning hours of Monday's trading session, while the 100-hour simple moving average and the weekly pivot point at 120.75 was providing support.
Most likely, the exchange rate could edge higher within this session. Bullish traders could target the 121.28.
However, the resistance cluster formed by the 50– and 200-hour SMAs might hinder such movement today.
AUD/USD Reaches Three-Week Low
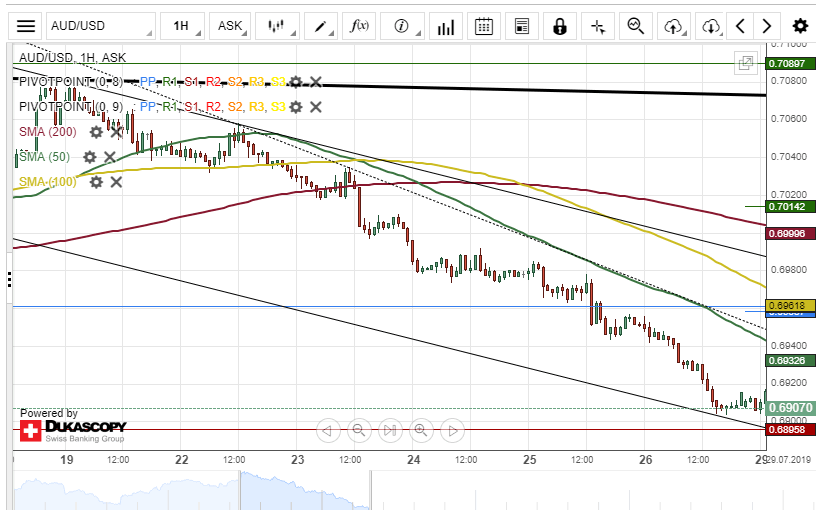
The Australian Dollar has been guided lower against the US Dollar by the 50-hour simple moving average. The currency pair reached a three-week low at 0.6907 during the Asian session on Monday.
Currently, the exchange rate is trading near a support level formed by the monthly S1 at 0.6895.
If the support level holds, a potential upside reversal could occur during the following trading session.
However, technical indicators suggest that the currency exchange rate might break the monthly support level today.
USD/CAD Supported By 50-Hour SMA
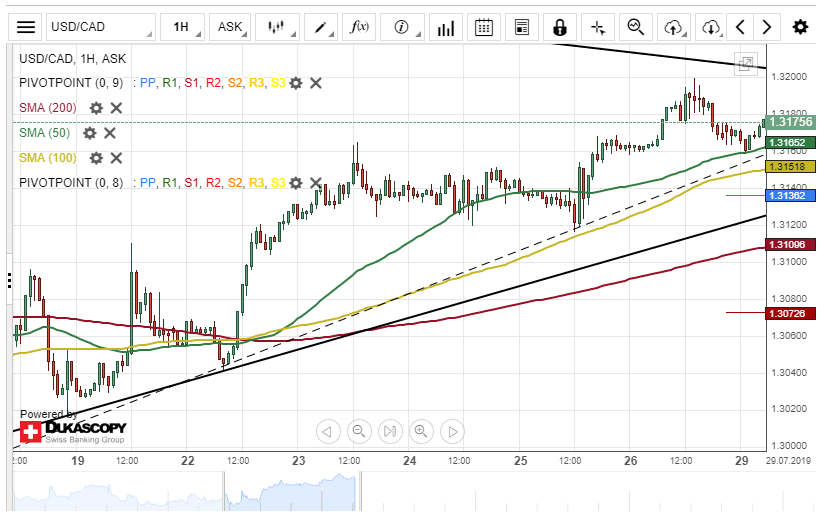
The 50-hour simple moving average was providing support for the US Dollar against the Canadian Dollar at 1.3158 during the morning hours of Monday's trading session.
If the support level continues to hold today, a surge towards a resistance line formed by the monthly pivot point at 1.3228 could be expected during the following trading session.
However, the upper boundary of a dominant descending channel at 1.3195 could provide resistance for the currency exchange rate.
In the meantime, technical indicators flash bullish signals on the 4(H) time frame chart.
NZD/USD No Support Level
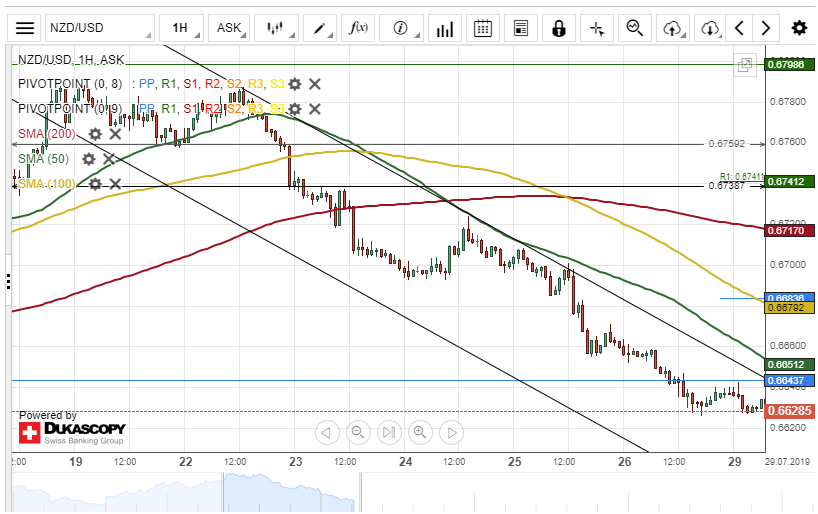
The New Zealand Dollar has been pressured south against the US Dollar by the 50-hour simple moving average since July 22. The currency pair breached the monthly pivot point at 0.6643 on Friday.
Given that there is no immediate barrier that could hinder the pair's movement, the exchange rate could aim for a support level at 0.6579 during the following trading session.
On the other hand, the currency exchange rate could reverse from the current price level at 0.6630 and target a resistance cluster formed by the 100-hour SMA and the weekly PP at 0.6683 today.
GBP/JPY Daily Outlook
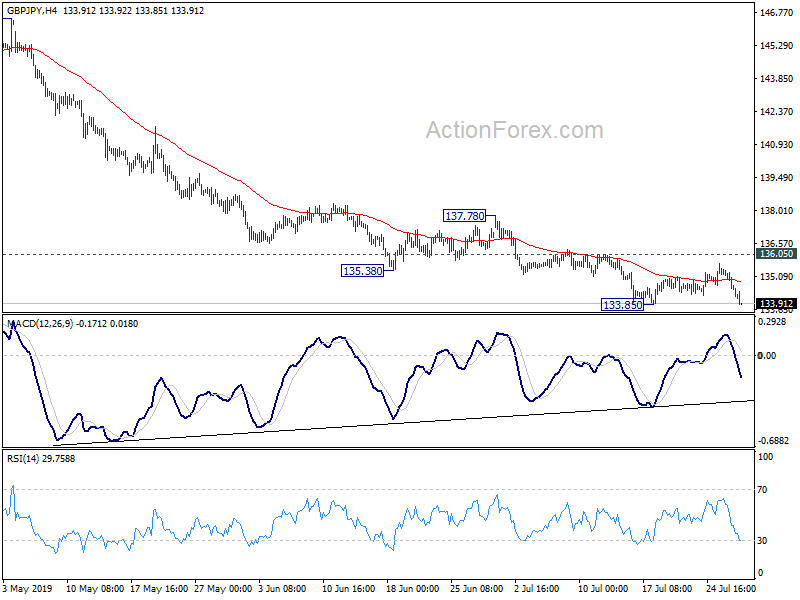
Daily Pivots: (S1) 134.28; (P) 134.84; (R1) 135.14; More...
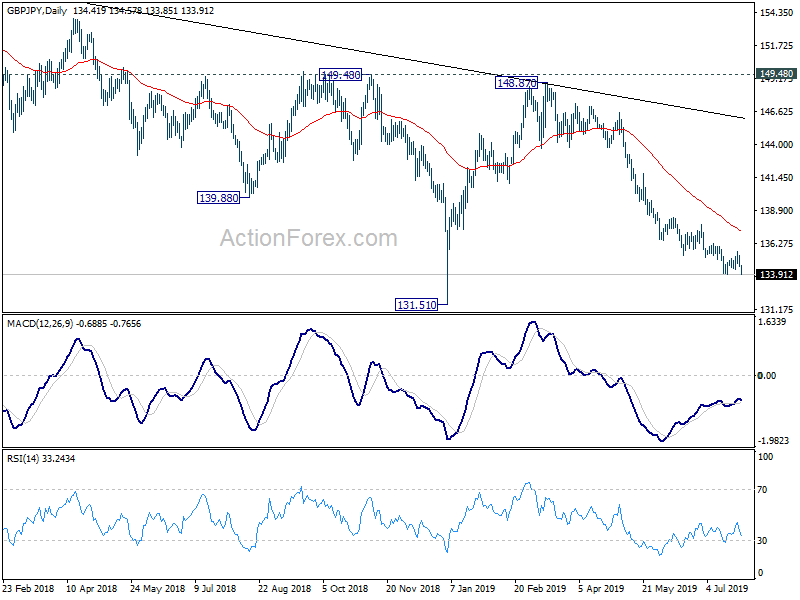
GBP/JPY drops sharply today and it's now pressing 133.85 support. Break will confirm resumption of decline from 148.87 to retest 131.51 low. In case of another recovery, upside should be limited by 136.05 resistance to bring fall resumption eventually.
In the bigger picture, medium term fall from 156.59 (2018 high) is still in progress. Break of 131.51 will target 122.36 (2016 low). Structure of such decline is corrective looking so far, arguing that it's just the second leg of consolidation from 122.36. Thus, we'd expect strong support from 122.36 to contain downside to bring reversal.
Forex Technical Analysis: EUR/USD, USD/JPY, GBP/USD
EUR/USD
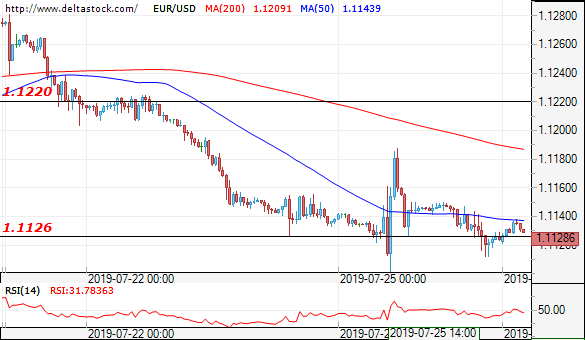
Current level - 1.1128
The pair is going for a test of the support at the 1.1110-1.1100 zone. Break here will create an opportunity for a further drop to 1.0900. First resistance is the 1.1190-1.1200 zone.
| Resistance | Support | ||
| intraday | intraweek | intraday | intraweek |
| 1.1200 | 1.1280 | 1.1110 | 1.0930 |
| 1.1280 | 1.1350 | 1.1050 | 1.0850 |
USD/JPY
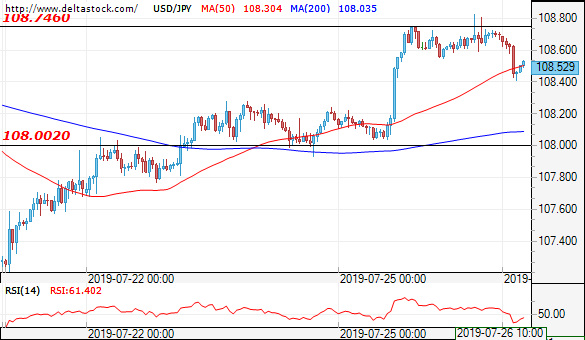
Current level - 108.52
As long as the pair is trading above the support at 108.35 the uptrend is intact for a test and a break of 108.95.
| Resistance | Support | ||
| intraday | intraweek | intraday | intraweek |
| 108.80 | 109.80 | 108.35 | 106.70 |
| 109.00 | 112.40 | 107.20 | 104.50 |
GBP/USD
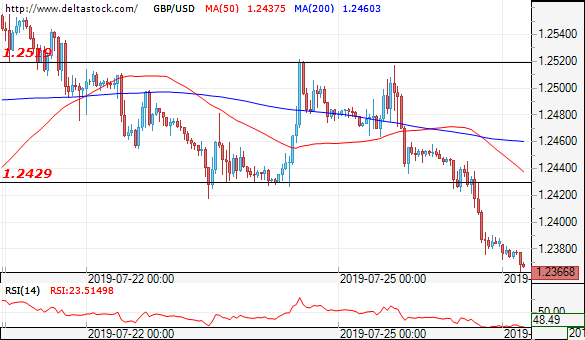
Current level - 1.2366
After the break of the support at 1.2429 and 1.2380 the pair is looking for a test of 1.2110. Key resistance is 1.2519.
| Resistance | Support | ||
| intraday | intraweek | intraday | intraweek |
| 1.2520 | 1.2660 | 1.2380 | 1.2320 |
| 1.2560 | 1.2890 | 1.2320 | 1.2110 |
Action Packed Week Ahead | Oil Short Bets Climbed To Highest Level In 11 Months
Traders are cautious today and no one is in mood to make bigger bets ahead of action packed week. Basically there is no time for trades to have any kind of break or in other words “sell in May and go away” term isn’t valid for this years. The reason is that the Federal reserve is about to make a major change in its monetary policy which investors have not witnessed in almost a decade.
Analysts are united for the first time in their prediction and the expectations are that the chairman of the Federal Reserve is going to cut the interest rate in order to boost the economy. We think that the interest rate cut is going to be 25 basis points and this should start providing some aid to stubborn inflation numbers which are not moving in the direction where the Fed wants it.
So what does this mean for the dollar index and for the stock markets? Well, the dollar index hasn’t lost much of steam although there was a major roller coaster event last week when Donald Trump decided that he is not going to start a currency war. Thus, we do not expect the dollar index to give up much ground and the uptrend is highly likely to stay intact.
As for the precious metal, it is holding its key psychological support level of 1400 and all eyes are on this. Gold price should not break this level and if the Wednesday’s event pushes the gold price lower than it means an emergence of a new trend. For the time being, the price is still trading in a bullish flag pattern on a daily time frame. The price is also trading above the 50-day , 100day and 200-day moving averages, and all of this together, strengthens the bull case.
In the commodity space, oil price- WTI continues to trade near the $56 mark as tensions continue to simmer about the Strait of Hormuz. The UK’s new prime minister has decided to use naval war ships to escort the oil vessels. On the China-US trade talk front, there isn’t much progress made and this hasn’t helped the oil demand. Until and unless we see some a clear solution on this, it is likely that the demand will continue to suffer as a result of this. Looking at the CFTC data, short bets have jumped the most in nearly 11 months and this means that the speculators are expecting the price to move lower which does seem a little odd because geopolitical tensions over in the Middle East is a serious matter of concern.
EUR/JPY Daily Outlook
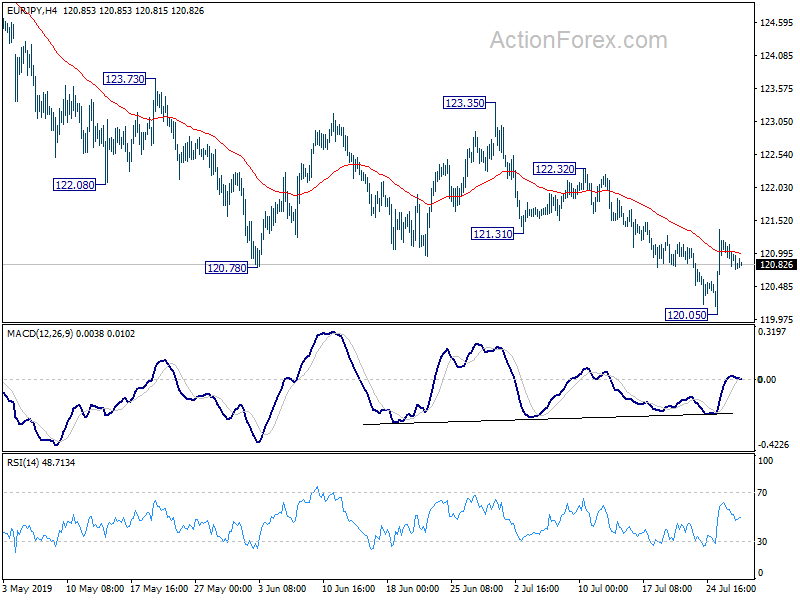
Daily Pivots: (S1) 120.75; (P) 120.99; (R1) 121.17; More...
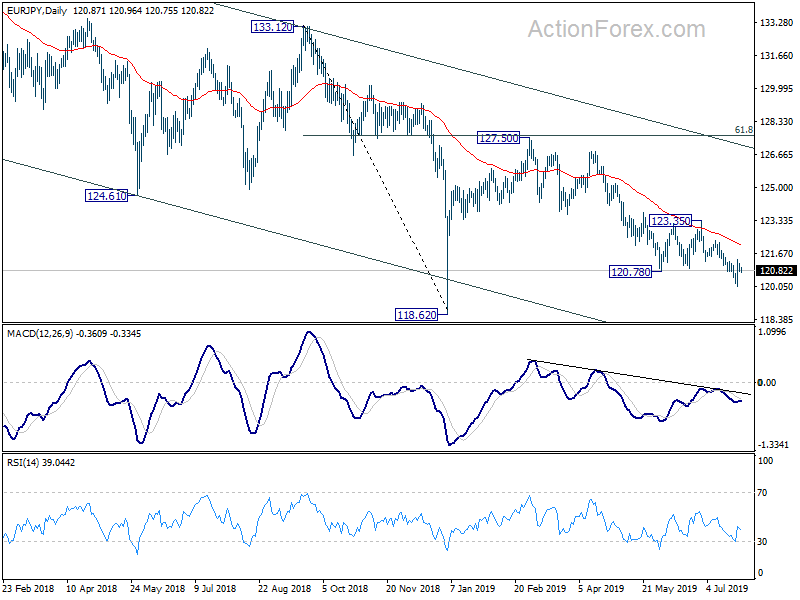
Intraday bias in EUR/JPY remains neutral at this point. Another recovery could be seen. But outlook remains bearish as long as 122.32 resistance holds. On the downside, break of 120.05 will resume the decline from 127.50 for retesting 118.62 low. Though, break of 122.32 would indicate short term bottoming and bring stronger rebound to 123.35 resistance and above.
In the bigger picture, down trend from 137.49 is still in progress with the cross staying well inside long term falling channel, and below falling 55 week EMA. Break of 118.62 will extend the fall to 109.48 (2016 low). On the upside, break of 127.50 resistance is needed to be the first sign of medium term reversal. Otherwise, outlook will remain bearish in case of strong rebound.