Sample Category Title
The Analytical Overview Of The Main Currency Pairs
The EUR/USD currency pair
Technical indicators of the currency pair:
Prev Open: 1.12155
Open: 1.12087
% chg. over the last day: -0.12
Day's range: 1.11890 – 1.12094
52 wk range: 1.1111 – 1.2009
The bearish mood prevails on the EUR/USD currency pair. Trading instrument updated the local lows. At the moment, the key support and resistance levels are 1.11850 and 1.12100. Financial markets participants are no longer sure that Fed will introduce a sharp reduction in the interest rate at the next meeting. Demand for USD slightly recovered. Quotes can decline further. You should open positions from key levels.
At 17:00 (GMT+3:00) the US will publish a secondary real estate sales report.
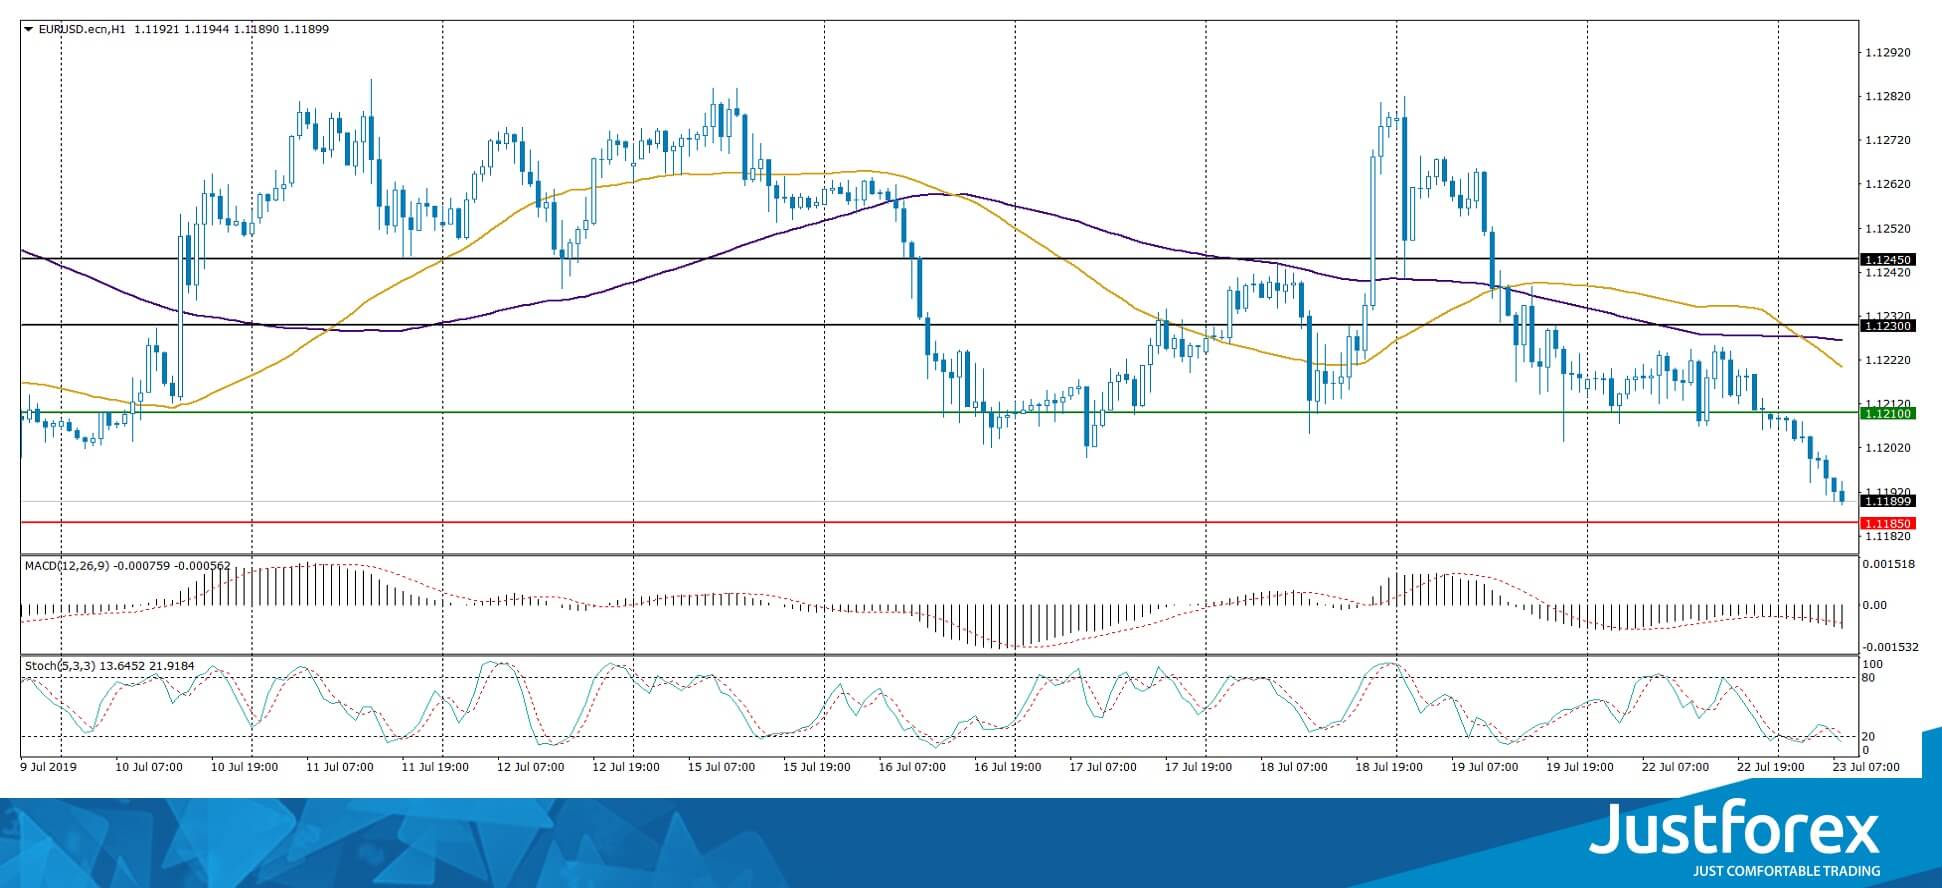
Indicators point to the strength of sellers: the price has fixed below 50 MA and 100 MA.
The MACD histogram is in the negative zone and below the signal line, which indicates a further drop in EUR/USD quotes.
Stochastic Oscillator is near the oversold zone, the %K line is below the %D line, which gives a weak signal to sell EUR/USD.
Trading recommendations
Support levels: 1.11850, 1.11500
Resistance levels: 1.12100, 1.12300, 1.12450
If the price fixes below 1.11850, expect further decline toward 1.11500-1.11300.
Alternatively, the quotes can grow toward 1.12300-1.1240.
The GBP/USD currency pair
Technical indicators of the currency pair:
Prev Open: 1.24313
Open: 1.24673
% chg. over the last day: -0.31
Day's range: 1.24505 - 1.24788
52 wk range: 1.2397 - 1.3385
An ambiguous technical picture emerged on the GBP/USD currency pair. GBP is movind sideways, the local levels of support and resistance are 1.24500 and 1.24850. GBP remains under pressure due to the uncertainty around Brexit. The quotes can descend further. We expect important reports from the United States. Positions must be opened from key levels.
The Economic News Feed for 23.07.2019 is calm.
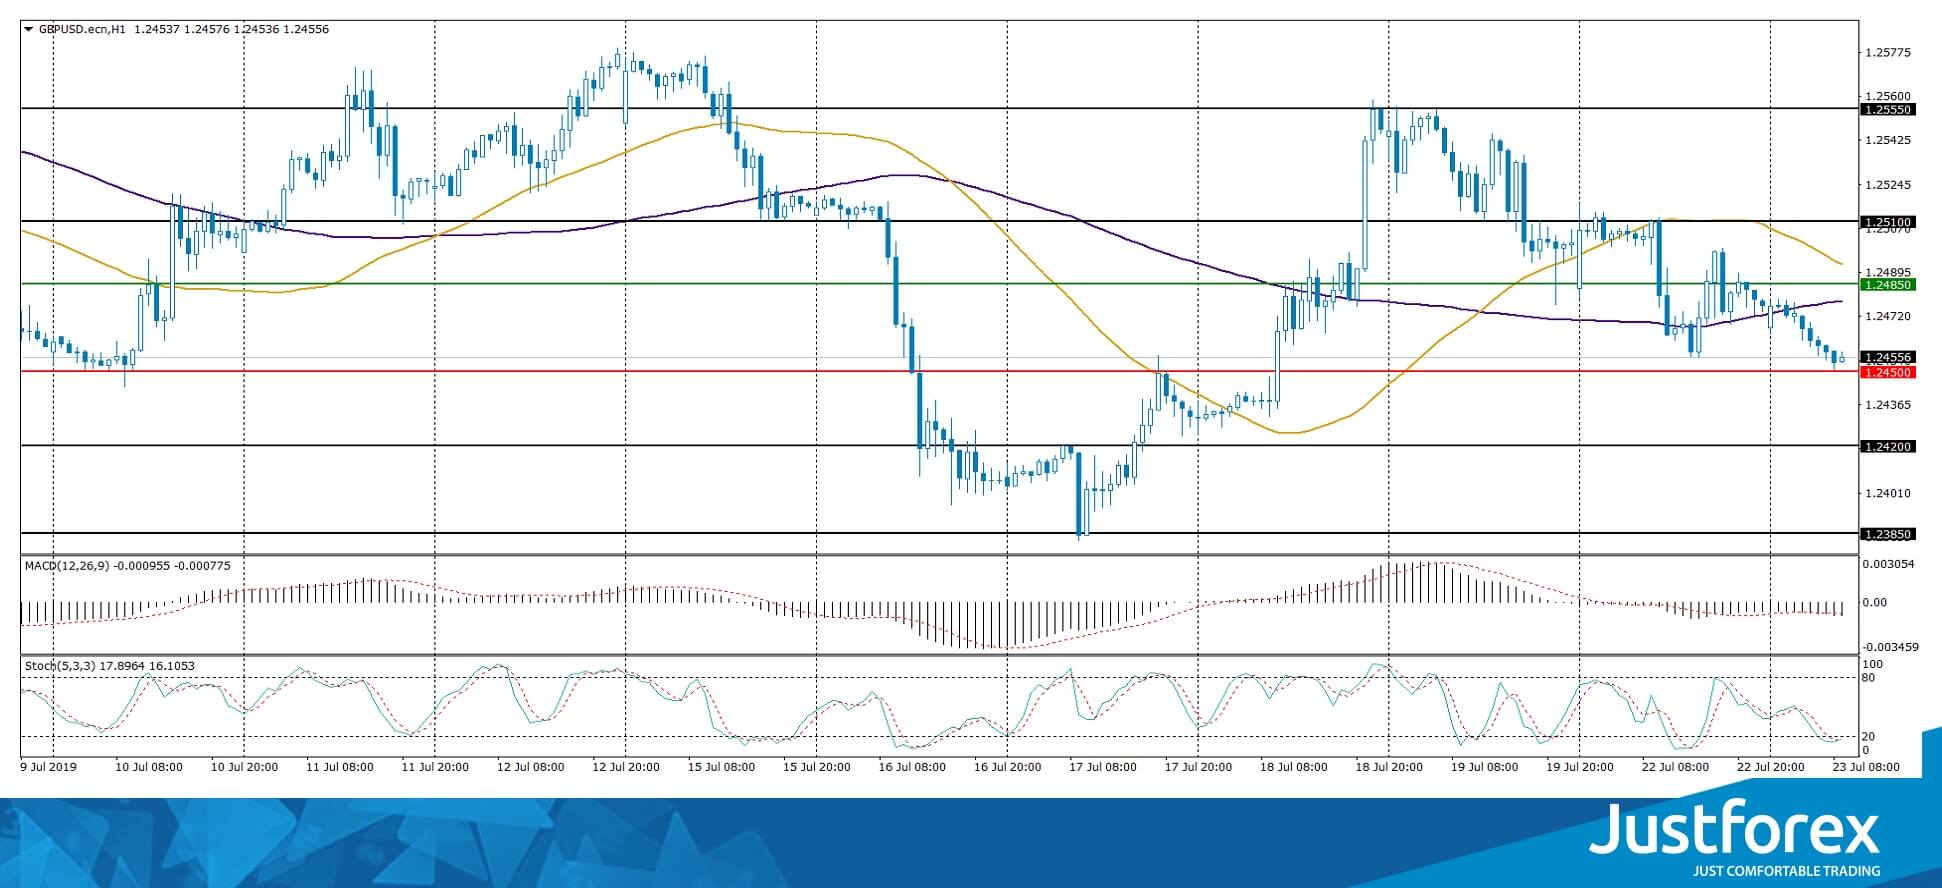
Indicators do not provide accurate signals, 50 MA started to cross 100 MA.
The MACD histogram is in the negative zone and below the signal line, indicating a drop in GBP/USD quotes.
Stochastic Oscillator is in the oversold zone, the %K line crossed the %D line. There are no signals at the moment.
Trading recommendations
Support levels: 1.24500, 1.24200, 1.23850
Resistance levels: 1.24850, 1.25100, 1.25550
If the price fixes below 1.24500, expect the qutoes to fall toward 1.24200-1.24000.
Alternatively, the quotes can grow toward 1.25100-1.25400.
The USD/CAD currency pair
Technical indicators of the currency pair:
Prev Open: 1.30520
Open: 1.31179
% chg. over the last day: +0.56
Day's range: 1.31126 - 1.31414
52 wk range: 1.2727 - 1.3664
There have been some aggressive purchases on the USD/CAD currency pair. Trading tool updated key extremes. At the moment, Looney is testing a local resistance of 1.31400. Mark 1.31150 is already a “mirror” support. USD/CAD can grow further. We recommend to pay attention to the dynamics of oil prices. Positions must be opened from key levels.
The Economic News Feed for 23.07.2019 is calm.
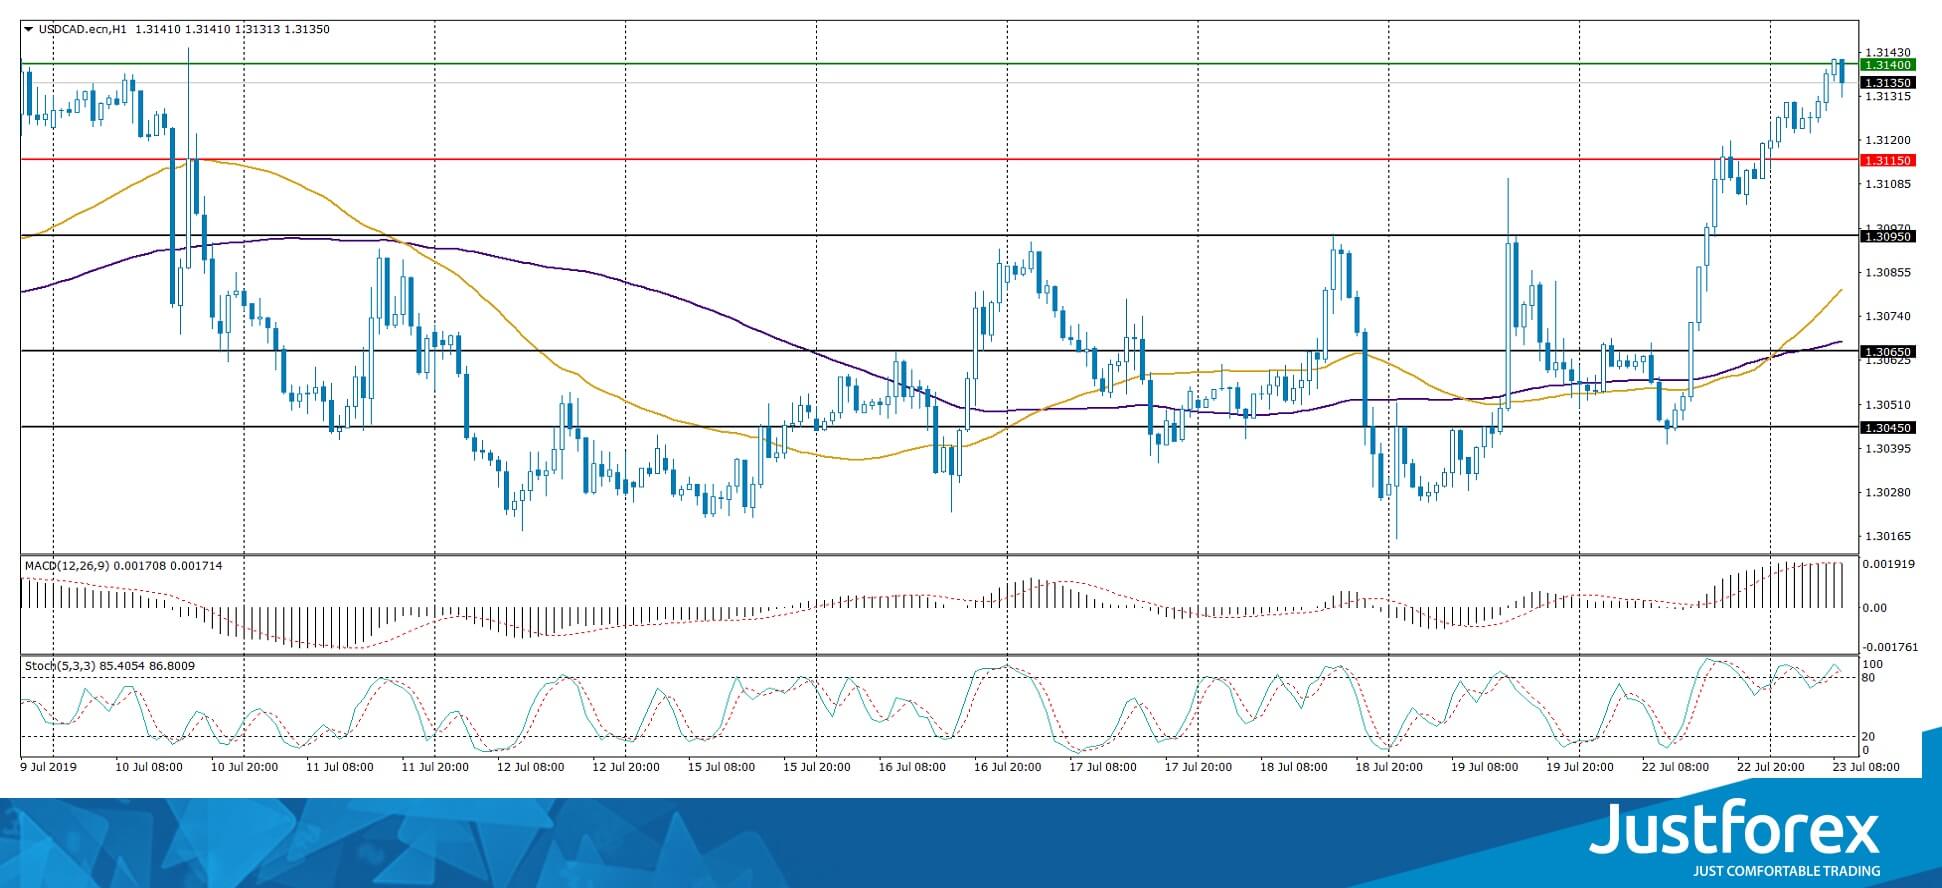
The price has fixed above 50 MA and 100 MA, which indicates the strength of buyers.
The MACD histogram is located in the positive zone and above the signal line, which gives a strong signal to buy USD/CAD.
Stochastic Oscillator is in the overbought zone, the %K line crossed the %D line. There are no signals at the moment.
Trading recommendations
Support levels: 1.31150, 1.30950, 1.30650
Resistance levels: 1.31400, 1.32000
If the price consolidates above 1.31400, expect further growth to 1.31800-1.32000.
Alternatively, the quotes canfakk toward 1.31000-1.30800.
The USD/JPY currency pair
Technical indicators of the currency pair:
Prev Open: 107.712
Open: 107.852
% chg. over the last day: +0.07
Day's range: 107.826 - 108.193
52 wk range: 104.97 - 114.56
Buyers prevail on the USD/JPY. The trading instrument has updated local maximums. At the moment, the USD/JPY quotes are testing the supply zone of 108.200-108.350. The key support is 107.900. The currency pair can grow further. Pay attention to economic releases, as well as the US Treasury bond's yield. Open positions from the key levels.
The Economic News Feed for 23.07.2019 is calm.
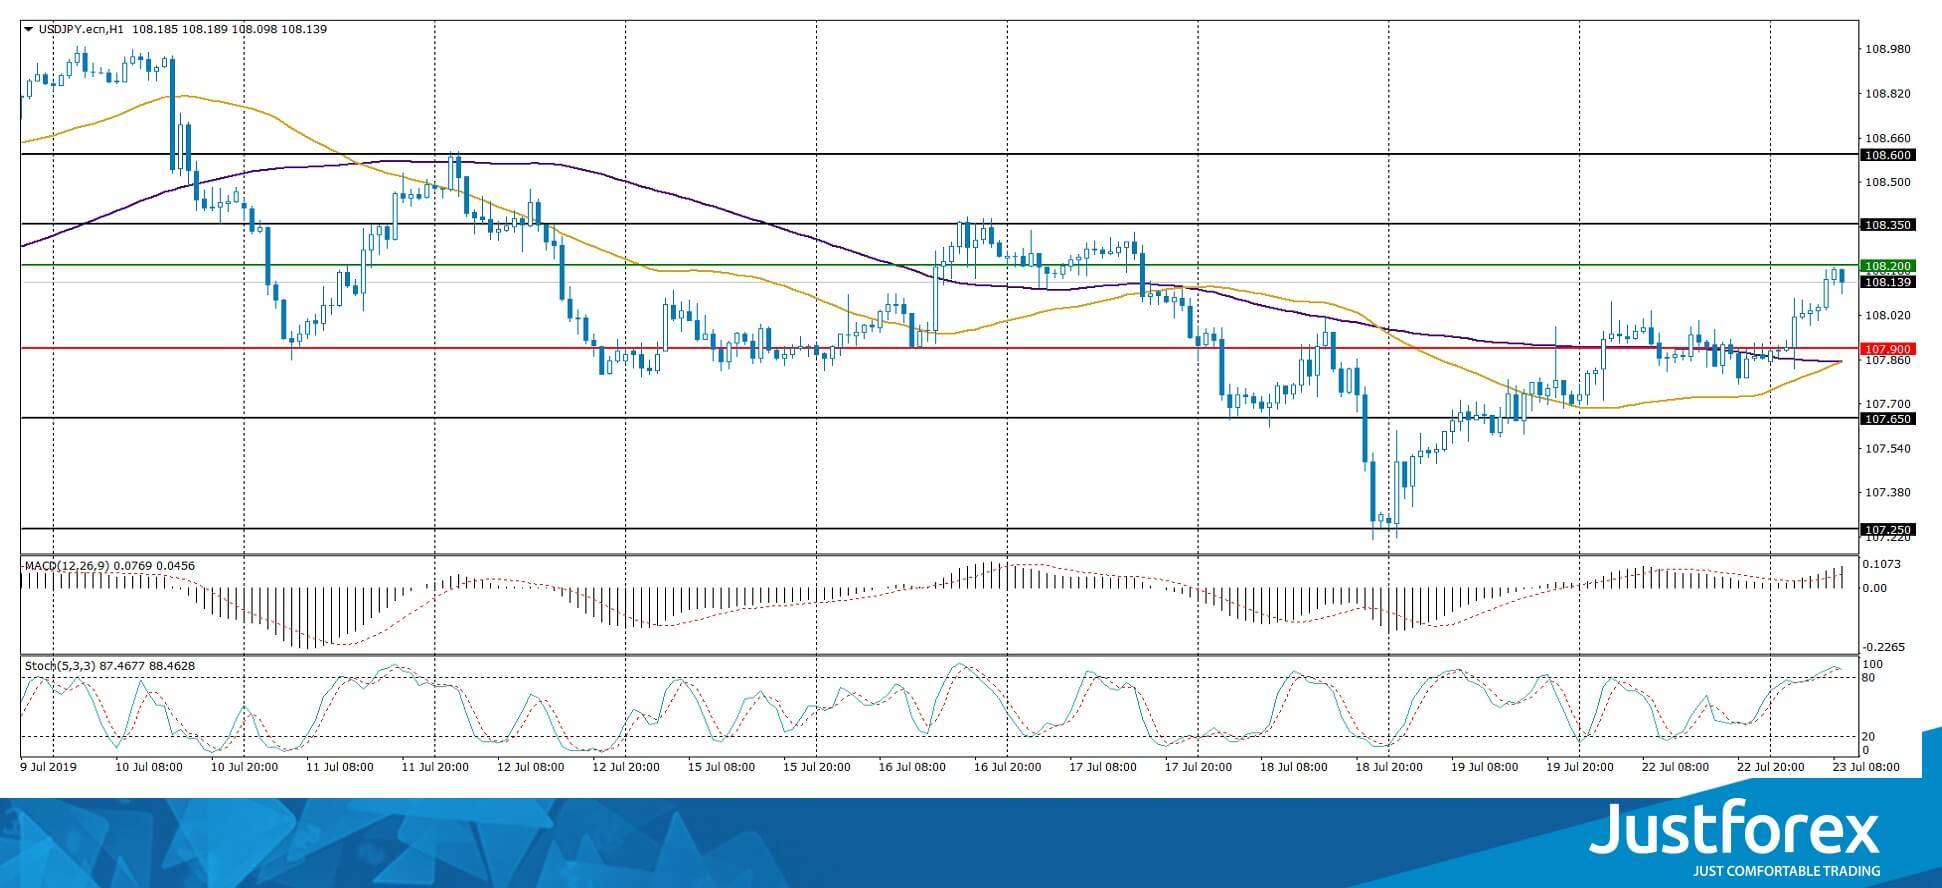
The indicators do not provide precise signals.
The MACD histogram is in the positive zone and above the signal line, which gives a signal to buy USD/JPY.
The Stochastic Oscillator is i the overbought zone, the %K line crossed the %D line. There are no singals.
Trading recommendations
Support levels: 107.900, 107.650, 107.250
Resistance levels: 108.200, 108.350, 108.600
If the price consolidates above the 108.200 mark, the quotes can grow toward 108.500-108.700.
Alternatively, the quotes can descend toward 107.700-107.500
European Open – UK PM Announcement Imminent
Europe higher but major events lie ahead
Europe is off to a decent start although I don’t think we can read too much into early week gains given the vast majority of the major market events will come over the next few days, and even into next week if you include the Fed announcement, after which summer may unofficially properly start.
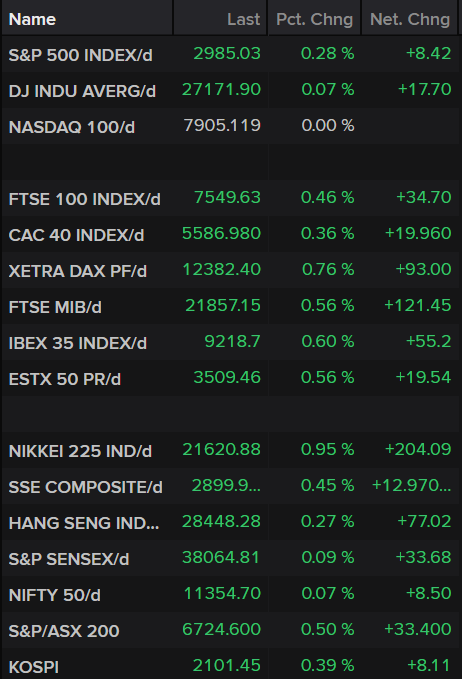
Of course, the new UK PM will be announced around lunchtime today which is clearly a hugely important event but with Boris Johnson such a clear favourite, markets may not be as responsive as you would maybe expect, with much of his negative points – most notably his views on no-deal – being priced in.
Of course, we’ve had many shocks in recent years, could Hunt be the next? This could be a big shock for markets but arguably a positive one for sterling given Hunt’s past remain bias and opposition to no-deal.
Of course, he hasn’t rejected it altogether and has claimed the backstop is dead but he’s arguably seen as being far more moderate than his opponent.
BoE Saunders: There’s a tension, disparity between forecasts and actual policy vote
Comments of BoE hawk Michael Saunders suggest that he won't be pushing for rate hike for now. He said in a Bloomberg interview that "the economy right now is clearly not overheating -- the underlying pace of growth, stripping out all of the funny effects, inventories, car shutdowns and so forth, is weak and below trend". Thus, "the link from the forecast to my actual vote was quite loose."
He added, the most recent "forecast of excess demand and above-target inflation didn't at that point prompt me to vote for higher rates". And, "what you get then is a tension, a disparity, between the forecasts and the actual policy vote."
Regarding policy reaction to Brexit on October 31, he reiterated the central bank's stance that response wouldn't be automatic. "It's hard to know how it would play out with any certainty," he said. "I wouldn't want to give a strong steer now as to which way policy would go." Nevertheless, no matter what the BoE does, "monetary policy could not prevent a no-deal Brexit being painful for the economy, for businesses and for households."
EURGBP To Hold Uptrend In Near Term, 20-SMA Key Support
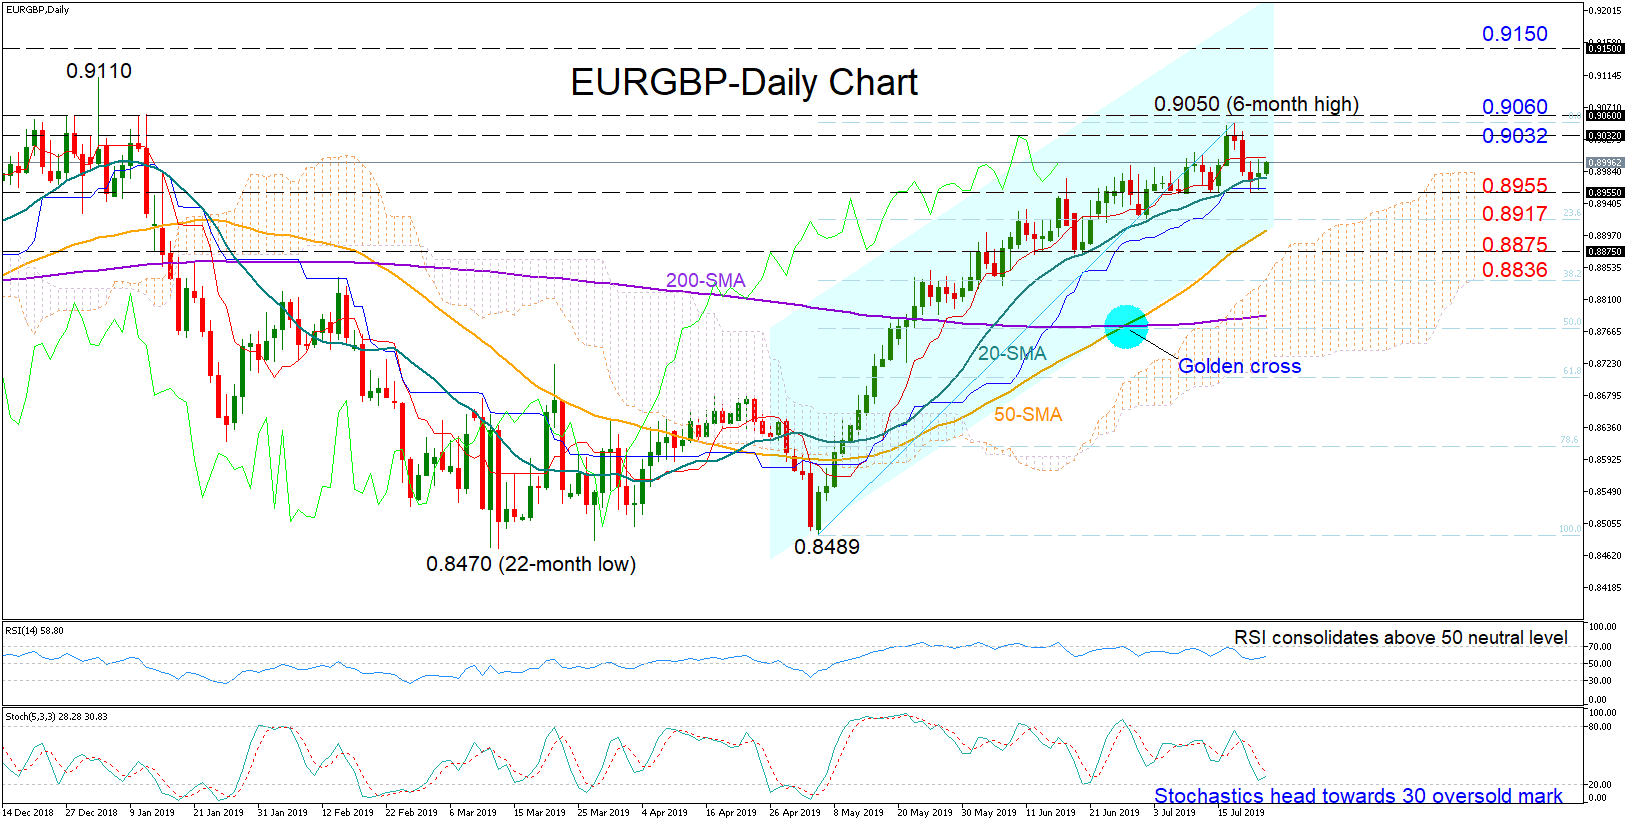
EURGBP has been in the green zone for the past twelve weeks, topping its rally at an almost six-month high of 0.9050 last week.
The 20-day simple moving average (SMA) has played a key role in rejecting bearish corrections and therefore should be closely watched if negative momentum resumes. The fast Stochastics, however, are currently approaching the 20 oversold mark, while the RSI and the red Tenkan-sen are in consolidation, all flagging an overall neutral-to-positive bias for the short-term.
Should the 20-day SMA assist the bulls once again, the price may retest key resistance within the 0.9032-0.9060 area. Crawling even higher, the pair would have to clear the 0.91 mark to challenge a former strong barrier around 0.9150.
If the bears manage to overcome the 20-day SMA currently at 0.8975 and break below Friday’s trough of 0.8955, traders could next look for support near 0.8917, the 23.6% Fibonacci retracement level of the upleg from 0.8489 to 0.9050. Further down and under the 50-day SMA. the way would open towards the 0.8875 mark and the 38.2% Fibonacci of 0.8836.
Meanwhile, in the medium-term picture, the golden cross between the 50- and the 200-day SMA keeps hopes for a brighter outlook alive.
In brief, the technical signals suggest a neutral-to-positive trading in the short-term and a bullish one for the medium-term.
Dollar Sails Higher, Boris Becomes Prime Minister
- Dollar advances on US debt ceiling accord; may have more room to climb
- Boris Johnson to become new UK Prime Minister – watch his Cabinet picks
- Loonie and kiwi lose ground, earnings season fires up
Greenback catches a bid after US debt ceiling deal
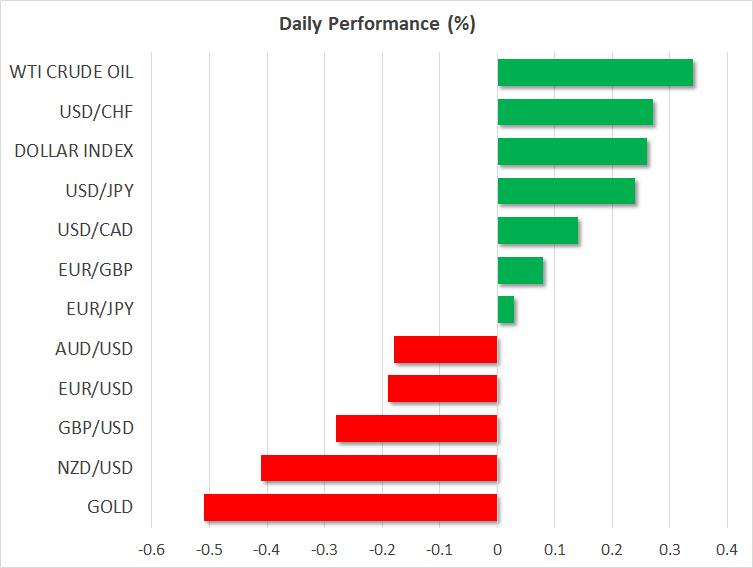
Market movements were relatively subdued on Monday, with most major currency pairs trading in narrow ranges, without much in the way of news flow to guide the price action. Things became more interesting overnight though, after the White House and Democrats in Congress reached a deal on America's debt ceiling, raising federal spending allowances and reducing the likelihood of a government shutdown.
The news put some wind back in the dollar's sails, as the risk of political gridlock subsided. Traders could also be scaling back some of their euro exposure ahead of what promises to be a dovish-sounding ECB this week, amplifying the dollar's gains. On the Fed side, markets still discount a ~20% probability for a ‘double' rate cut at the July 31 meeting, which seems excessive.
In this sense, the risks around euro/dollar seem tilted to the downside for now, as besides the prospect of Draghi talking down the euro on Thursday, the dollar may also have more room to recover if bets for aggressive Fed action in July are gradually unwound.
Boris Johnson to become Britain's PM; all eyes on his Cabinet picks
Without any tier-one data releases today, investors will keep their gaze locked on the UK, where Boris Johnson is expected to become the next Prime Minister. He has been quite vocal that the UK is leaving the EU in October with or without a deal, “come what may” – which has inflicted considerable damage on the pound lately.
This week, the Cabinet ministers he chooses may prove crucial for sterling. If he fills the top government positions with die-hard Brexiteers – like Jacob Rees-Mogg – that could further raise the perceived probability for a disorderly exit given their inflexible views, and therefore bring the pound under renewed pressure.
In the bigger picture, the outlook for sterling remains gloomy. There's very limited potential for meaningful Brexit progress by October, and outside of that, the only thing that may be able to turn the tide is a General Election.
Loonie and kiwi surrender ground, earnings continue
Meanwhile, the Canadian dollar took a hit yesterday, after some disappointing wholesale trade data raised concerns for a weaker GDP print in Q2. Although this pullback may continue in the next days, especially if the US dollar advances further, the broader outlook for the loonie is still positive as long as the BoC remains unlikely to cut rates while other central banks are doing so.
In New Zealand, the local dollar is lower as well following reports that the RBNZ is looking at adding ‘unconventional' policies to its toolkit. This is likely a hint that the central bank could use Quantitative Easing (QE) in the future, if it runs out of space to cut rates.
Elsewhere, the US earnings season goes into full swing, with the likes of Coca Cola, Lockheed Martin, and Visa being among the most notable names releasing their quarterly results today.
The IMF will also update its global growth forecasts, which if revised substantially lower, may generate risk aversion.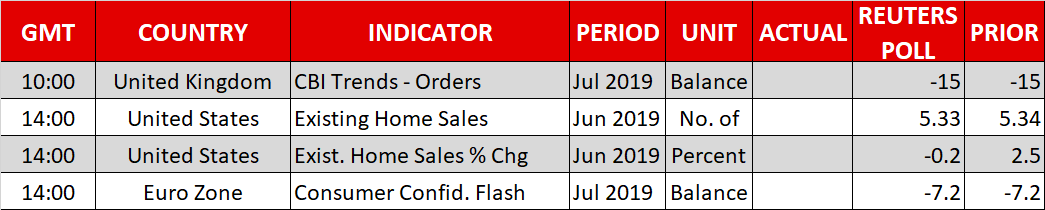
Forex Technical Analysis: EUR/USD, USD/JPY, GBP/USD
EUR/USD
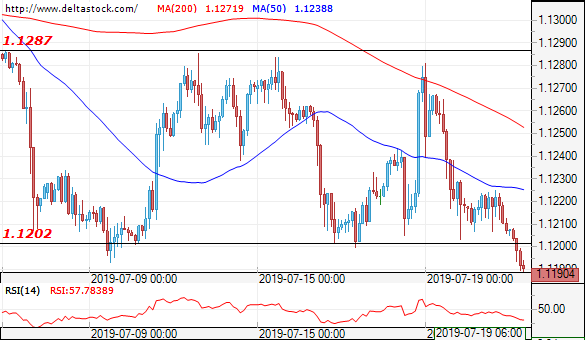
Current level - 1.1190
The pair continues to trade in the lower zone of the 1.120-1.1280 range. And an eventual break above 1.1285 would pave the way to 1.1450.
| Resistance | Support | ||
| intraday | intraweek | intraday | intraweek |
| 1.1285 | 1.1570 | 1.1180 | 1.1110 |
| 1.1350 | 1.1820 | 1.1110 | 1.1010 |
USD/JPY
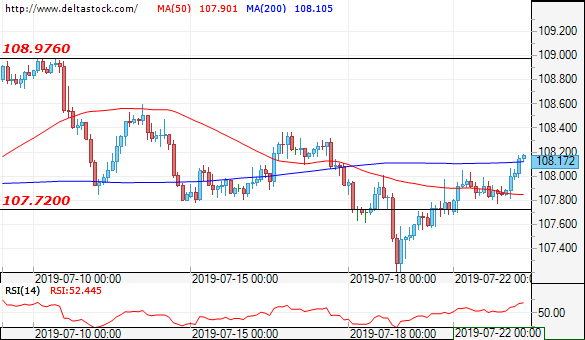
Current level - 108.17
Looks like the price is moving in a down channel and at the moment is at its upper band. It is possible to see a break of the channel and to renew the move towards 109.00.
| Resistance | Support | ||
| intraday | intraweek | intraday | intraweek |
| 108.10 | 109.80 | 107.55 | 106.70 |
| 108.90 | 112.40 | 106.70 | 104.50 |
GBP/USD
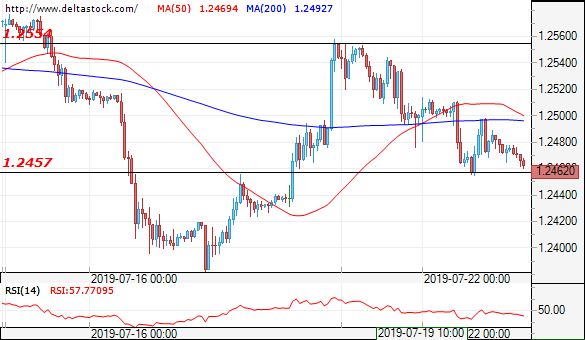
Current level - 1.2462
My expectation here is positive for a successful test and break of the 1.2555 zone. If the price successfully breaks 1.2555 we can expect a rise towards 1.2700.
| Resistance | Support | ||
| intraday | intraweek | intraday | intraweek |
| 1.2555 | 1.2800 | 1.2457 | 1.2380 |
| 1.2660 | 1.2890 | 1.2380 | 1.2110 |
How Sterling Is Likely To Perform Today
Boris Johnson is widely expected to become the next prime minister of the United Kingdom and his appointment comes with a resignation of a few minister who do not support his agenda. Boris wants to leave the UK on the 31 October with or without deal and this view isn’t supported my the members of his party such as the Chancellor of the Exchequer, Philip Hammond.
Since 2016, Sterling has been under tremendous pressure and mainly due to the lunatic behaviour of British politicians. They have made the British political system look like a circus. The threats which May faced with respect to her positions are going to be the same for Boris as well. Alan Duncan, a person who is not afraid to speak about his former boss, floated an idea in the House of Commons: if Boris actually deserved to be the Prime Minister and has the support of the parliament. But this was blocked by the speaker of the House of Commons John Bercow.
Conservatives do not hold majority in the parliament and getting the support of the law makers isn’t going to be a walk in park at all. The threat of another election is going to remain as strong as before. Nonetheless, with the appointment of Boris, we expect Sterling to continue to move lower as it only increases the risk of no-deal Brexit.
The Trade
On the daily time frame, sterling-dollar looks really weak, bears are in strong control. The price is trading below the 50-day moving average and as long as this remains the case, bulls do not have any hopes. The downward trend shows that every upward move was an opportunity to short the market. The near term support for Sterling is at 1.2360 and then at 1.2037 (March 2017 low).
GBP/USD Outlook: Bears Extend And Focus Key Support Ahead Of Election Of Britain’s New PM
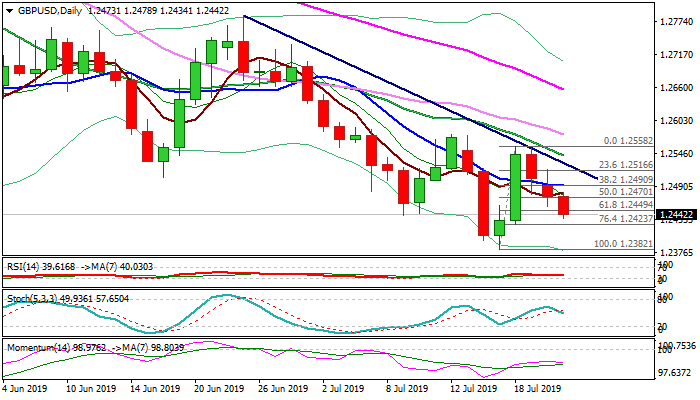
Cable stays in red for the third straight day and extended weakness from 1.2558/56 double-top to new two-week lows.
Monday’s close below 10DMA (1.2491) generated initial bearish signal, which was reinforced by Tuesday’s break below 1.2449 (Fibo 61.8% of 1.2382/1.2558 upleg).
Bears eye key support at 1.2382 (17 July low, the lowest since Apr 2017), violation of which would spark extension of larger downtrend from 1.3381 (2019 high).
Apr 2017 trough at 1.2365 marks immediate support but bears could extend towards 1.21 zone on stronger acceleration lower.
Broken 10DMA offers initial resistance at 1.2491 and is expected to cap and keep intact trendline resistance at 1.2522 (bear-trendline drawn off 25 June high at 1.2783) which maintains bearish bias.
Overall environment is negative for pound, as bearish sentiment persists among traders on concerns that Boris Johnson, who is likely to be elected today as Britain’s new Prime Minister, as well as the leader of governing Conservative Party, could pull the country out of the European Union without a trade deal that could have strong negative consequences on country’s economy.
Res: 1.2479, 1.2491, 1.2522, 1.2542
Sup: 1.2423, 1.2400, 1.2382, 1.2365
Gold Extends Declines As Investors Await Cues From Central Banks
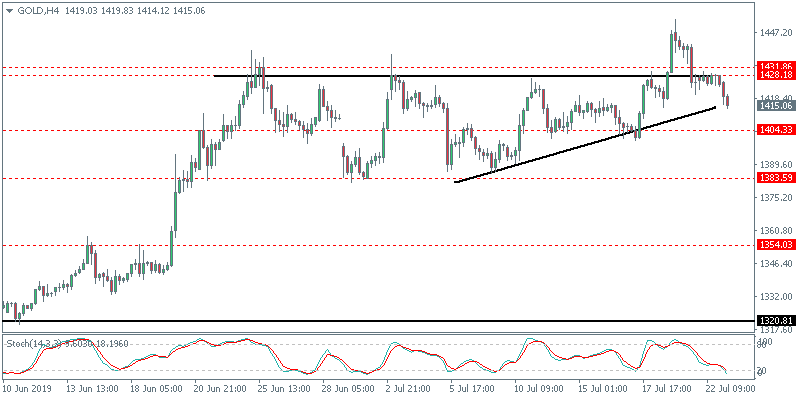
The precious metal was seen trading rather muted on Monday but nonetheless closed red. In the early Asian trading session, gold prices were seen resuming the declines as the momentum accelerated. Investors await two crucial central bank meetings that includes the ECB's monetary policy meeting this Wednesday and the FOMC meeting next week
Has XAUUSD formed a top?
The precious metal's sharp rally to the upside saw prices reversing rather quickly. Given the fact that gold slipped below the support area of 1431 – 1428, we expect price to post declines further. The lower support at 1404 will be the initial target. We expect the declines to stall near this support in the short term.
WTI Crude Oil Trades Flat, Awaits API Data Drops To A 5-Week Low
Crude oil prices were largely flat on Monday, marking a second consecutive day. While the tensions surrounding Iran seizing the British oil tanker continues, investors brushed aside the tensions. The American Petroleum Institute will be releasing its weekly crude oil inventory report today which is likely to move the oil markets later in the day.
Crude oil likely to maintain the sideways range
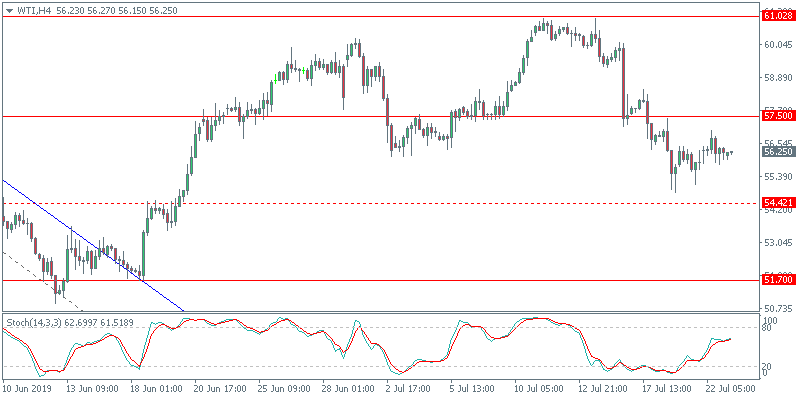
Oil prices have stabilized after breaking past the support area of 57.50. However, the declines below this level haven't seen oil testing the lower end of the range at 54.42. We expect this sideways range to continue in the short term. Today's API report could move the oil markets and the bias remains to the downside for now. A breakdown below 54.42 could spell further declines down to the 50.00.