Sample Category Title
US 500 Index Retreats Below Record High Of 3,020
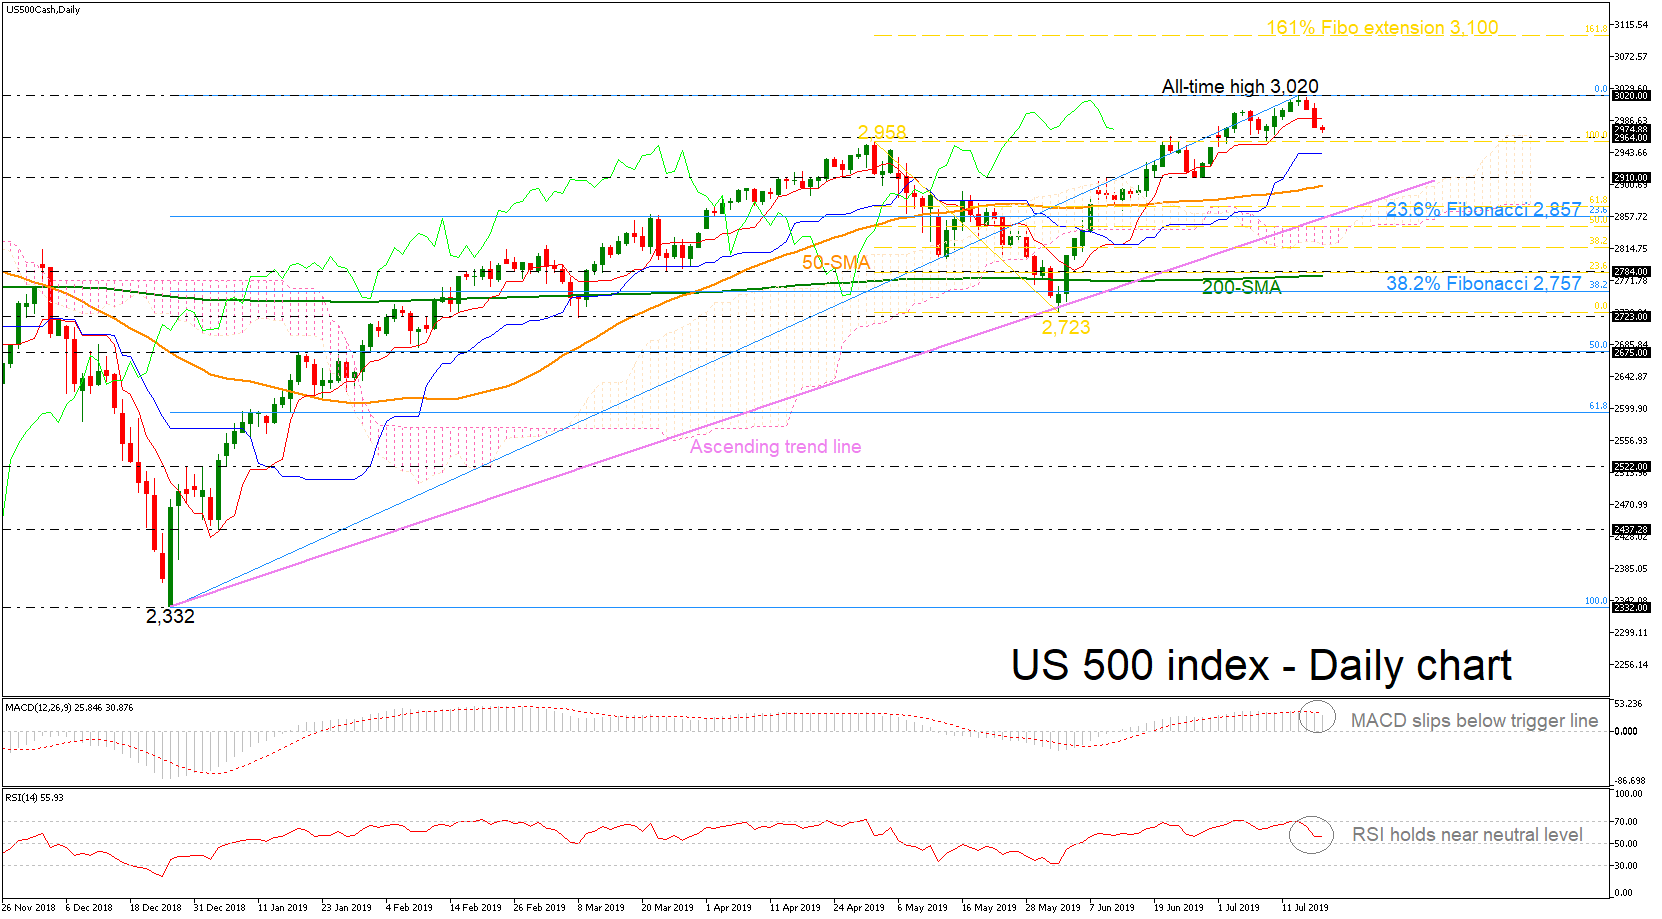
The US 500 stock index has pulled back somewhat after touching an all-time high of 3,020 in the prior week, reversing back below the red Tenkan-sen line. Momentum indicators now suggest that the market sentiment might get worse before getting better as the RSI is approaching the neutral area again and the MACD dived below its trigger line in the daily timeframe.
Should bearish dynamics dominate in the very short-term, the market might revisit the 2,964 support and move even lower towards the 2,910 area. Marginally below this zone the 40-day simple moving average (SMA) currently at 2,900 could come in focus. A test of the long-term rising trend line could be another strong support near the 23.6% Fibonacci retracement level of the upleg from 2,332 to 3,020 near 2,857.
Alternatively, if the price manages to rebound above the uptrend line, it could test the record high again (3,020). More aggressive advances could lead the index until the 161.8% Fibonacci extension level of the downfall from 2,958 to 2,723 at 3,100.
Summarizing, the US 500 index has been in a bullish rally since December 2018, however, any decline below the 23.6% Fibo could feed speculation that a downward pattern may be on the way, with confirmation awaited around the 38.2% Fibonacci of 2,745.
EU Barnier: Current Brexit agreement the only way to leave in an orderly manner
In a BBC interview, EU chief negotiator Michel Barnier insisted that the current, thrice defeated Withdrawal Agree is the "only way to leave the EU in an orderly manner". And, UK will "have to face the consequences" of no-deal Brexit if it's the chosen path. Additionally, he said EU has "never been impressed" by a no-deal Brexit threat.
In another interview, European Commission First Vice President Frans Timmermans complained the UK ministers "haven't got a plan" in Brexit negotiations. "We thought they are so brilliant," he added. "that in some vault somewhere in Westminster there will be a Harry Potter-like book with all the tricks and all the things in it to do."
Conservative Party leadership contender Jeremy Hunt said the fact the EU "never believed that no deal was a credible threat" was "one of our mistakes in the last two years".
The Analytical Overview Of The Main Currency Pairs
The EUR/USD currency pair
Technical indicators of the currency pair:
Prev Open: 1.12099
Open: 1.12239
% chg. over the last day: +0.12
Day's range: 1.12238 – 1.12420
52 wk range: 1.1111 – 1.2009
Yesterday, the greenback weakened against a basket of world currencies. The EUR/USD quotes updated local highs. Demand for the US currency weakened after the release of weak data on the real estate market, as well as a decrease in the yield of US government bonds. The IMF statements put additional pressure. The regulator said that the US dollar was overvalued by 6-12%, based on short-term economic indicators. At the moment, the EUR/USD quotes are consolidating in the range of 1.12250-1.12450. We recommend opening positions from these marks.
The news feed on 2019.07.18:
The number of initial jobless claims in the US at 15:30 (GMT+3:00);
Philadelphia Fed Manufacturing Index at 15:30 (GMT+3:00).
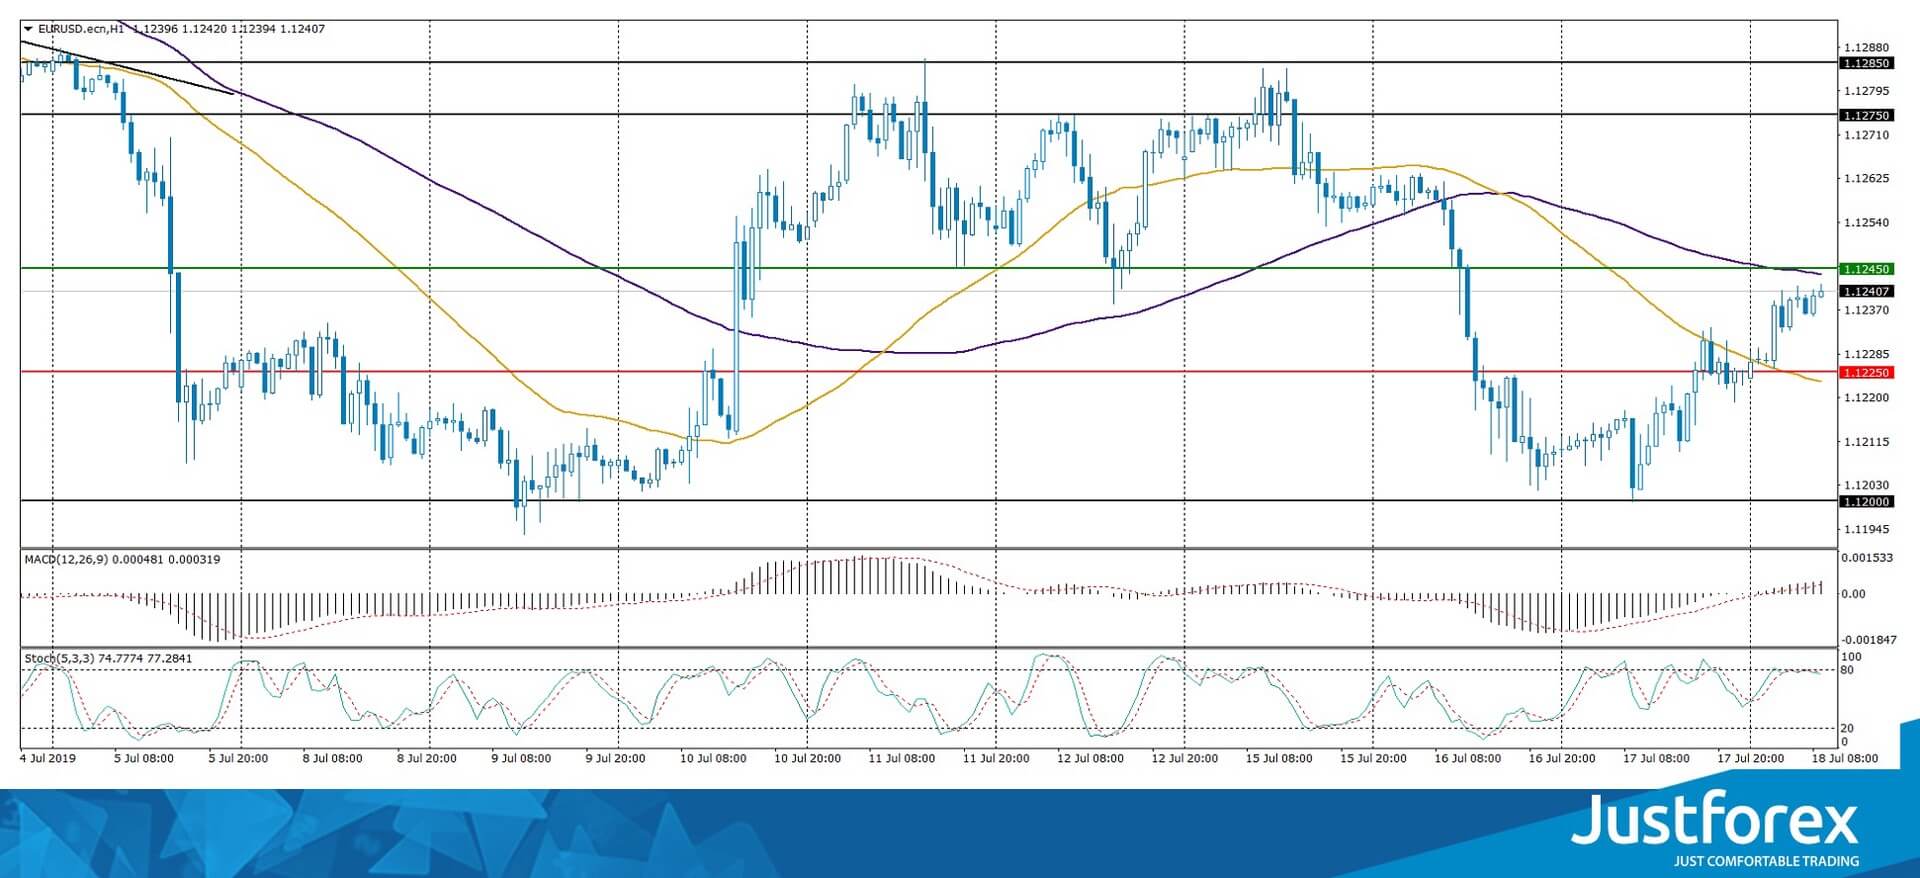
Indicators do not send accurate signals: the price has fixed between 50 MA and 100 MA.
The MACD histogram is in the positive zone and above the signal line, which gives a strong signal to buy EUR/USD.
Stochastic Oscillator is located near the overbought zone, the %K line has crossed the %D line. There are no signals at the moment.
Trading recommendations
Support levels: 1.12250, 1.12000, 1.11500
Resistance levels: 1.12450, 1.12750, 1.12850
If the price fixes below 1.12250, the EUR/USD currency pair is expected to decline. The movement is tending to 1.12000-1.11800.
An alternative could be a further recovery of the EUR/USD quotes to 1.12700-1.12850.
The GBP/USD currency pair
Technical indicators of the currency pair:
Prev Open: 1.24075
Open: 1.24313
% chg. over the last day: +0.20
Day's range: 1.24243 – 1.24478
52 wk range: 1.2397 – 1.3385
The GBP/USD currency pair has begun to recover after a prolonged fall. The trading instrument has updated local extremes. This movement was largely caused by technical factors. At the moment, the GBP/USD quotes are testing a local resistance of 1.24500. The mark of 1.24200 is already a "mirror" support. The pound has the potential for further correction. We recommend keeping track of current information on Brexit. Positions must be opened from key levels.
At 11:30 (GMT+3:00), the UK retail sales statistics for June will be published.
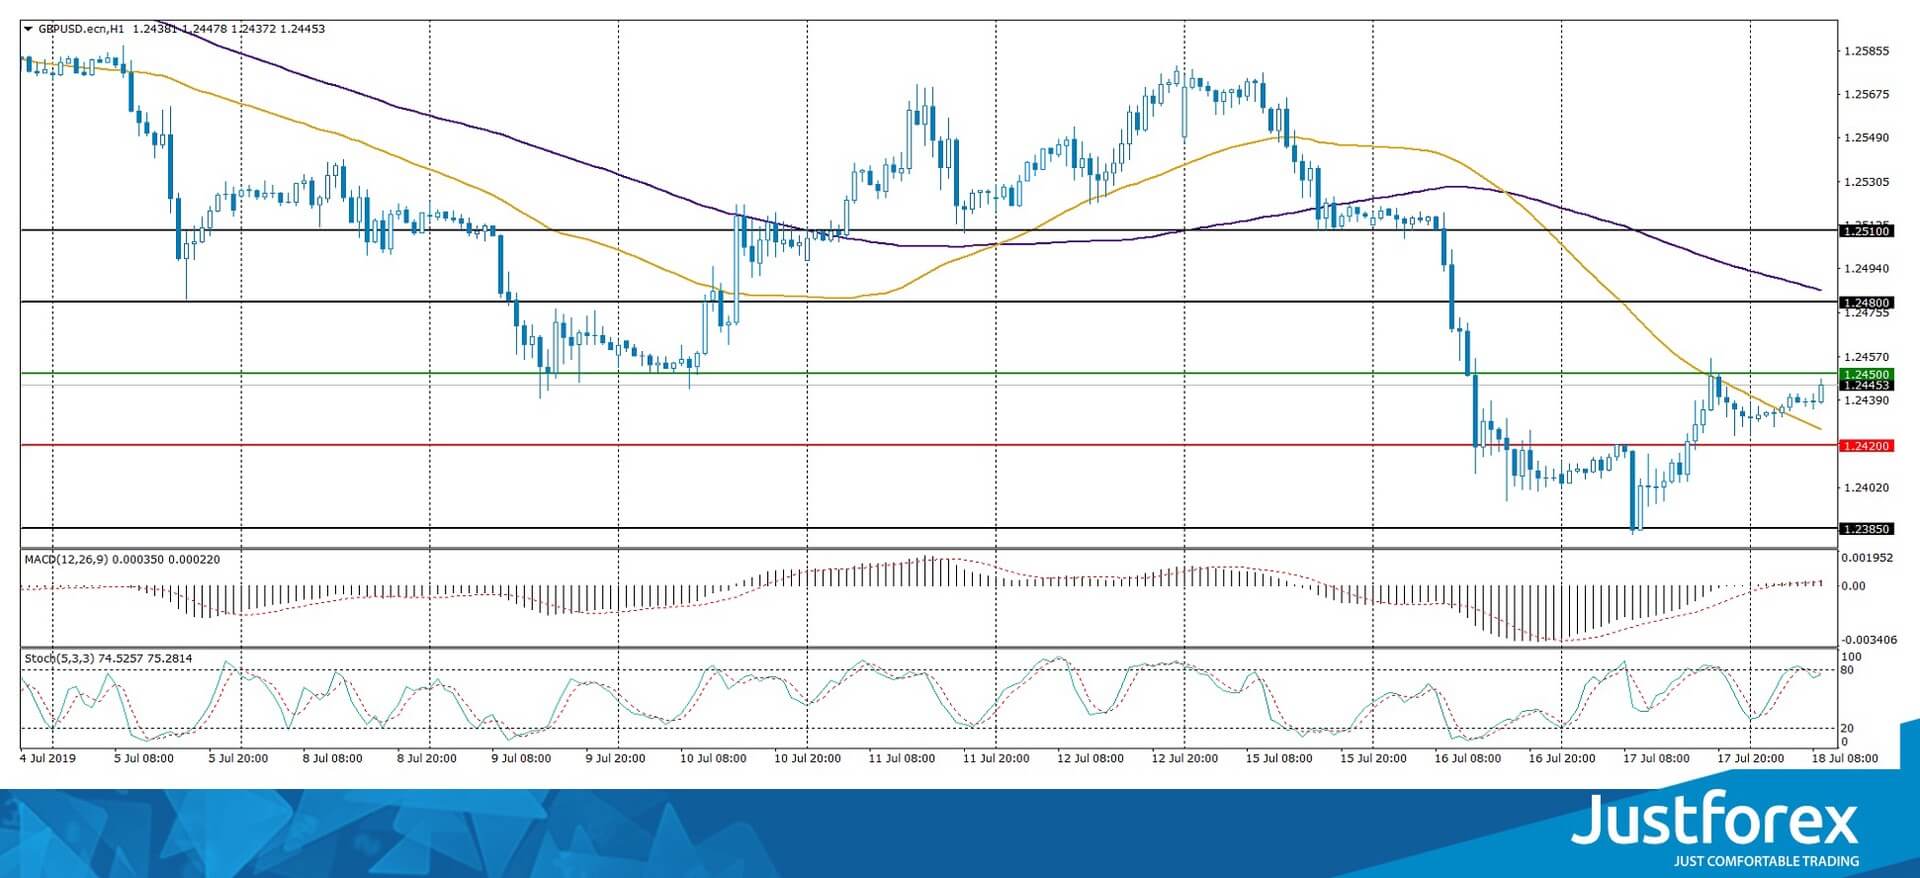
Indicators do not send accurate signals: the price has fixed between 50 MA and 100 MA.
The MACD histogram has started to rise, which signals a further correction of the GBP/USD quotes.
Stochastic Oscillator is located near the overbought zone, the %K line has crossed the %D line. There are no signals at the moment.
Trading recommendations
Support levels: 1.24200, 1.23850
Resistance levels: 1.24500, 1.24800, 1.25100
If the price fixes above the local resistance of 1.24500, a further correction of the GBP/USD quotes is expected. The movement is tending to the round level of 1.25000.
An alternative would be reduction of the GBP/USD currency pair to 1.24000-1.23800.
The USD/CAD currency pair
Technical indicators of the currency pair:
Prev Open: 1.30830
Open: 1.30520
% chg. over the last day: -0.25
Day's range: 1.30421 – 1.30556
52 wk range: 1.2727 – 1.3664
During the last trading sessions, the USD/CAD currency pair is quite active. At the same time, a unidirectional trend is not observed. At the moment, the loonie is consolidating. Investors expect additional drivers. Local levels of support and resistance are: 1.30350 and 1.30600, respectively. The trading instrument is tending to recover. We recommend paying attention to the dynamics of oil prices. Positions must be opened from key levels.
Today, the news feed on the Canadian economy is calm.
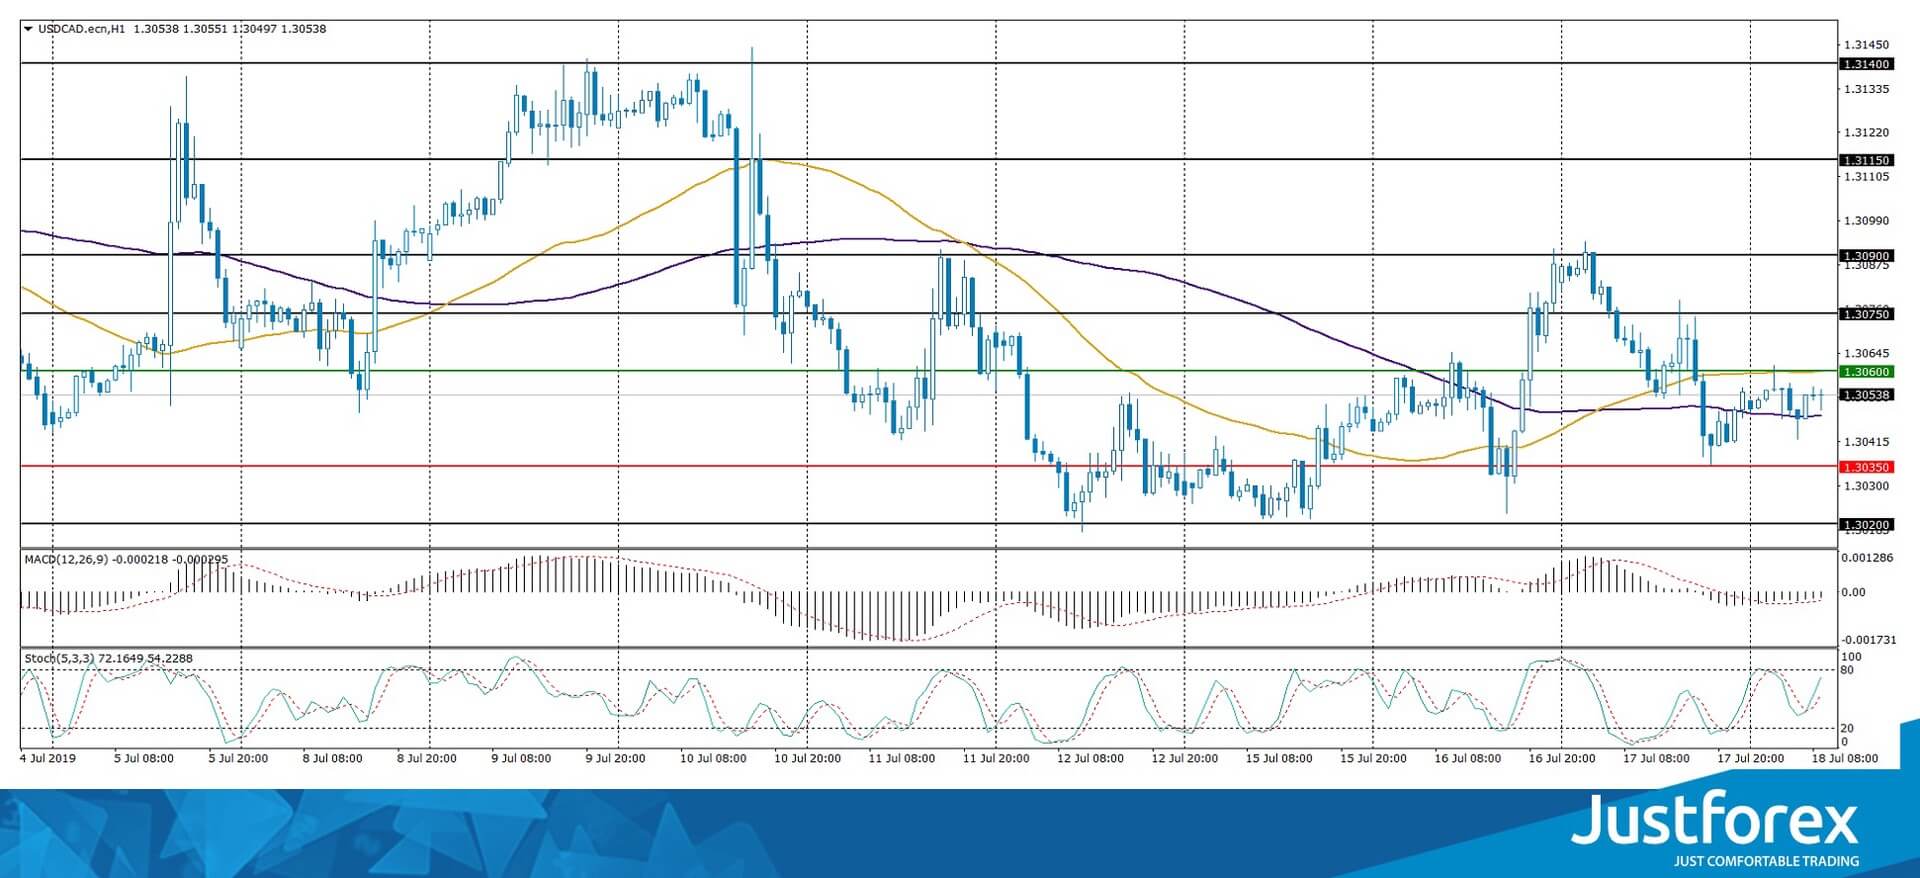
Indicators do not give accurate signals: the price has crossed 50 MA and 100 MA.
The MACD histogram is in the negative zone, but above the signal line, which gives a weak signal to sell USD/CAD.
Stochastic Oscillator is in the neutral zone, the %K line is above the %D line, which indicates the bullish sentiment.
Trading recommendations
Support levels: 1.30350, 1.30200, 1.30000
Resistance levels: 1.30600, 1.30750, 1.30900
If the price consolidates above 1.30600, a correction in the USD/CAD currency pair is expected. The movement is tending to 1.30800-1.31000.
An alternative could be a fall of the USD/CAD quotes to 1.30200-1.30000.
The USD/JPY currency pair
Technical indicators of the currency pair:
Prev Open: 108.226
Open: 107.942
% chg. over the last day: -0.28
Day's range: 107.618 – 107.980
52 wk range: 104.97 – 114.56
On the USD/JPY currency pair the bearish sentiment is prevailing. During yesterday's and today's trading sessions, the drop in quotes has exceeded 50 points. The trading instrument has updated key lows. A negative dynamics of the yield of US government bonds puts additional pressure on the "greenback". The demand for "safe" assets is still high due to the uncertainty in trade relations between the United States and China, as well as the situation around Brexit. At the moment, the USD/JPY quotes are consolidating in the range of 107.600-107.800. The trading instrument is tending to further decline. Positions must be opened from key levels.
In the Asian trading session, ambiguous data on the trade balance of Japan was published.
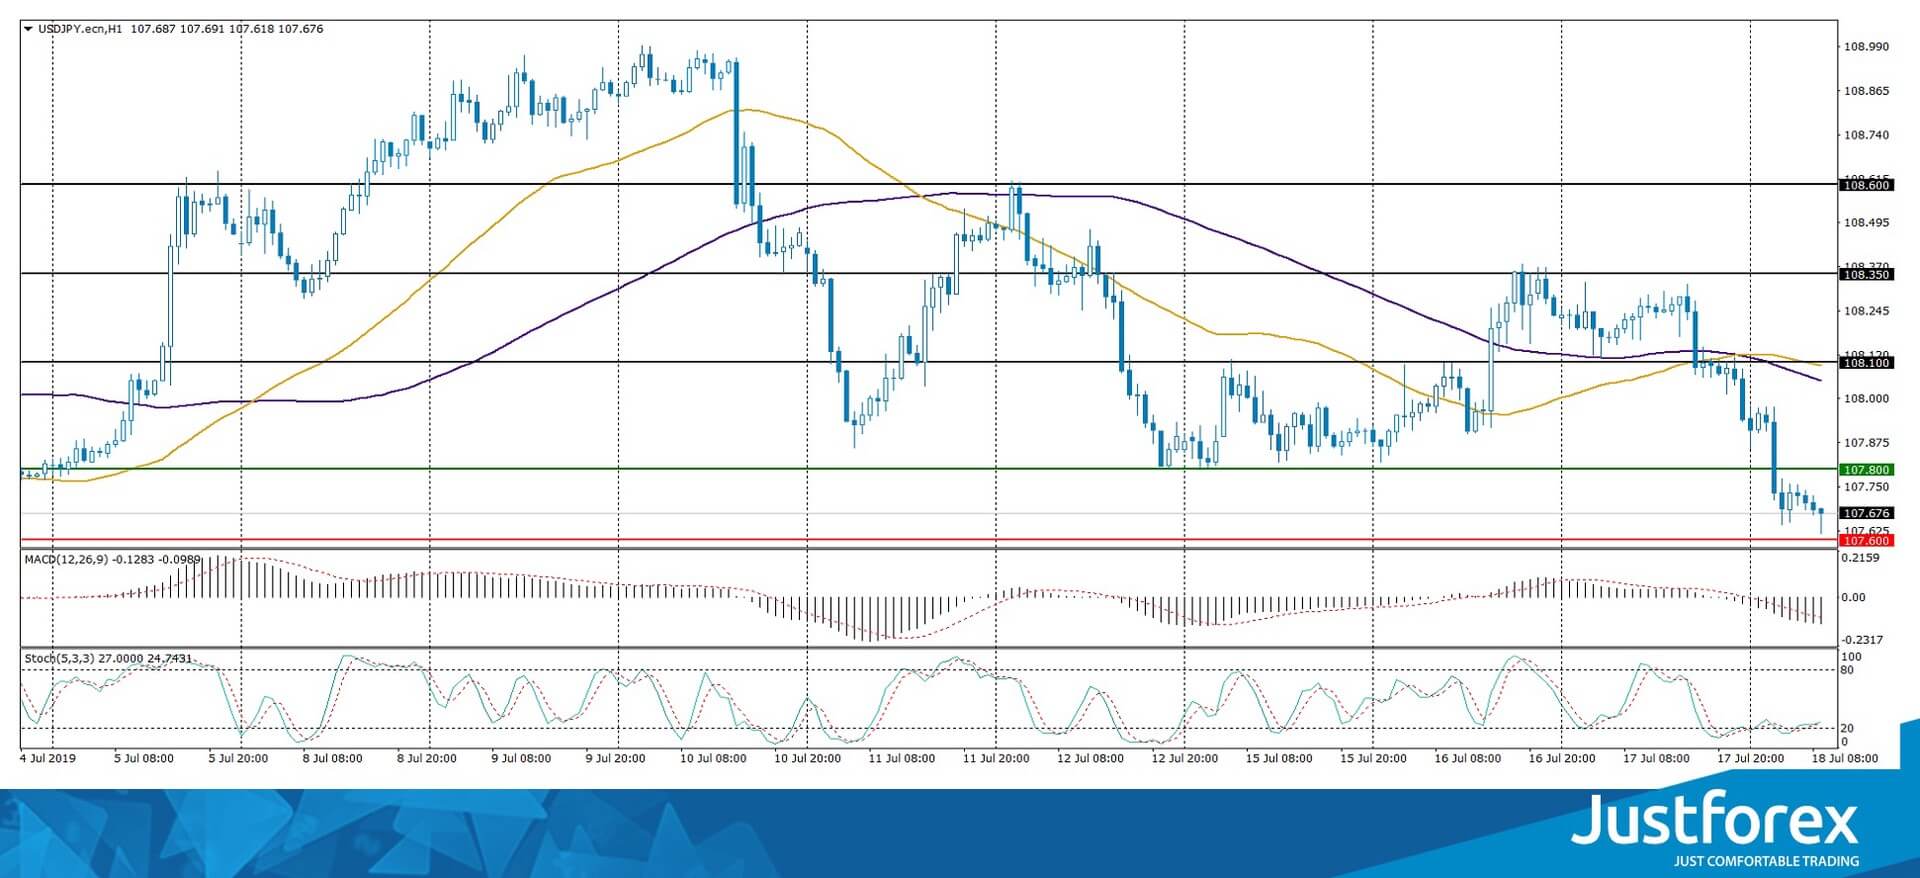
The price has fixed below 50 MA and 100 MA, which indicates the power of the sellers.
The MACD histogram is located in the negative zone and below the signal line, which gives a strong signal to sell USD/JPY.
Stochastic Oscillator is in the neutral zone, the %K line has crossed the %D line. There are no signals at the moment.
Trading recommendations
Support levels: 107.600, 107.300, 107.000
Resistance levels: 107.800, 108.100, 108.350
If the price fixes below 107.600, a further fall in the USD/JPY quotes is expected. The movement is tending to 107.300-107.000.
An alternative could be the growth of the USD/JPY currency pair to 108.000-108.200.
EUR/USD Outlook: Bounce Off 1.12 Extends But Risk Of Recovery Stall Exists
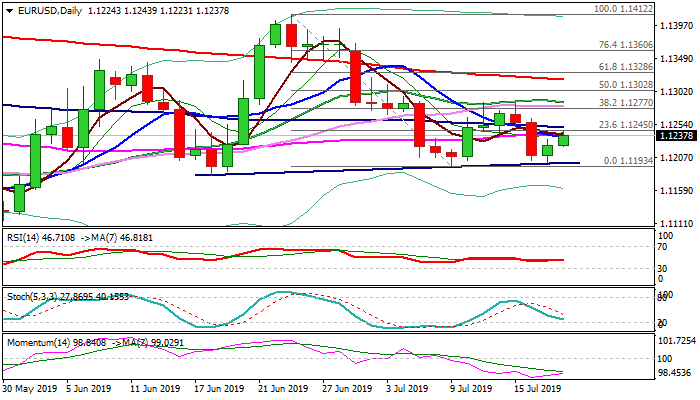
The Euro extends rebound from strong 1.12 support zone into second day and generated initial positive signals on probe through thin daily cloud and a cluster of converged daily MA's. Recovery needs more evidence for stronger upside signal, which could be generated on close above daily cloud and extension above 100DMA (1.1249) that would re-expose key barriers at 1.1277/85 zone (Fibo 38.2% of 1.1412/1.1193 / 11/15 July highs/converging 20/30DMA's) Strong bearish momentum is starting to fade and helps recovery, along with weaker dollar, but overall picture is still negative and keep in play risk of limited correction ahead of fresh attempts towards key 1.1200/1.1180 support zone.
Res: 1.1249, 1.1263, 1.1285, 1.1300
Sup: 1.1223, 1.1200, 1.1193, 1.1181
Gold Price Is Likely To Appreciate By Another 7.95%
Gold price has seen some remarkable recovery this year, it is up nearly 11.07% year to date. In other words, it is up approx. 13.65% from its low of $1,266 formed back in May. However, the price is still well below the all-time high of $1,921 formed back in September 2011. In our last article, we talked about the possibility of gold price touching the level of 1,550 and it seems that both fundamental and technical aspects are still supporting this bull case.
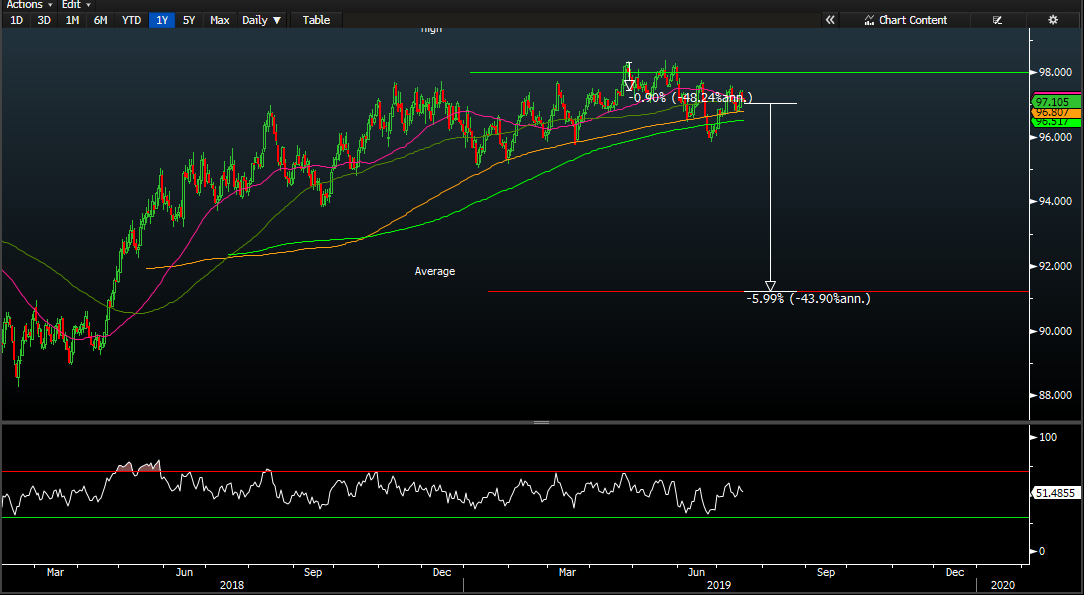
This is because fairly recently, the IMF has said that the US dollar is overvalued by 6 to 12% (6% drop in the dollar index price = 91.27 approx.) given the economic fundamentals. It was only a few weeks ago when the dollar index touched the low of 95.84, but ever since the price has been in an upward trend. The IMF’s comments have brought some weakness in the dollar index, it is trading lower by 0.18 percent or at 97.04 today. It is this weakness in the dollar index which is helping gold price to shine.
All eyes are on the upcoming Fed meeting (31st July). Majority of the Fed committee members agree that interest rate cut is required to support inflation. Although, San Francisco Fed president Marry Daily did say yesterday that she hasn't made her mind yet in relation to her next move on monetary policy. During the Fed’s last meeting in June, Jerome Powell, the Fed chairman, said he would act “as appropriate” to revive the economy. For Traders, this message was that the Fed is still data dependent. Looking at the two most important economic numbers: the US NFP and US Retail Sales, both numbers say that the economy isn't really in a dire condition.
This leads me to believe that there are 75% chances that the Fed may cut the interest rate by only 25 basis points during their upcoming meeting and another 25 basis points interest cut for the rest of this year. The chance for 50 basis points interest rate cut during this meeting is only 15% and 10% for no action. The 25 basis point interest rate cut is largely priced into the gold price. Having said this, this doesn't mean that the gold price isn't going to continue it's moved to the upside. Between now and the 31st of July, several different Fed members are scheduled to speak, and this means that speculators are going to use this opportunity to push the gold price higher.
Also, remember Donald Trump, the US president, is also pushing for the dovish monetary policy for a while and he has set things in motion by electing the people in the federal Reserve who will help to shape that. So, I think the long term trend for the gold is skewed to the upside and any short term retracements in the price could provide an opportunity to join the trend.
For traders who like technical analysis, it appears that a bull flag pattern has formed as shown in the chart below, and given that the price is trading above all the important moving averages (50,100,200), it is highly likely that the price may continue its move to the upside. Interestingly, the projection of this pattern throws the price near the 1,550 mark which is only 7.95% appreciation in the gold price.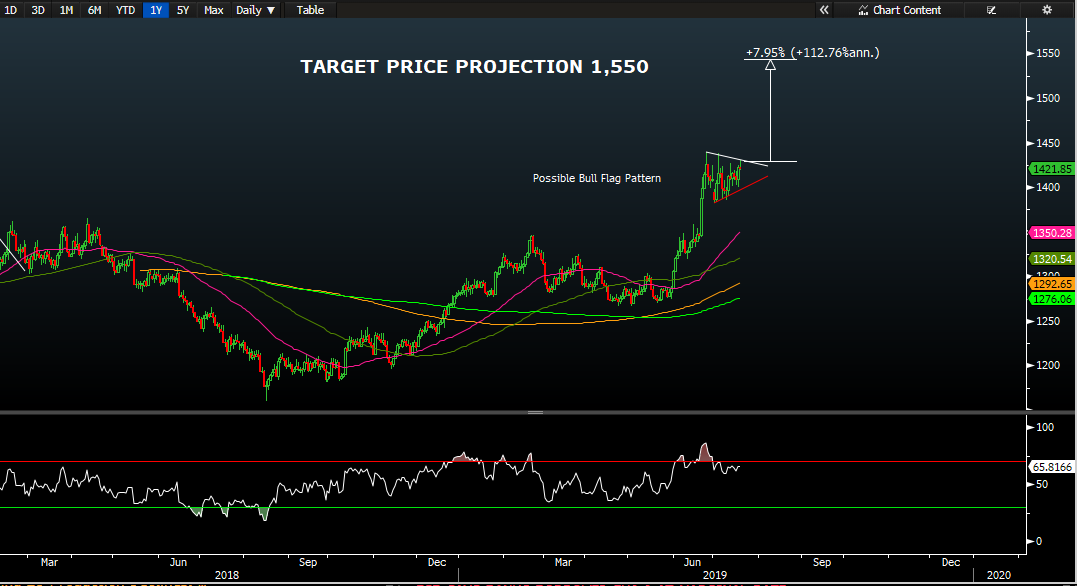
UK retail sales rose 1% in June, way over expectations
UK retail sales in June came in much better than expected. Sales including auto and fuel rose 1.0% mom, 3.8% yoy, versus expectation of -0.3% mom, 2.6% yoy. Sales excluding auto and fuel rose 0.9% mom, 3.6% yoy, versus expectation of -0.2% mom, 2.6% yoy.
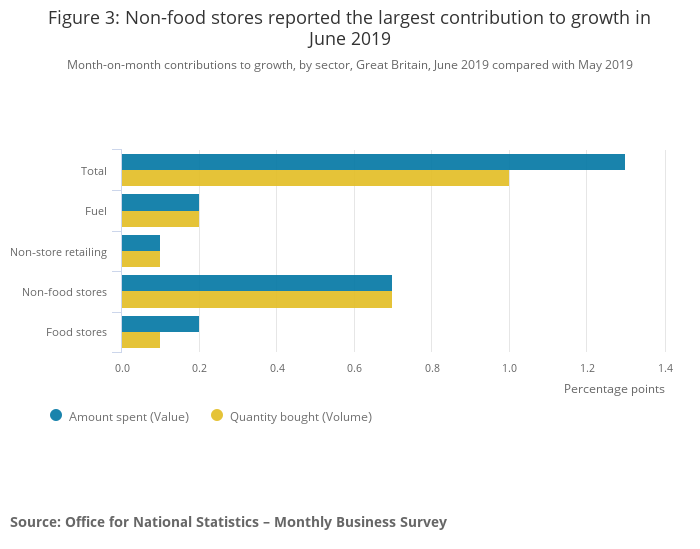
Over the month, all four main sectors contributed positively the growth, including fuel, non-store retailing, non-food stores and food stores. Non-food stores provided the largest contribution to the month-on-month growth, with both the amount spent and quantity bought at 0.7 percentage points.
Investors Are Buying Up Defensive Assets
A cautious attitude is returning to investors. President Trump put pressure on stock markets, recalling the readiness to impose tariffs on Chinese goods worth up to 325 billion, which returned to market fears over the consequences of trade conflicts. In the Beige Book published on Wednesday evening, the Fed noted relatively positive growth forecasts, but also indicated that companies still find it difficult to pass on increased costs to consumers. This, in turn, suppresses the inflation.
Stocks
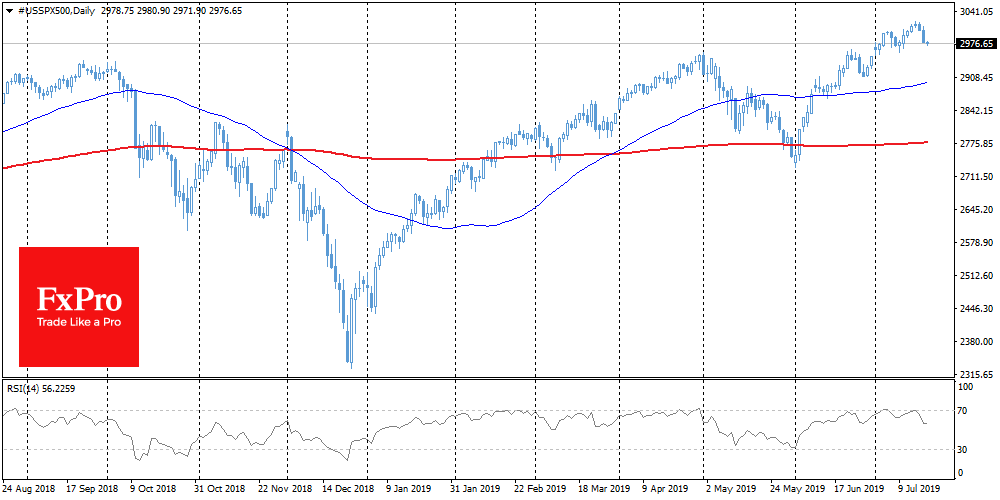
US indices lost 0.5-0.7% on Wednesday. Index futures continue to lose 0.2% this morning, falling for the third day in a row. SPX retreated below 3000. In addition, RSI has returned from the overbought area, which may further increase short-term pressure. Market anxiety is fuelled by the weak reporting of CSX Corp, whose failures are viewed by investors as a signal of the global economy cooling and reinforcing the investor's desire of buying up defensive assets.
EURUSD
The International Monetary Fund (IMF) noted that the dollar is overvalued by 6%-12%, based on short-term fundamentals. The IMF rarely comments on courses, and therefore, there are growing fears that the Trump administration will seize upon this thought, increasing pressure on the FOMC before the meeting on interest rates in two weeks. At the same time, the growth of the single currency is limited by the expectations of softening ECB policy next week. Central banks continue to play the senseless game of "make it softer than your neighbour."
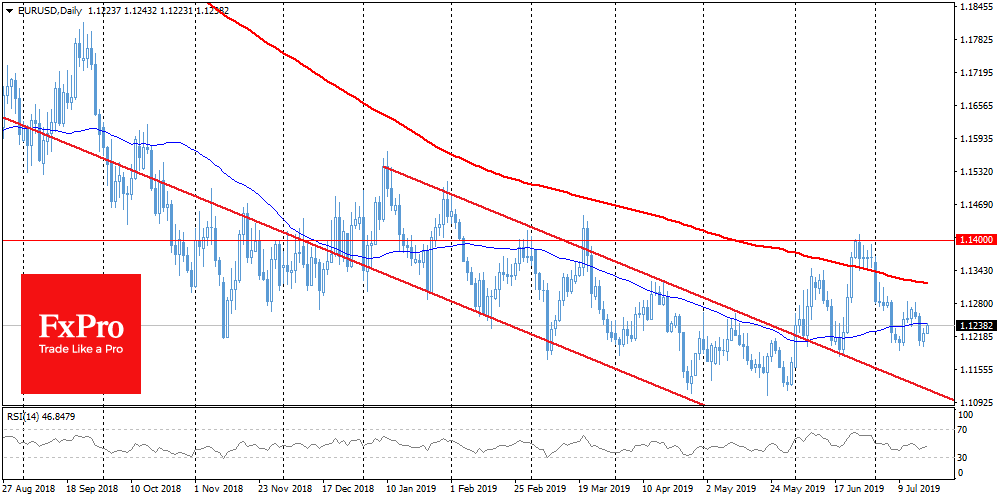
Chart of the day
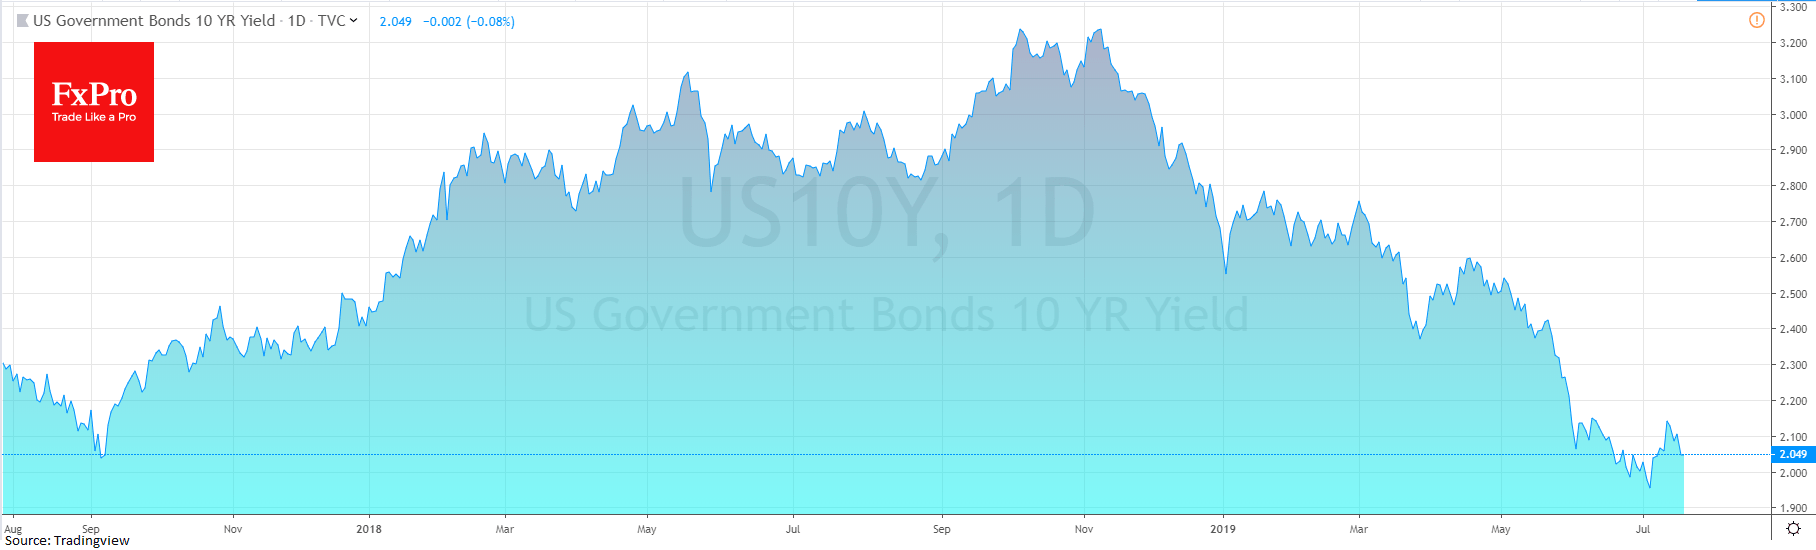
US 10-year Treasury yields have returned to the 2% level, reflecting growing concerns about the American economy growth rate. Reporting season has just begun, however, while the companies' results are weaker than expected. A further drop in the yield of long-term US government bonds could be an alarming signal for the markets, further increasing pressure on stocks, and also causing a weaker dollar as investors look for more yielding assets.
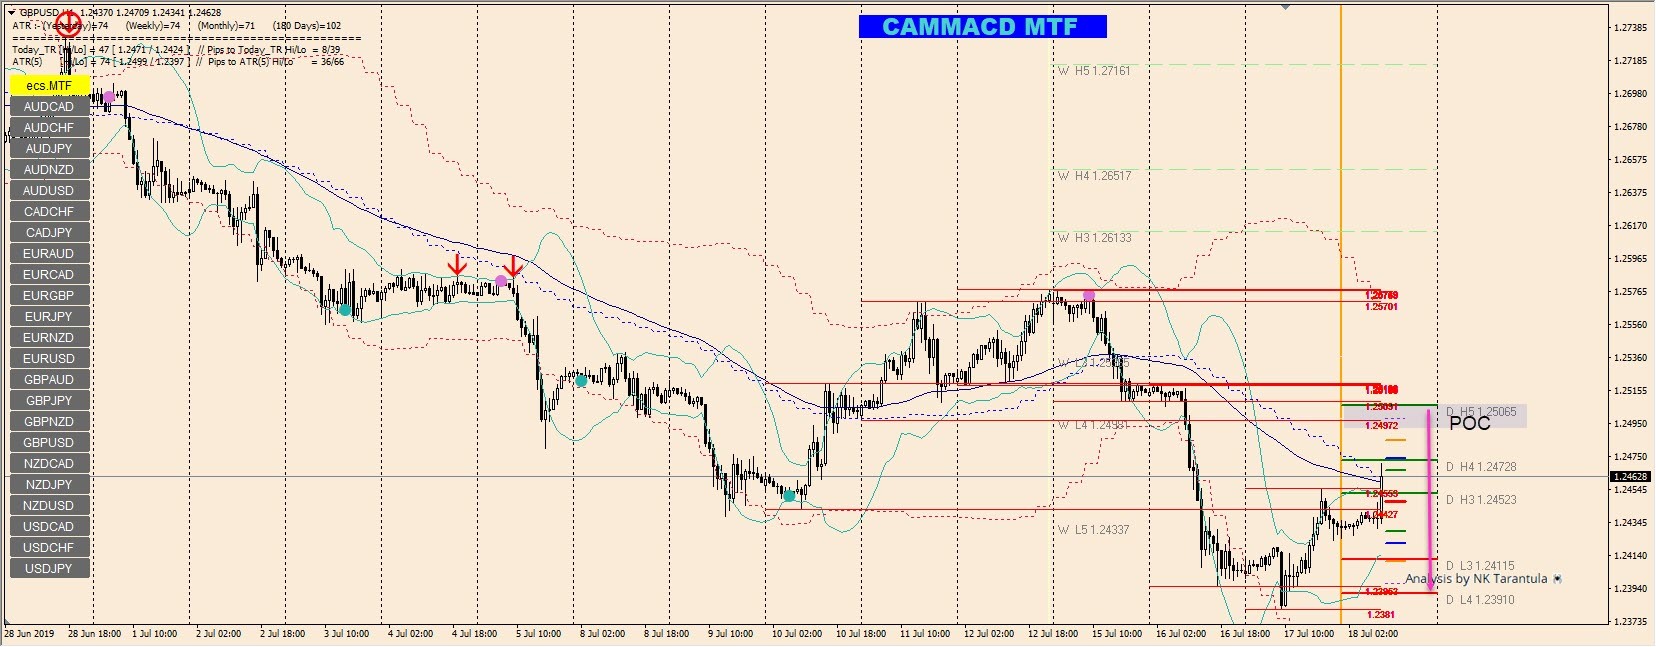
GBP/USD Red Level & Camarilla Confluence Should Provide Fresh Selling Opportunities
The GBP/USD is under a retracement. I am watching 1.2495-1.2505 area for fresh selling opportunities.
A reversal candlestick pattern within the POC zone should provide selling opportunities. We can clearly see the confluence between Red Levels ™ and camarilla pivots. Additionally, we can also spot the ATR high. The confluence within the POC is strong and a rejection should happen. Targets are 1.2472, 1.2452 and 1.2390. However, as always, it is advised that traders move their stops in profit, close to important S/R levels due to intraday volatility and possible Brexit news.
Earnings And Trade Concerns Pull Equities From Record Highs
Investors have sold equities across the globe and headed back towards the safety of government bonds and Gold. After spending several weeks pricing in the impact of expected monetary easing by major central banks, bullish investors took a pause as fundamentals began to show signs of cracks.
Disappointing earnings and an outlook cut from US railroad operator CSX sent the stock price 10% lower on Wednesday. Transportation companies are fast to pick slowdowns in an economy and if we see this trend of disappointing earnings spread into other logistics providers, then it will send a clear warning to investors. President Trump's tweets didn't help either as he said the US still has a long way to go on trade talks before an agreement can be reached. The longer the negotiations take, the more damage will be done to the global economy, and monetary policies on their own may only do very little to offset that damage.
The Federal Reserve's Beige Book didn't reflect much of this pessimistic outlook as the report showed US businesses see economic activity expanding modestly despite widespread concerns about the possible negative impact of trade-related uncertainty. However, the positive outlook will not prevent the Fed from cutting interest rates by 25 basis points by the end of this month as a precautionary move.
Gold was a major beneficiary from yesterday's drop in equity prices and bond yields. The precious metal made another attempt to retest the resistance level near $1430. Also helping Gold was an article from billionaire hedge fund manager Ray Dalia picking the asset as a top investment for this year due to a paradigm shift in investing. While many investors don't like Gold as an asset class given that it doesn't provide any yield, at one point it may be a necessary portfolio diversifier especially when bonds of developed economies no longer provide a reasonable return. Investors should keep an eye on $1439 as a break above would likely bring sideline investors to join the bull run.
In the currency markets, the Dollar fell from a one week high as 10-year Treasury Yields slipped back towards 2.04% from a weekly high of 2.15%. Meanwhile, the Australian Dollar advanced the most in the G10 currencies basket, after the jobs report showed full-time employment surged by 21,000. While the unemployment rate is still 0.7% above RBA's target of 4.5%, the underemployment which fell 0.4% from 8.6% has eased pressure on an imminent rate cut.
While Sterling recovered slightly from its 27 months low against the Greenback, it seems we're still heading towards more turbulence in the weeks ahead as implied volatility in GBPUSD hit highest levels since April. The Pound is no longer responding to economic data, and only politics are moving the currency. According to fundamentals, GBPUSD is way below its fair value; however there's still more to the downside if a no-Brexit deal becomes the more likely scenario. If expectations of a hard Brexit increase significantly over the next couple of weeks, we may easily see GBPUSD trading below 1.20. Keep a close eye on UKpolitics as it's going to be your primary guide to Pound movements.
AUD/USD Outlook: Aussie Attacks Again Key Barriers After Positive Jobs Data
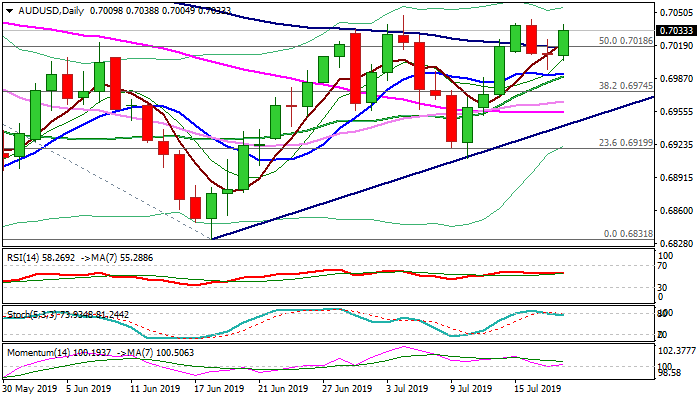
The Australian dollar moved higher in Asia on Thursday, boosted by Australian jobs data and probed again above strong barriers at 0.7035/36 (daily cloud top/weekly cloud base).
Full-time employment data showed strong rise in June (21.1K vs 2.4K in May) but were overshadowed by unemployment that stays stuck at 5.2% and only 500 new jobs added in June, compared to 42.3K figure in May and 9.1K forecast.
The Reserve Bank of Australia is closely monitoring developments in the labor sector, with expectations for earnings and inflation to pick up, but fall in unemployment is needed to accelerate the process, as the central bank looks for jobless rate to drop to 4.5%.
Fresh advance emerged after two-day pullback from 0.7044 high was contained by psychological 0.70 support and Wednesday's action ended in long-legged Doji, suggesting that bears ran out of steam.
Momentum and RSI are turning up on daily chart, helped by daily MA's in bullish configuration and setting scene for eventual break through key barriers at 0.7035/36 and 0.7044/47 that would open way for test of pivotal Fibo barrier at 0.7062 (61.8% of 0.7205/0.6831) and 200DMA (0.7090) in extension).
Broken 100DMA now offers immediate support at 0.7017, guarding lower pivots at 0.7000/0.6990 (round-figure/converged 10/20DMA's), loss of which would generate bearish signal.
Res: 0.7044, 0.7047, 0.7062, 0.7090
Sup: 0.7017, 0.7000, 0.6990, 0.6970