Sample Category Title
NZDCHF’s 100-SMA And 50.0% Fibonacci Become A Double Opponent Obstacle
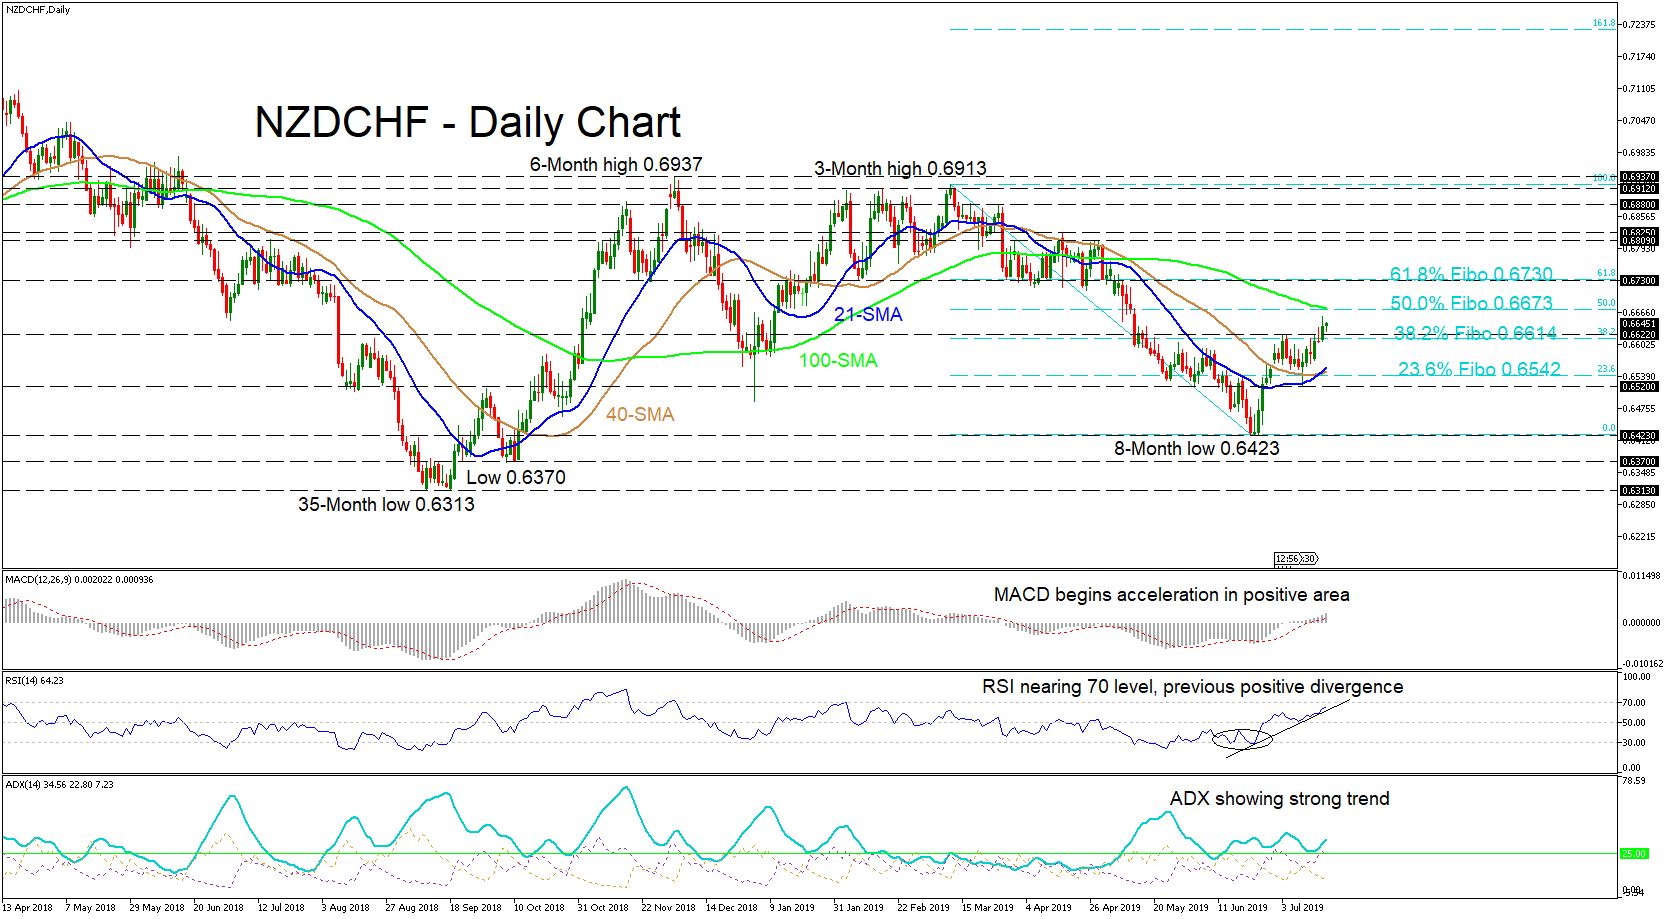
NZDCHF saw some positive divergence in the last several weeks on the RSI which helped it to bounce back from a three-month high tumble from 0.6913 to an eight-month low of 0.6423. Since yesterday the price is trading above the 38.2% Fibonacci retracement level of the down-leg from 0.6913 to 0.6423, of 0.6614 and is heading towards the 50.0% Fibo coupled with the 100-day simple moving average (SMA) at 0.6673.
The short-term SMAs of 21- and 40-days have crossed bullishly suggesting the continuation up. The MACD has started its acceleration in positive areas, while the RSI concurs near the overbought area. The ADX also coincides showing a strong trend.
For the upside, price would need to initially push through the double barrier of the 100-SMA and 50.0% Fibo level near 0.6673. The next test would be the 61.8% Fibo coupled again with a resistance of 0.6730. If this scenario unfolds, the ceiling around 0.6810 – 0.6825 would come into play.
For moves back down, immediate support would be 0.6622, then the 38.2% Fibo of 0.6614, before a lower test of the 21- and 40-SMAs could be tackled around the 23.6% Fibo of 0.6542 and near the support of 0.6520. A definitive shift to the downside would need an eight-month low of 0.6423 to be surpassed before further historical lows unfold.
Briefly, the short-term suggest bullish bias, whereas awareness to a medium-term bearish outlook is necessary.
Pullback In Dollar Lifts All Boats, Risk Aversion Creeps Back
- Dollar retreats as trade concerns fuel Fed rate cut bets
- Stocks drop, safe havens gain amid risk aversion
- Aussie climbs after employment data
- UK retail sales due as pound recovers some losses
Dollar grinds lower as July rate cut bets mount
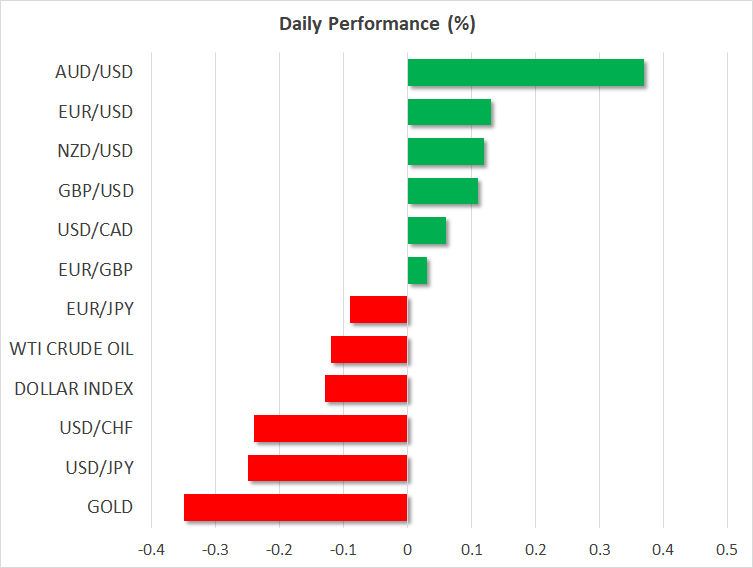
The world’s reserve currency retreated almost across the board on Wednesday and continues to surrender ground today, falling in tandem with longer-term US interest rates as worrisome trade signals prompted traders to boost bets for aggressive Fed rate cuts. Specifically, recent reports suggest the US-China talks are stuck in limbo, with no real progress being made amid internal US disagreements over how to treat Huawei.
Coming on the heels of comments from Trump that he may impose more tariffs, and combined with the fact that the two negotiating teams haven’t even met in person since the ceasefire, markets interpreted this as raising the odds for a breakdown in the talks. Consequently, the odds for the Fed to deliver a ‘double’ rate cut of 50 basis points (bps) in two weeks’ time jumped to ~33%, from ~25% earlier.
While the dollar’s drop was relatively modest in magnitude, the move underscores that the US currency is no longer acting as a safe haven on trade issues, given the implications for Fed policy. Even though the Fed is certain to cut rates by 25bps in July, a 50bps move still seems excessive with the domestic economy remaining solid and the central bank having limited firepower. As such, the dollar may have some more scope to recover in the near term, even despite the bigger picture pointing to long-term weakness.
Stocks reel, gold and yen shine as risk aversion returns
The darkening trade outlook also took its toll on equity markets, with the major US stock indices closing in the red yesterday, and futures pointing to a lower open today. On the opposite side of the ‘risk spectrum’, both the yen and gold soared, the latter also benefiting from a weaker dollar. Separately, some disappointing export data from Japan overnight may have fed the narrative that the global economy is slowing, contributing to the risk aversion.
Aussie and kiwi climb despite fragile risk sentiment
Defying the risk-off mood, both the aussie and the kiwi are trading higher today, partly due to the softer greenback but also due to some decent employment data from Australia overnight. While the overall jobs report was slightly weaker than expected, the fact that the unemployment rate held steady dampened expectations for an August rate cut by the RBA, pushing the aussie up.
UK retail sales eyed as Brexit-battered pound catches its breath
Sterling is on the mend for a second session, following the selloff earlier in the week. Some remarks by EU chief negotiator Barnier today that he is willing to work on “alternative arrangements” for the Irish border helped the rebound, though Cable remains capped below the 1.2470 mark, which was the December low.
UK retail sales are on tap today, though as usual, politics will probably overshadow economics.
While Barnier’s signals are certainly encouraging, they aren’t enough to change even the short-term outlook for sterling. There are no easy solutions to the Irish backstop, as years of back-and-forth negotiations have revealed, and more importantly Boris Johnson recently said that the backstop is “dead” even if a time limit is attached to it. The bottom line is that any recovery in the pound may remain short-lived, unless something substantial changes in Brexit, like a General Election being thrown into the mix.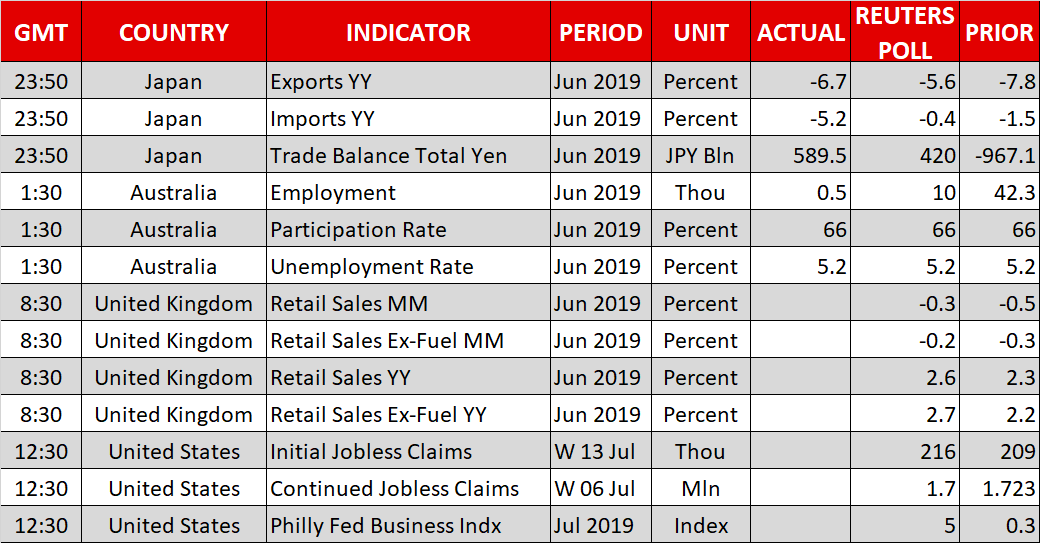
USDJPY Tests Key Support, Stochastics Oversold
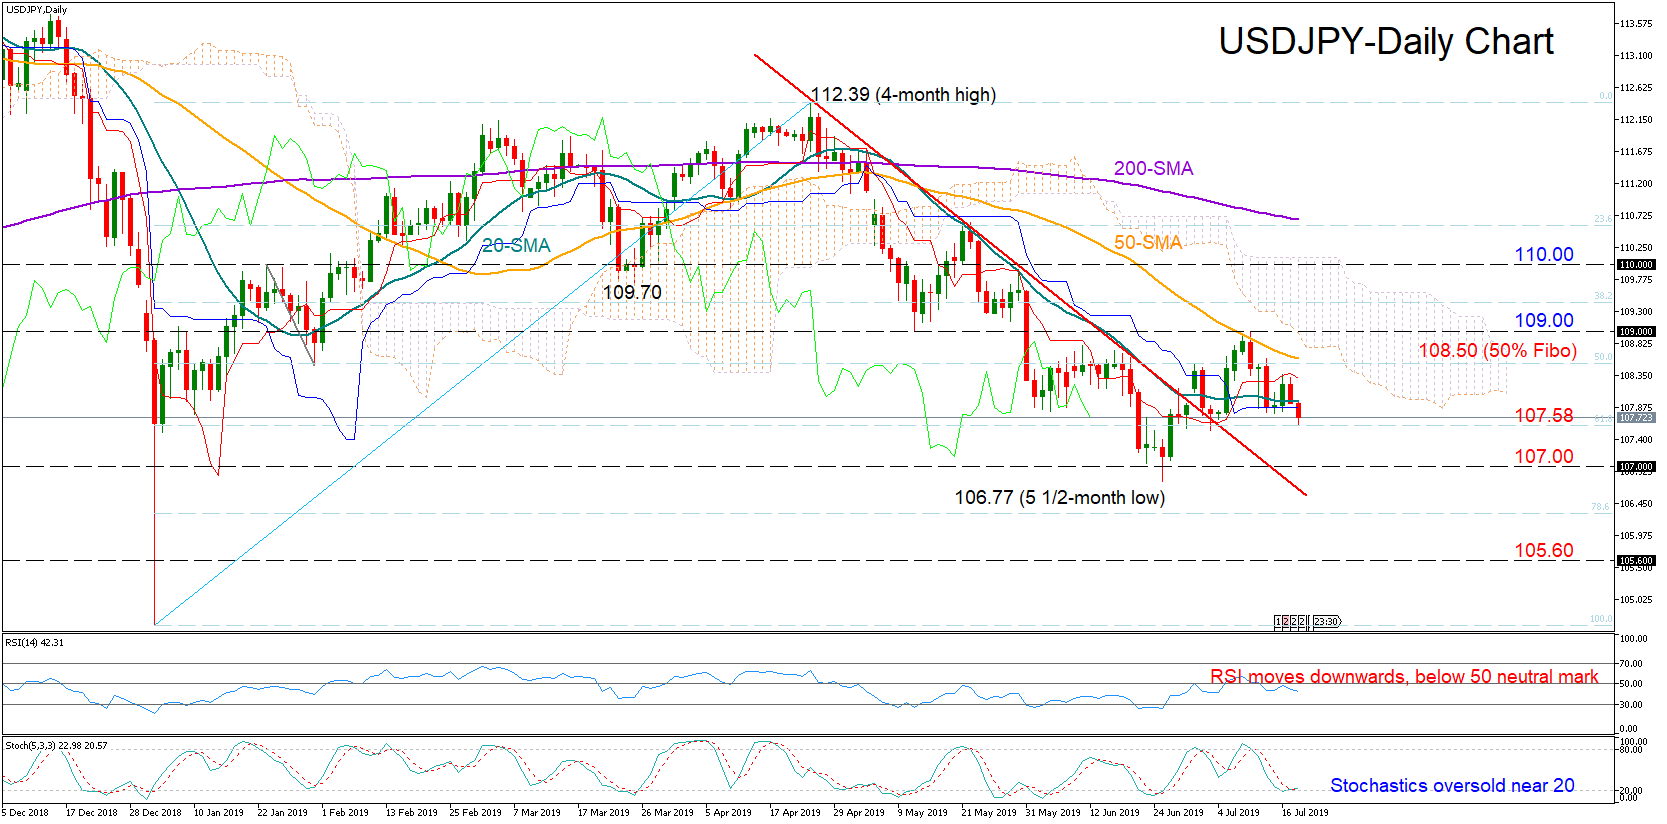
USDJPY attempted to cross above the 50-day simple moving average (SMA) and reach the 109 level last week but efforts proved fruitless, with the price resuming negative momentum towards the key 61.8% Fibonacci retracement level of the upleg from 104.64 to 112.39.
The downward-sloping RSI suggests a weaker short-term trading. Yet, with the Stochastics flashing oversold conditions in the market, upside corrections cannot be ruled out.
Should the 61.8% Fibonacci of 107.58 fail to halt downside pressure, the bears could next rest near the 107 psychological level before a more challenging battle starts around 106.77, the 5 ½-month low marked in June. Falling under the 106 mark, the focus would turn to the 105.60 mark, taken from the lows registered in the February-April 2018 period.
In the positive scenario, a rebound in the price would bring the 50% Fibonacci of 108.50 back into view. Traders, however, may wait for a decisive close above the 109 number to further lift buying orders, probably until the 110 level. Such a move would also make the breakout above the descending line more reliable.
Meanwhile in the medium-term window, the lower highs and the lower lows from the 112.39 peak continue to hold the sentiment bearish, with the declining 50-day SMA reducing hopes for an outlook reversal.
In brief, the short- and the medium-term risk for the USDJPY market is skewed to the downside.
NZDUSD Violates Double Bottom Pattern, Bulls Back Into Play
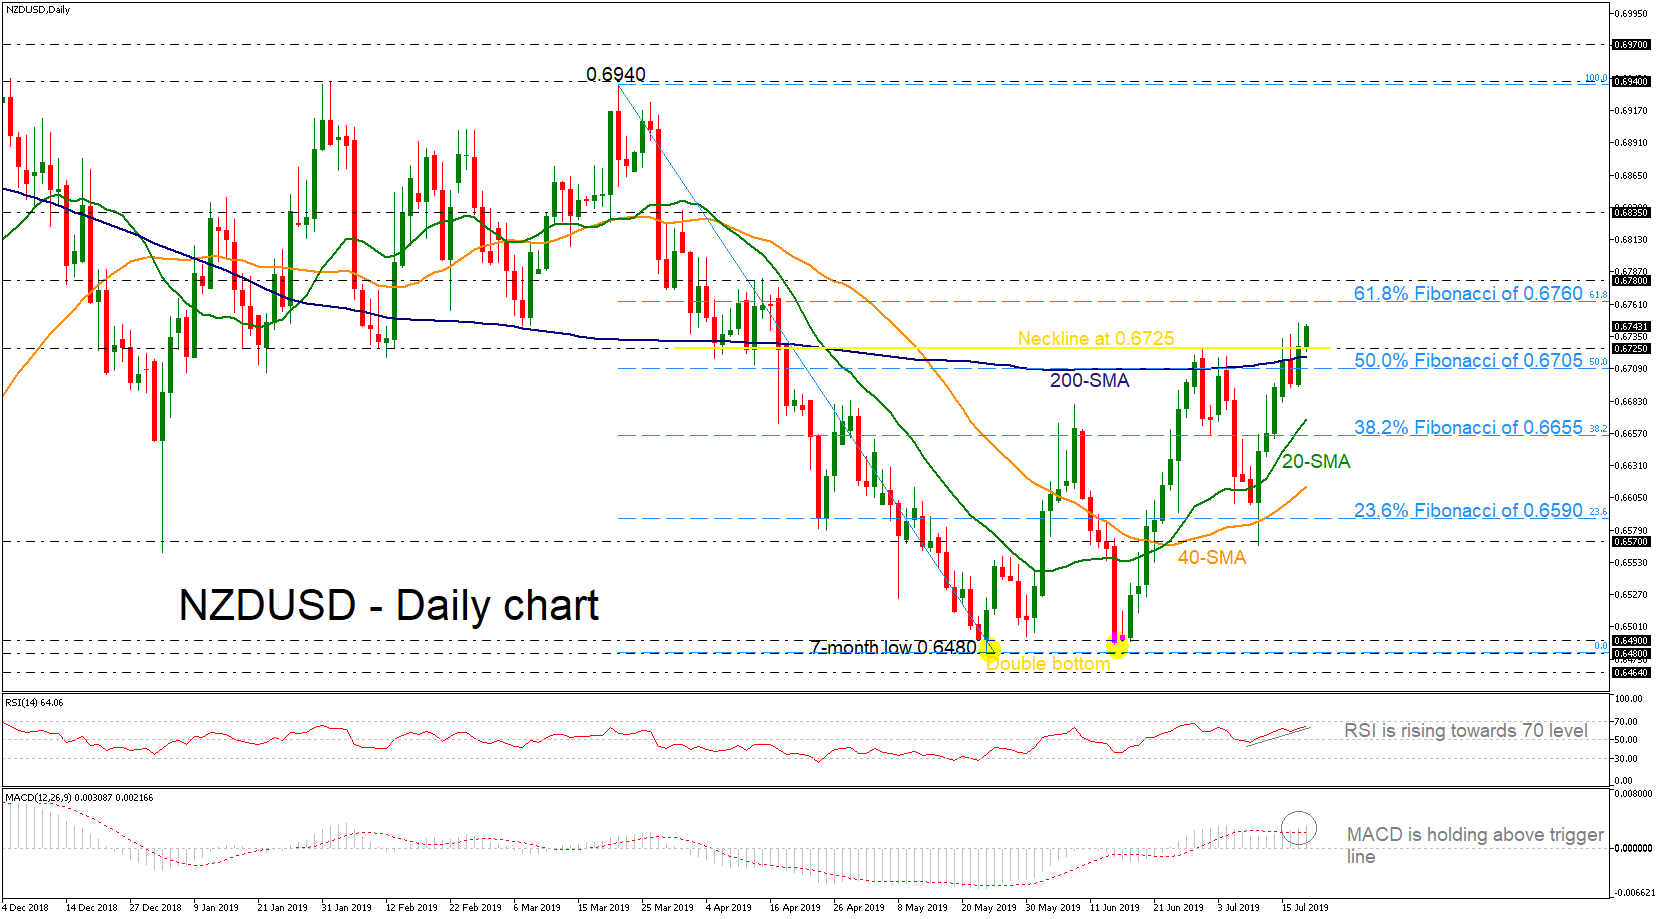
NZDUSD successfully surpassed the long-term 200-day simple moving average (SMA), gaining some ground and is holding near the three-month high of 0.6745 that it posted on Wednesday. The double bottom formation that was created around the 0.6480 – 0.6490 support levels with a neckline at the 0.6725 barrier, was completed with today’s break to the upside.
From the technical point of view, the Relative Strength Index (RSI) is rising in the positive territory, approaching the overbought zone, while the MACD oscillator is extending its bullish momentum above trigger and zero lines, confirming the recent bullish action on price.
Should the price edges higher, the 0.6760 resistance – which is the 61.8% Fibonacci retracement level of the downfall from 0.6940 to 0.6480 – could attract traders’ attention before touching the 0.6780 barrier. In case of an attempt above this hurdle, the short-term negative bias would switch to neutral, testing the 0.6835 resistance.
In the alternative scenario, a tumble back below 0.6725 and the 50.0% Fibonacci mark of 0.6705 could open the door for a rest near the 20-day SMA currently at 0.6670 and the 38.2% Fibonacci of 0.6655. More losses could be faced around the 40-SMA at 0.6615.
Overall, NZDUSD is in planning to change the outlook from negative to positive but first it needs to violate the 61.8% Fibo and 0.6780 levels.
GBP/JPY Daily Outlook
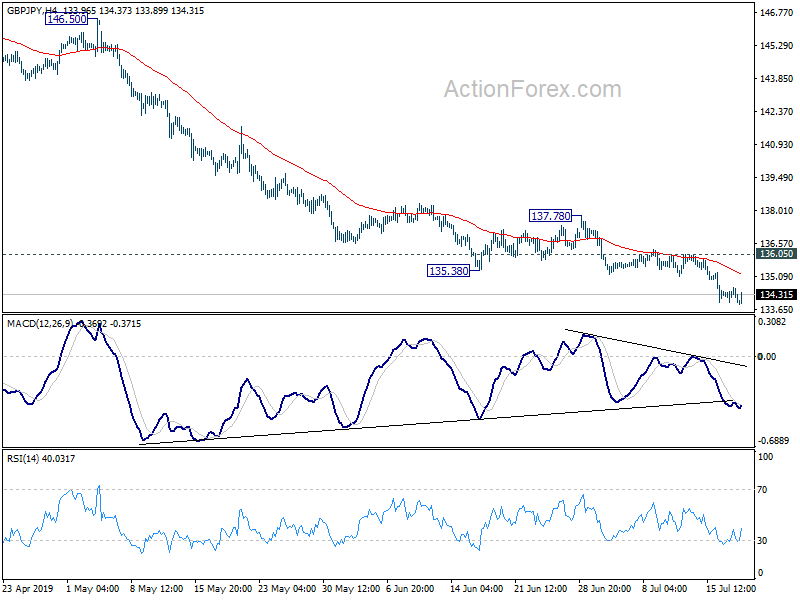
Daily Pivots: (S1) 133.90; (P) 134.27; (R1) 134.56; More...
Intraday bias in GBP/JPY stays on the downside at this point. Current decline from 148.87 should target 131.51 low next. On the upside, break of 136.50 resistance is needed to indicate short term bottoming. Otherwise, outlook will remain bearish in case of recovery.
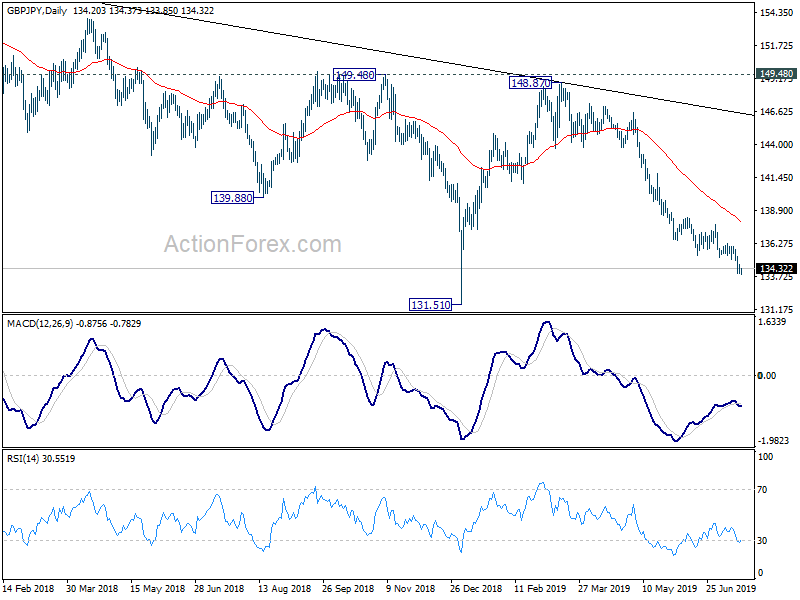
In the bigger picture, medium term fall from 156.59 (2018 high) is still in progress. Break of 131.51 will target 122.36 (2016 low). Structure of such decline is corrective looking so far, arguing that it's just the second leg of consolidation from 122.36. Thus, we'd expect strong support from 122.36 to contain downside to bring reversal.
EUR/JPY Daily Outlook
Daily Pivots: (S1) 121.05; (P) 121.28; (R1) 121.41; More....
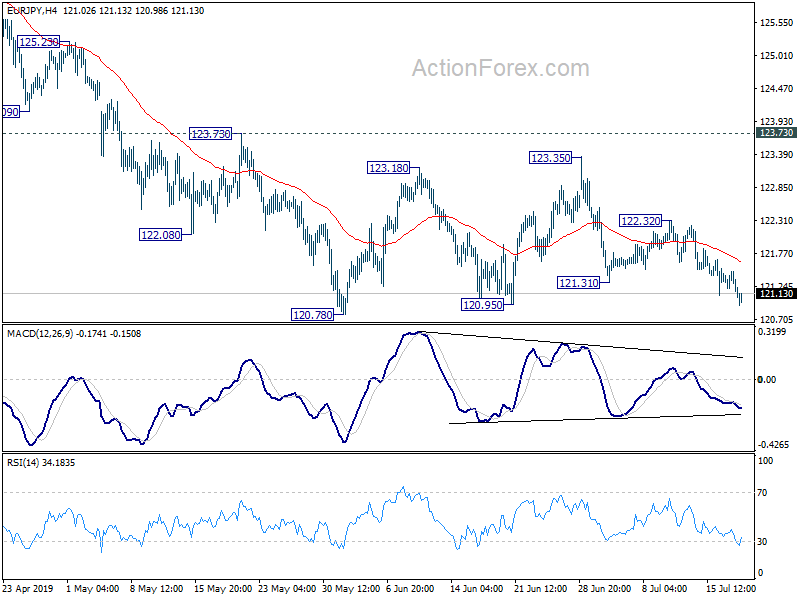
No change in EUR/JPY's outlook and intraday bias remains on the downside. Decisive break of 120.78 support resume fall from 127.50 to 118.62 low. In case of another rise as consolidation from 120.78 extends, upside should be limited by 123.73 resistance to bring fall resumption eventually.
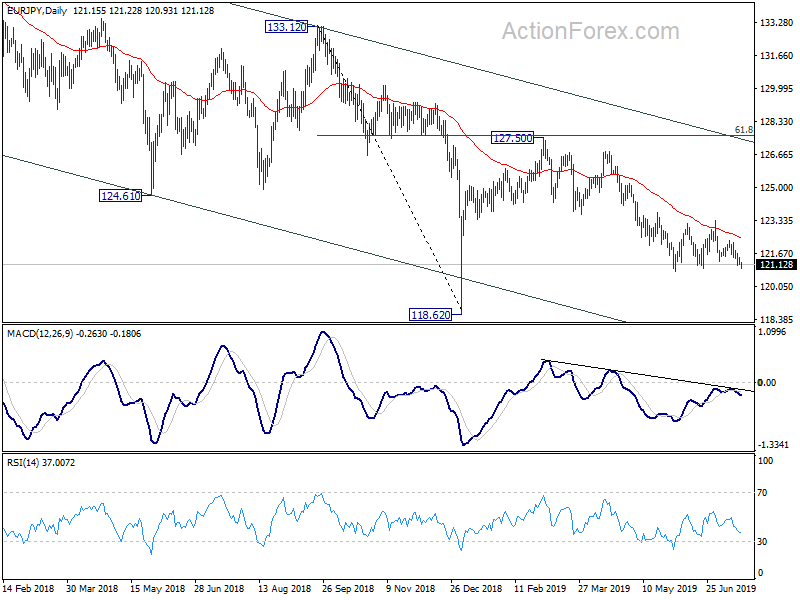
In the bigger picture, down trend from 137.49 is still in progress with the cross staying inside long term falling channel. Break of 118.62 will extend the fall to 109.48 (2016 low). On the upside, break of 127.50 resistance is needed to be the first sign of medium term reversal. Otherwise, outlook will remain bearish in case of strong rebound.
Forex Technical Analysis: EUR/USD, USD/JPY, GBP/USD
EUR/USD
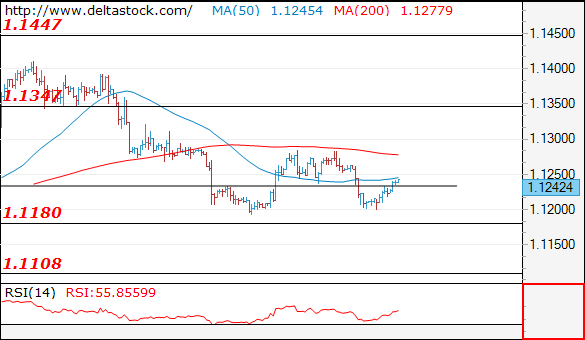
Current level - 1.1242
The return above 1.1180 signals a continuation of the corrective pattern and the intraday outlook is neutral.
| Resistance | Support | ||
| intraday | intraweek | intraday | intraweek |
| 1.1285 | 1.1570 | 1.1180 | 1.1110 |
| 1.1350 | 1.1820 | 1.1110 | 1.1010 |
USD/JPY
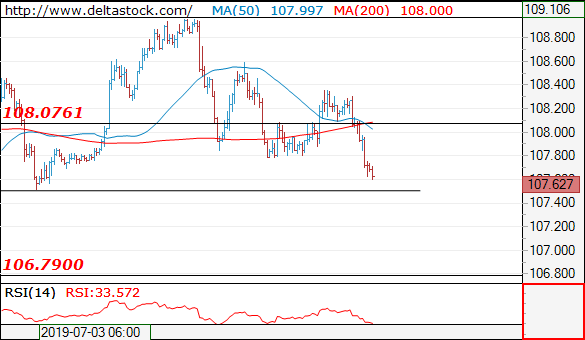
Current level - 107.62
The breach of 108.10 static support led to a slide towards 107.50 target area. Initial resistance lies at 107.80, followed by the crucial 108.30.
| Resistance | Support | ||
| intraday | intraweek | intraday | intraweek |
| 107.80 | 109.80 | 107.50 | 106.70 |
| 108.30 | 112.40 | 106.70 | 104.50 |
GBP/USD
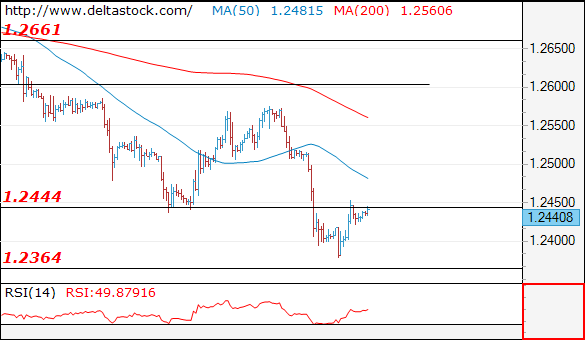
Current level - 1.2440
The rebound after 1.2380 low is corrective, but there is a risk of a spike to 1.2500 resistance area.
| Resistance | Support | ||
| intraday | intraweek | intraday | intraweek |
| 1.2450 | 1.2580 | 1.2360 | 1.2360 |
| 1.2500 | 1.2890 | 1.2220 | 1.2110 |
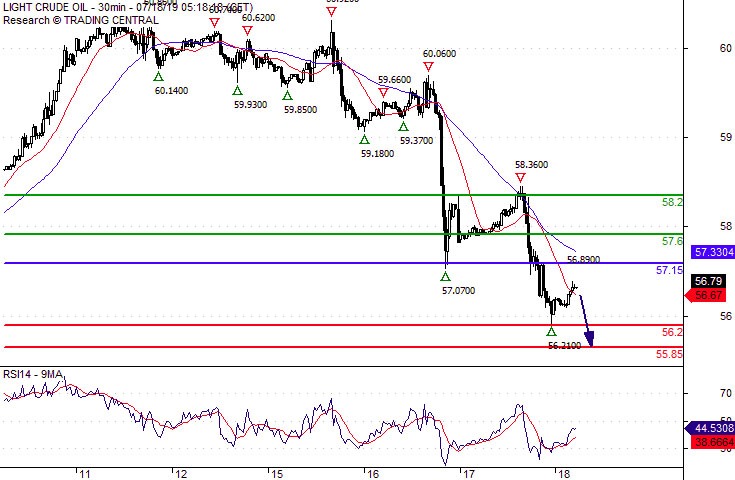
Crude Oil Key Resistance At 57.15
Pivot (invalidation): 57.15
Our preference Short positions below 57.15 with targets at 56.20 & 55.85 in extension.
Alternative scenario Above 57.15 look for further upside with 57.60 & 58.20 as targets.
Comment As Long as the resistance at 57.15 is not surpassed, the risk of the break below 56.20 remains high.
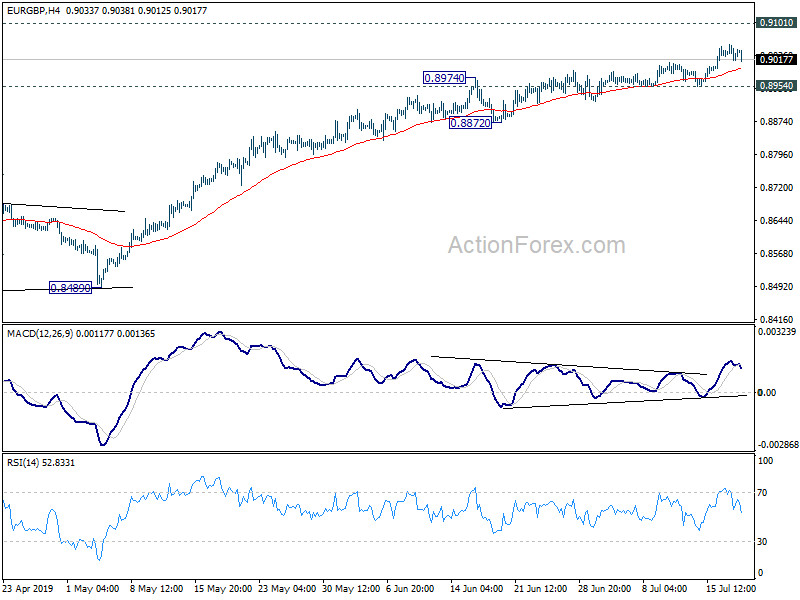
EUR/GBP Daily Outlook
Daily Pivots: (S1) 0.9006; (P) 0.9029; (R1) 0.9051; More...
Further rise is expected in EUR/GBP with 0.8954 support intact. Current rise from 0.8472 would target 0.9101 resistance. We'd be cautious on topping below 0.9101. On the downside, break of 0.8954 support will indicate short term topping. In this case, deeper pull back could be seen to 55 day EMA (now at 0.8875) first.
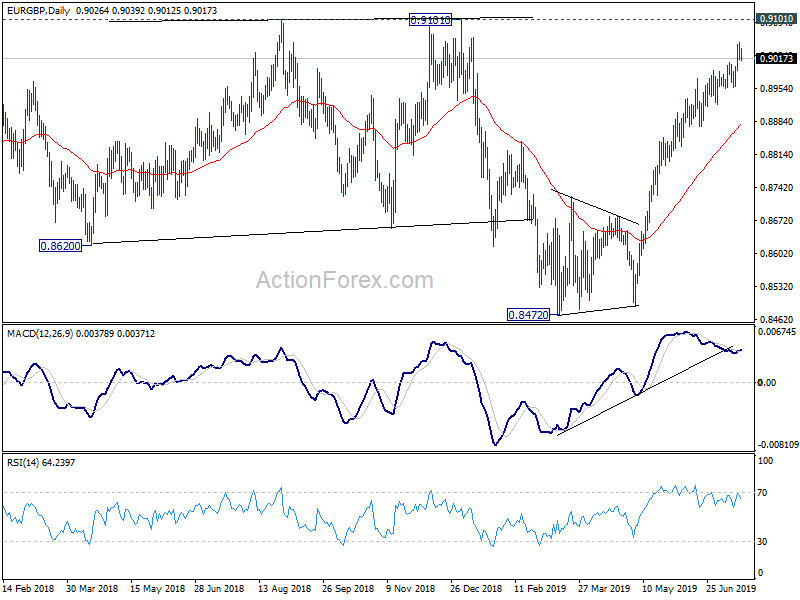
In the bigger picture, medium term decline from 0.9305 (2017 high) is seen as a corrective move. No change in this view. Current development argues that it might have completed with three waves down to 0.8472, just ahead of 38.2% retracement of 0.6935 (2015 low) to 0.9306 at 0.8400, after hitting 55 month EMA (now at 0.8545). Decisive break of 0.9101 resistance will confirm this bullish case. Nevertheless, as EUR/GBP is still staying inside long term falling channel, correction from 0.9305 could still extend to 0.8400 fibonacci level before completion, if upside is rejected by 0.9101.
Silver Spot The Upside Prevails
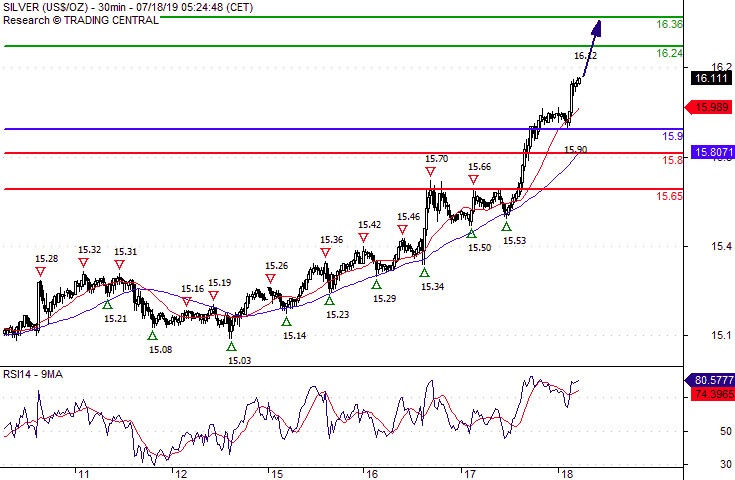
Pivot (invalidation): 15.9000
Our preference Long positions above 15.9000 with targets at 16.2400 & 16.3600 in extension.
Alternative scenario Below 15.9000 look for further downside with 15.8000 & 15.6500 as targets.
Comment The RSI shows upside momentum.