

Sample Category Title
Swiss Franc Trading Higher In The Morning Session
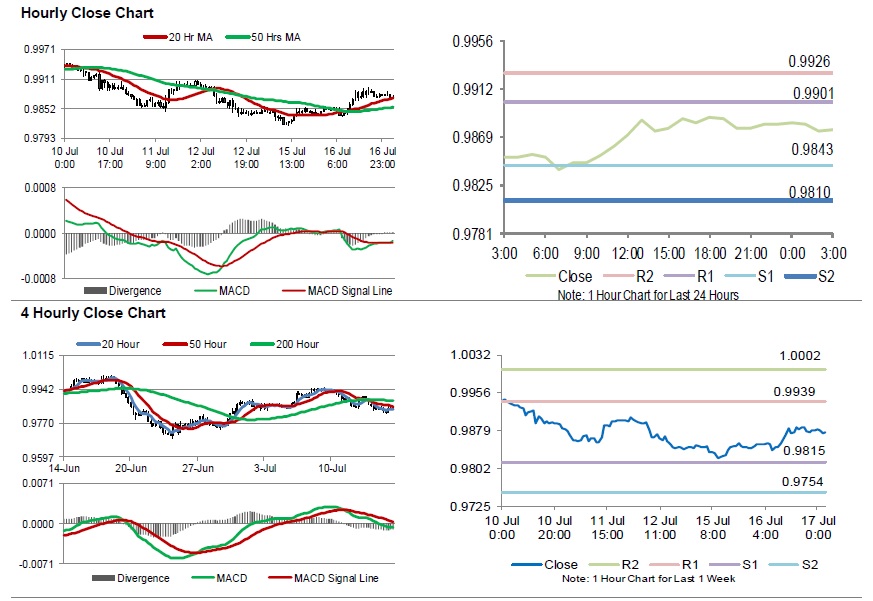
For the 24 hours to 23:00 GMT, the USD rose 0.39% against the CHF and closed at 0.9880.
In the Asian session, at GMT0300, the pair is trading at 0.9875, with the USD trading 0.05% lower against the CHF from yesterday’s close.
The pair is expected to find support at 0.9843, and a fall through could take it to the next support level of 0.9810. The pair is expected to find its first resistance at 0.9901, and a rise through could take it to the next resistance level of 0.9926.
The currency pair is showing convergence with its 20 Hr moving average and trading above its 50 Hr moving average.
Loonie Trading A Tad Higher, Ahead Of Key Economic Releases
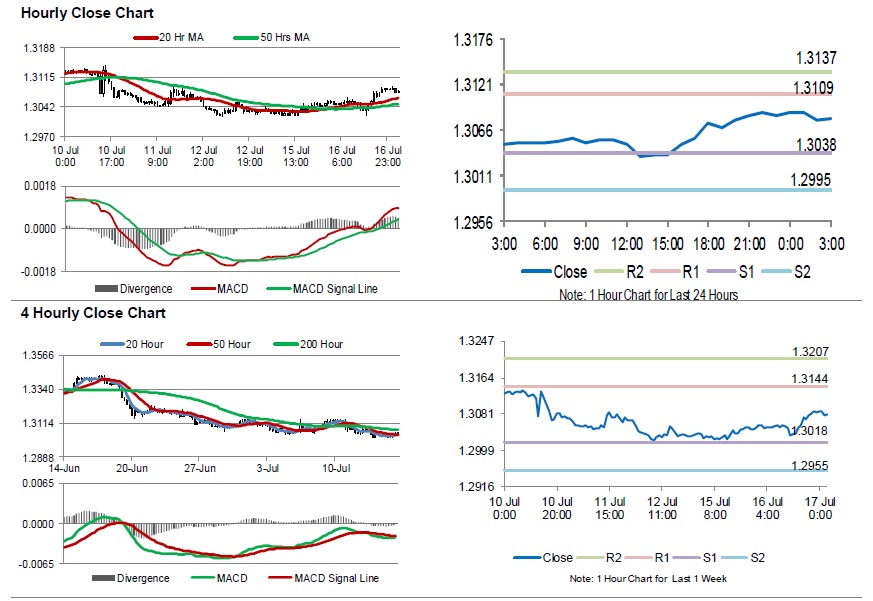
For the 24 hours to 23:00 GMT, the USD rose 0.29% against the CAD and closed at 1.3085.
In the Asian session, at GMT0300, the pair is trading at 1.3081, with the USD trading slightly lower against the CAD from yesterday’s close.
The pair is expected to find support at 1.3038, and a fall through could take it to the next support level of 1.2995. The pair is expected to find its first resistance at 1.3109, and a rise through could take it to the next resistance level of 1.3137.
Trading trend in the Loonie today, is expected to be determined by Canada’s consumer price index for June and manufacturing shipments for May, set to release later in the day.
The currency pair is trading above its 20 Hr and 50 Hr moving averages.
Fitch affirmed Japan’s A rating, expects growth to lose steam after robust Q1
Fitch Ratings has affirmed Japan's Long-Term Foreign Currency Issuer Default Rating (IDR) at 'A' with a stable outlook. In the statement, Fitch noted that the ratings " balance the strengths of an advanced and wealthy economy, with high governance standards and strong public institutions, against weak medium-term growth prospects and high public debt."
The rating agency projects GDP growth of 0.8% in 2019 despite an unexpectedly robust 2.1% in Q1. And, GDP growth is expected to lose steam through early 2020 from "weakening exports and industrial production." Japan and other countries in the region are reeling from the effects of the "global trade downturn" associated with the escalation in the US-China trade dispute. And, a further escalation of global trade tensions could pose a "significant risk" to the outlook for Japan. Also, "recent imposition of export restrictions on Korea has increased geopolitical tensions".
Australia’s Westpac Leading Index Fell In June
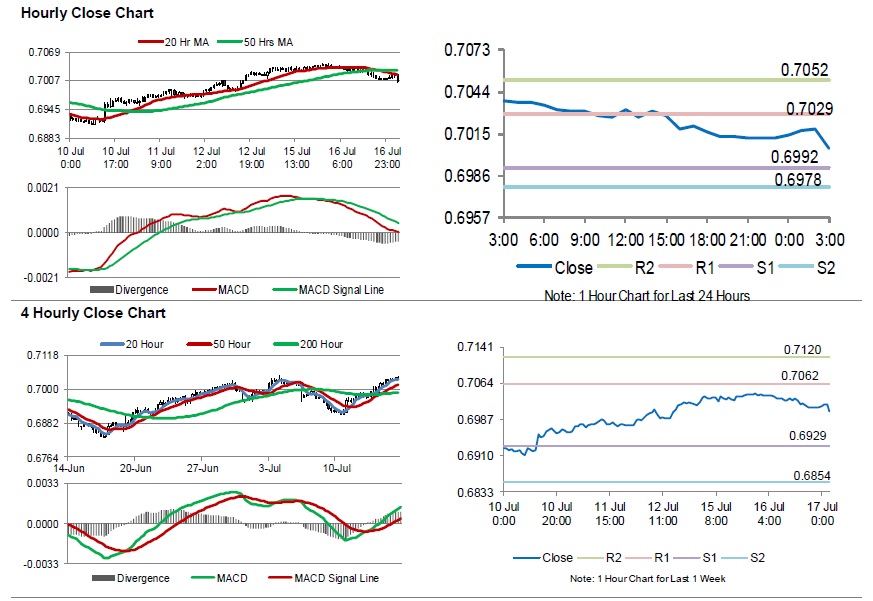
For the 24 hours to 23:00 GMT, the AUD declined 0.41% against the USD and closed at 0.7012.
LME Copper prices declined 0.6% or $38.5/MT to $5959.0/MT. Aluminium prices rose 0.4% or $8.0/MT to $1818.0/MT.
In the Asian session, at GMT0300, the pair is trading at 0.7005, with the AUD trading 0.10% lower against the USD from yesterday's close.
Overnight data showed that Australia's Westpac leading index declined 0.08% on a monthly basis in June, following a revised fall of 0.07% in the prior month.
The pair is expected to find support at 0.6992, and a fall through could take it to the next support level of 0.6978. The pair is expected to find its first resistance at 0.7029, and a rise through could take it to the next resistance level of 0.7052.
Moving ahead, traders would await Australia's unemployment rate for June and the NAB business confidence for the second quarter, slated to release overnight.
The currency pair is showing convergence with its 20 Hr moving average and trading below its 50 Hr moving average.
Gold: Yellow Metal Extends Its Losses In The Asian Session
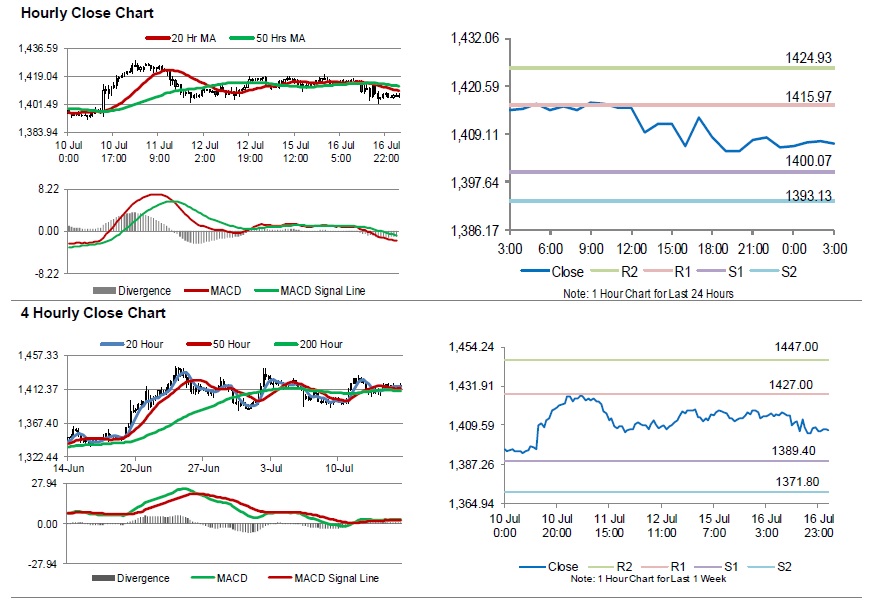
For the 24 hours to 23:00 GMT, Gold declined 0.68% against the USD and closed at USD1408.20 per ounce, amid broad strength in the US dollar, following robust US retail sales data.
In the Asian session, at GMT0300, the pair is trading at 1407.00, with gold trading 0.09% lower against the USD from yesterday’s close.
The pair is expected to find support at 1400.07, and a fall through could take it to the next support level of 1393.13. The pair is expected to find its first resistance at 1415.97, and a rise through could take it to the next resistance level of 1424.93.
The yellow metal is trading below its 20 Hr and 50 Hr moving averages.
Crude Oil: Oil Trading Higher, Ahead Of EIA’s Weekly Crude Oil Stockpiles Data
For the 24 hours to 23:00 GMT, Crude Oil declined 3.00% against the USD and closed at USD57.59 per barrel, as Iran tensions eased, after the US Secretary of State, Mike Pompeo, stated that Iran is ready to negotiate on the missile program.
Separately, the American Petroleum Institute (API) reported that US crude oil inventories fell by 1.4 million barrels to 460.0 million barrels in the week ended 12 July 2019.
In the Asian session, at GMT0300, the pair is trading at 57.60, with oil trading marginally higher against the USD from yesterday's close.
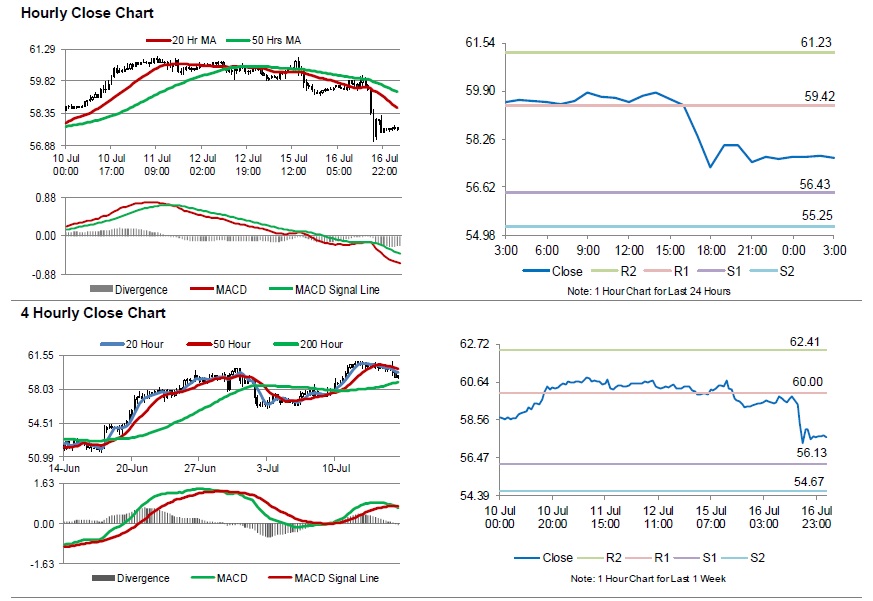
The pair is expected to find support at 56.43, and a fall through could take it to the next support level of 55.25. The pair is expected to find its first resistance at 59.42, and a rise through could take it to the next resistance level of 61.23.
Crude oil is trading below its 20 Hr and 50 Hr moving averages.
EUR/USD And USD/JPY Facing Major Hurdles
EUR/USD started a major drop from the 1.1285 resistance zone. USD/JPY is currently trading above 108.00 and it is facing a lot of hurdles near the 108.30 and 108.50 levels.
Important Takeaways for EUR/USD and USD/JPY
- The Euro failed two times near the 1.1285 level, resulting in a fresh bearish wave below 1.1245.
- There was a break below a major bullish trend line with support near 1.1250 on the hourly chart of EUR/USD.
- USD/JPY declined heavily below 108.00 and later found support near the 107.80 level.
- There are two bearish trend lines forming with resistance near 108.30 and 108.50 on the hourly chart.
EUR/USD Technical Analysis
The Euro failed to continue above the 1.1285 level and formed a double top against the US Dollar. The EUR/USD pair formed a swing high near the 1.1283 and recently started a significant decline.
The pair came under a lot of pressure below 1.1250 and the 50 hourly simple moving average. There was a break below a major bullish trend line with support near 1.1250 on the hourly chart of EUR/USD.
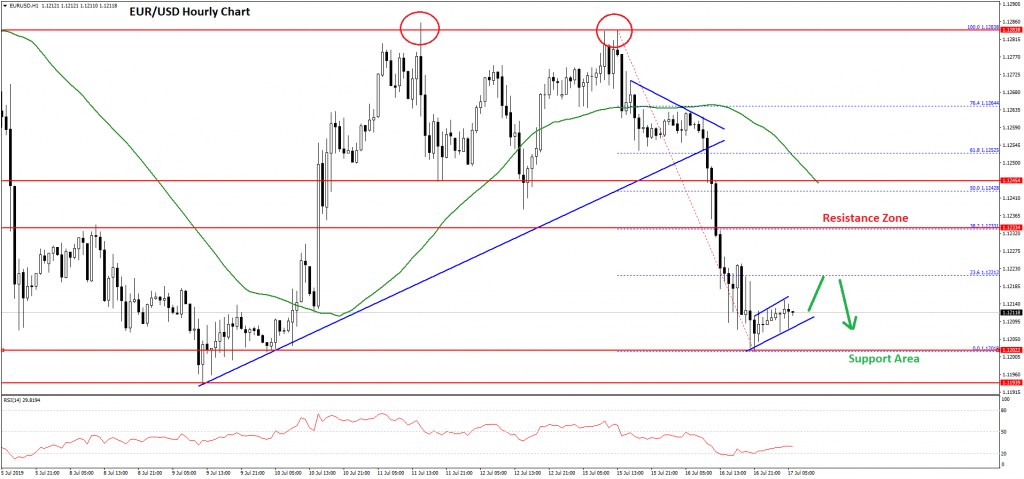
The pair even traded below the 1.1225 support level and traded close to the 1.1200 level on FXOpen. A swing low was formed near 1.1201 and recently started consolidating losses above 1.1210.
An immediate is near the 1.1200 level plus the 23.6% Fib retracement level of the recent decline from the 1.1283 high to 1.1201 low. If there is a break above the 1.1220 level, the pair could continue to rise towards the 1.1235 level.
The main resistance on the upside is near the 1.1240 level. Moreover, the 50% Fib retracement level of the recent decline from the 1.1283 high to 1.1201 low is also near the 1.1242 level to act as a strong resistance.
Conversely, if there is no upside break, EUR/USD might continue to slide below the 1.1210 level. An immediate support is near the 1.1200 level, below which there is a risk of a sharp drop towards the 1.1180 or 1.1175 level.
USD/JPY Technical Analysis
The US Dollar declined after it failed to clear the 108.60 resistance area against the Japanese Yen. The USD/JPY pair broke the 108.40 and 108.20 support levels to enter a bearish zone.
The pair even broke the 108.00 support and the 50 hourly simple moving average. A swing low was formed near 107.80 and recently the pair started an upside correction. The pair recovered above the 108.00 level and the 50 hourly simple moving average.
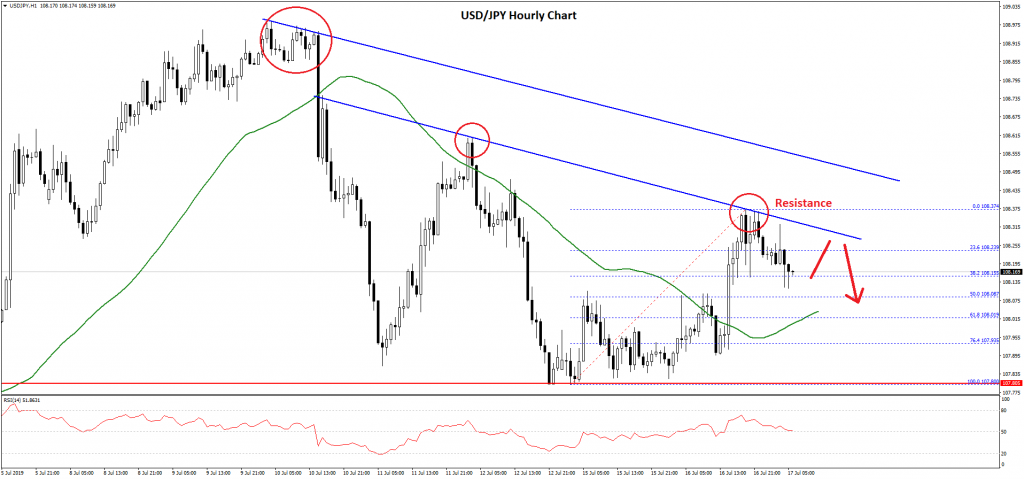
It even broke the 108.30 level and traded as high as 108.37. However, it is facing a lot of hurdles near 108.40. Moreover, there are two bearish trend lines forming with resistance near 108.30 and 108.50 on the hourly chart.
On the downside, the 108.10 level might act as a support along with the 50% Fib retracement level of the last wave from the 107.80 low to 108.37 high.
However, the main support is near the 108.00 level and the 50 hourly simple moving average. The 61.8% Fib retracement level of the last wave from the 107.80 low to 108.37 high is also near the 108.00 level.
Therefore, the pair remains well supported on the downside near the 108.10 and 108.00 levels. As long as it is trading above the 50 hourly SMA, there are chances of a break above the 108.50 level. If not, there is a risk of a fresh decline below 108.00 and 107.80 in the coming sessions.
GBP/JPY Nosedives, Decline Could Extend To 132.00
Key Highlights
- The British Pound declined sharply after it broke the 135.20 support against the Japanese Yen.
- A crucial resistance is forming near 135.00 and a bearish trend line on the 4-hours of GBP/JPY.
- The UK Claimant Count changed 38.0K in June 2019, whereas the market was looking for 22.8K.
- The UK Consumer Price Index in June 2019 could rise 2% (YoY), similar to the last increase.
GBPJPY Technical Analysis
After struggling to clear the 137.15 level, the British Pound started a strong decline against the Japanese Yen. The GBP/JPY pair even broke the key 135.20 support level to post a new multi-month low.
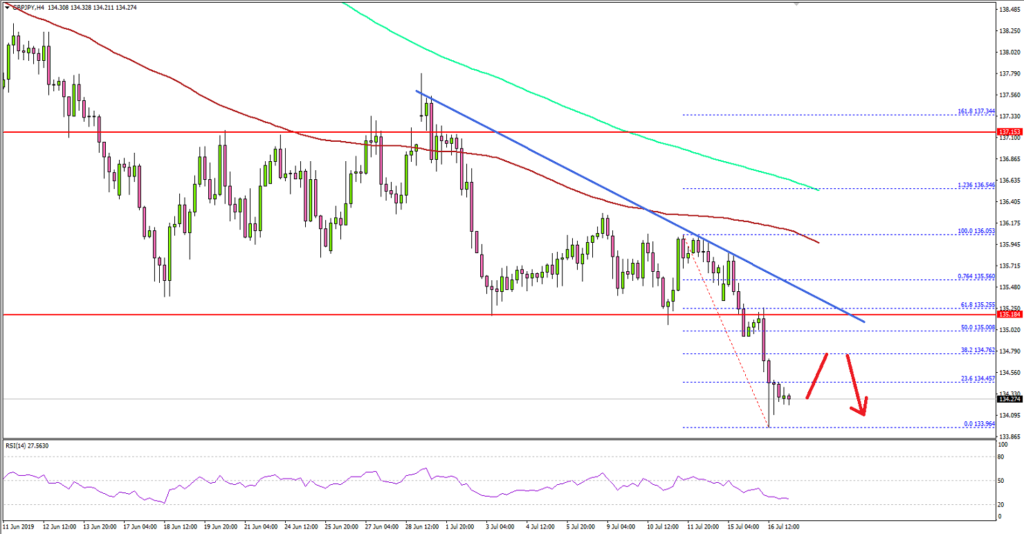
Looking at the 4-hours chart, the pair turned bearish after it settled below the 136.00 support level. More importantly, there was a daily close below the 135.20 support and the 100 simple moving average (red, 4-hours).
The recent decline was such that the pair traded to a new 7-month low at 133.96. It is currently correcting losses towards the 134.75 level. However, the pair is likely to struggle above 135.00.
It seems like there is a crucial resistance forming near 135.20 and a bearish trend line on the same chart. Moreover, the 50% Fib retracement level of the downward move from the 136.05 high to 133.96 low is also near the 135.00 level to act as resistance.
Above the 135.20 resistance, the next major resistance is near the 136.00 level plus 100 simple moving average (red, 4-hours).
If there is no upside break above 135.20, the pair could continue to decline. A clear break below the 134.00 level might call for an extended drop towards the 132.00 level.
Fundamentally, the UK Claimant Count (measures the change in the number of unemployed people) report for June 2019 was released by the National Statistics. The market was looking for the count to change by 22.8K.
The actual result was disappointing as the count changed by 38.0K. Besides, the last reading was revised from 23.2K to 24.5K. On the positive side, the ILO Unemployment Rate remained at 3.8%.
The report added:
The UK employment rate was estimated at 76.0%, higher than a year earlier (75.6%); on the quarter, the rate was 0.1 percentage points lower, the first quarterly decrease since June to August 2018.
The British Pound is clearly under pressure and it seems like GBP/USD and GBP/JPY might continue to slide in the near term.
Economic Releases to Watch Today
- UK Consumer Price Index June 2019 (YoY) – Forecast +2.0%, versus +2.0% previous.
- UK Core Consumer Price Index June 2019 (YoY) – Forecast +1.8%, versus +1.7% previous.
- Euro Zone CPI for June 2019 (YoY) – Forecast +1.2%, versus +1.2% previous.
- Euro Zone CPI for June 2019 (MoM) – Forecast +0.1%, versus +0.1% previous.
- US Housing Starts June 2019 (MoM) – Forecast 1.261M, versus 1.269M previous.
- US Building Permits June 2019 (MoM) – Forecast 1.300M, versus 1.299M previous.
- Canadian Consumer Price Index June 2019 (MoM) – Forecast -0.2%, versus +0.4% previous.
- Canadian Consumer Price Index June 2019 (YoY) – Forecast +2.0%, versus +2.4% previous.
Stocks Consolidate Drop From Record Levels
Gold hit by dollar’s rise
US indices were little changed in Asia, though the story across other global indices was more mixed. Japan shares under-performed along with China and Hong Kong indices while Australian shares gained 0.57%. Trump’s comment that he still had the option of imposing higher tariffs on Chinese goods, despite agreeing to a truce on them last month, knocked US indices off their lofty pedestal yesterday.
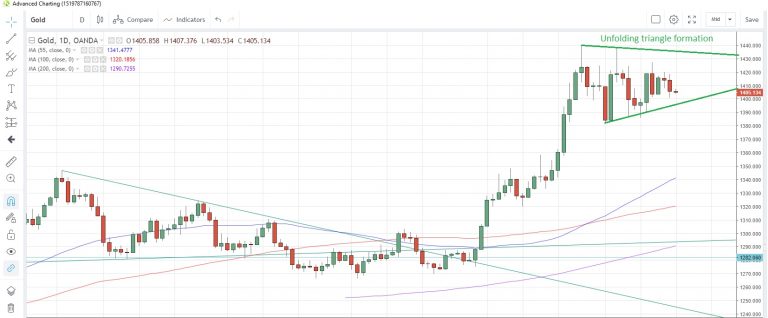
The US dollar held on to the gains for the past two days in slow trade with AUD/USD sliding 0.1% to 0.7005 and USD/JPY sliding 0.08% to 108.15. Gold continued to consolidate lower within a triangle formation that has been unfolding since June 25, while oil prices steadied after touching a one-week low yesterday.
Gold Daily Chart
China to adopt a hard line?
The South China Morning Post reported that China had recently appointed a new face to the China negotiating team to face their US counterparts. Zhong Shan is seen as a bit of a hardliner and hawk which, the report suggests, implies China is in no hurry to wrap up the trade talks with the US and could even drag negotiations through to the 2020 US election. The report lays the blame for the trade conflict and resultant drag on the global economy fully on the US.
Consumer price data in the frame
A slew of price data for June populate the European calendar, with the UK releasing the retail price, producer price and consumer price indices for the month. Consumer prices have taken on more significance than the other two more recently, and CPI is seen flat on the month from May and up 2% on the year. This should not be too troubling for the Bank of England, whose monetary policy currently appears to be handcuffed to Brexit. Consumer prices in the Euro-zone are expected to rise 1.2% y/y and 0.1% m/m in the same month.
Heading across the pond to North America, housing starts and building permits data are on tap. Housing starts are forecast to rebound to +1.9% from May's 0.9% decline while permits rose 0.7% last month. Canada's consumer prices are expected to fall 0.2% last month from a month earlier, which would be the first negative print in six months, and may give the Bank of Canada a bit more leeway to follow the Fed's lead in trimming rates.
Market Morning Briefing: Pound Is Trading Lower As Well
STOCKS
Renewed concerns on the US-China trade war is weighing on the equities. Trump's comment yesterday that the trade deal has a long way to go has raised concerns. This has stalled the rally in Dow. The Asians broadly remain subdued.
The rally in the Dow (27335.63, -23.53, -0.09%) seems to be losing steam and strengthening the case of the resistance at 27500 to hold well. As we have been mentioning, we expect the resistance at 27500 to hold and the Dow can dip to 27200-27000 and the possibility of the corrective fall extending to 26500 or even lower cannot be ruled out.
DAX (12430.97, +43.63, +0.35%) has moved up further. As mentioned yesterday, a strong break above seems 12450 (most preferred) will boost the momentum to revisit. While 12450 holds, DAX can dip to 12300 again and even 12250.
Contrary to our expectation, Nikkei (21450.31, -84.94, -0.39%) broken the 21500-2175 range on the downside. Immediate support is at 21435 a break below which will accelerate the fall to 21350-21300 in the coming sessions.
Shanghai (2941.73, +4.11, +0.14%) remains stable below 2950. While below 2950 it can consolidate between 2900 and 2950. Our bias continues to remain bullish and we expect the index to breach 2950 and rise to 3000 in the coming days.
As against our expectation, the Sensex (39131.04, +234.33, +0.60%) and Nifty (11662.60, +74.25, +0.64%) have risen past 39100 and 11650. If they manage to sustain higher a further rise to 39500 on the Sensex and 11700 on the Nifty is possible in the coming sessions. Our bearish view will go wrong on a strong break above 39500 (Sensex) and 11700 (Nifty).
COMMODITIES
Trump indicated easing of tensions with Iran as news came across that Iran was willing to negotiate on its missile program. This has led to a dip in Crude prices yesterday. Oil prices may continue to dip some more in the next few sessions before bouncing back. Gold and Copper are trading low while Silver has broken above immediate resistance near 15.50 and has moved higher outperforming Gold just now.
Gold (1407) is also down but could be ranged in the 1380-1440 region for the near term.
Silver (15.65) has surprisingly risen amongst the falling commodity prices overall outperforming Gold. Earlier resistance near 15.50 has now turned to be an important support and it would be crucial to see if the rise sustains in the medium term.
Copper (2.7015) has dipped slightly. A fall towards 2.66/64 could be on the cards for the near term.
Brent (64.47) has fallen sharply on news of easing tensions between Iran and US. Although there is scope of falling towards 63 on the downside, prices may bounce back from 64 to re-test 65-66 on the upside. On the 3-day candles the resistance is holding well and indicated bearishness for Crude prices towards 62-60 in the coming weeks with some scope of rising towards 68-69.
Nymex (57.58) has broken below our expected 58.50 and now looks bearish towards 56 in the near term.
FOREX
US retail sales yesterday came out stronger than expected and helped Dollar Index to move higher.
Dollar Index (97.36) rose sharply but higher than our expected 97.20. But as mentioned yesterday, the rise could be short lived as 97.50 could act as an important resistance on the upside. Only a break above 97.50, if seen and sustains could indicate some possibility of a rise towards 98.50. Preferred view would be a fall from 97.50 towards 96 in the medium term.
Euro (1.1210) could get some support near current levels and could bounce back towards 1.13 in the near term. Break below 1.12, is needed to turn bearish towards 1.1125 in the longer run. We would watch price action near 1.12
Dollar-Yen (108.18) has risen on sharp rise in the US Dollar and could test resistance near 108.5-109.0 on the upside. While below 109, Dollar Yen is bearish for the medium term.
Euro-Yen (121.27) is down and could test support at 121 from where a bounce back towards 122-123 looks likely. Only a break below 121 would negate our current bullish view and target lower levels of 119. We would watch price action near 121.
Aussie (0.7005) is trading lower and could target 0.695 in the near term.
Pound (1.2412) is trading lower as well. Unless it bounces back from 1.24 immediately, it could fall further towards 1.22 in the medium term.
USDCNY (6.8820) has also moved above 6.88 but could face rejection either from current levels or from levels near 6.89/90 from where a fall looks likely.
USDINR (68.72) rose towards our upper limit of 68.80 within the mentioned 68.25-68.80. It would be important to see if 68.80 holds and pushes the pair back towards 68.50. Else a break above 68.80 could open up scope of rising towards 69.0-69.25.
INTEREST RATES
Strong economic data release has pushed the US Treasury yields yesterday. The Treasury yields can move further higher in the coming days. The German Yields remain stable and are closer to key resistances which can halt the recent rally. A near-term correction is possible. The Indian 10Yr GoI has dipped below a key support and can extend its fall further in the coming sessions.
The US retail sales in June increased by 0.4% (MoM) / 3.4% (YoY). Though the US Federal Reserve is ready to cut rates, the recent data releases like the job numbers, inflation and yesterday's retail sales indicate that the central bank may not decrease rates at a faster pace as the market would expect. This could limit the downside in the yields going forward.
The US 2Yr (1.85%) and 5Yr (1.87%) yields were up 3 bps each while the 10Yr (2.10%) was up 2bps. The 30Yr (2.61%) remained stable. As mentioned yesterday, the yields are likely to rise further in the coming days. The 10Yr can rise to 2.20% while it remains above the 2.05%-2.00% support zone. Similarly, the 5Yr has support at 1.8% and can rise to 2% on a strong break above 1.92%.
The German yields remained broadly stable across tenors. The 2Yr (-0.75%), 5Yr (-0.60%), 10Yr (-0.25%) were stable while the 30Yr (0.33%) inched up by 1 bps. The yields have risen sharply since the beginning of the month and are closer to a key resistance. The 30Yr has resistance at 0.40%. While it holds, a dip to 0.28%-0.26% is possible. Similarly, the 10Yr has resistance at -0.19% which can cap the upside and trigger a corrective fall to -0.30% in the coming days.
Contrary to our expectation for a bounce, the 10Yr GOI (6.3316%) has declined below 6.35%. The yield can now extend its down trend to 6.25% the coming sessions.