Sample Category Title
The Analytical Overview Of The Main Currency Pairs
The EUR/USD currency pair
Technical indicators of the currency pair:
Prev Open: 1.12533
Open: 1.12662
% chg. over the last day: +0.15
Day's range: 1.12621– 1.12747
52 wk range: 1.1111 - 1.2090
Last week, the US dollar came under pressure after the dovish comments by the Fed Chairman. At the moment, the EUR/USD currency pair is in a sideways movement. Unidirectional trend is not observed. The trading instrument tests local support and resistance levels: 1.12500 and 1.12800, respectively. Financial market participants expect additional drivers. We recommend to open positions from key levels.
The Economic News Feed for 15.07.2019 is calm.
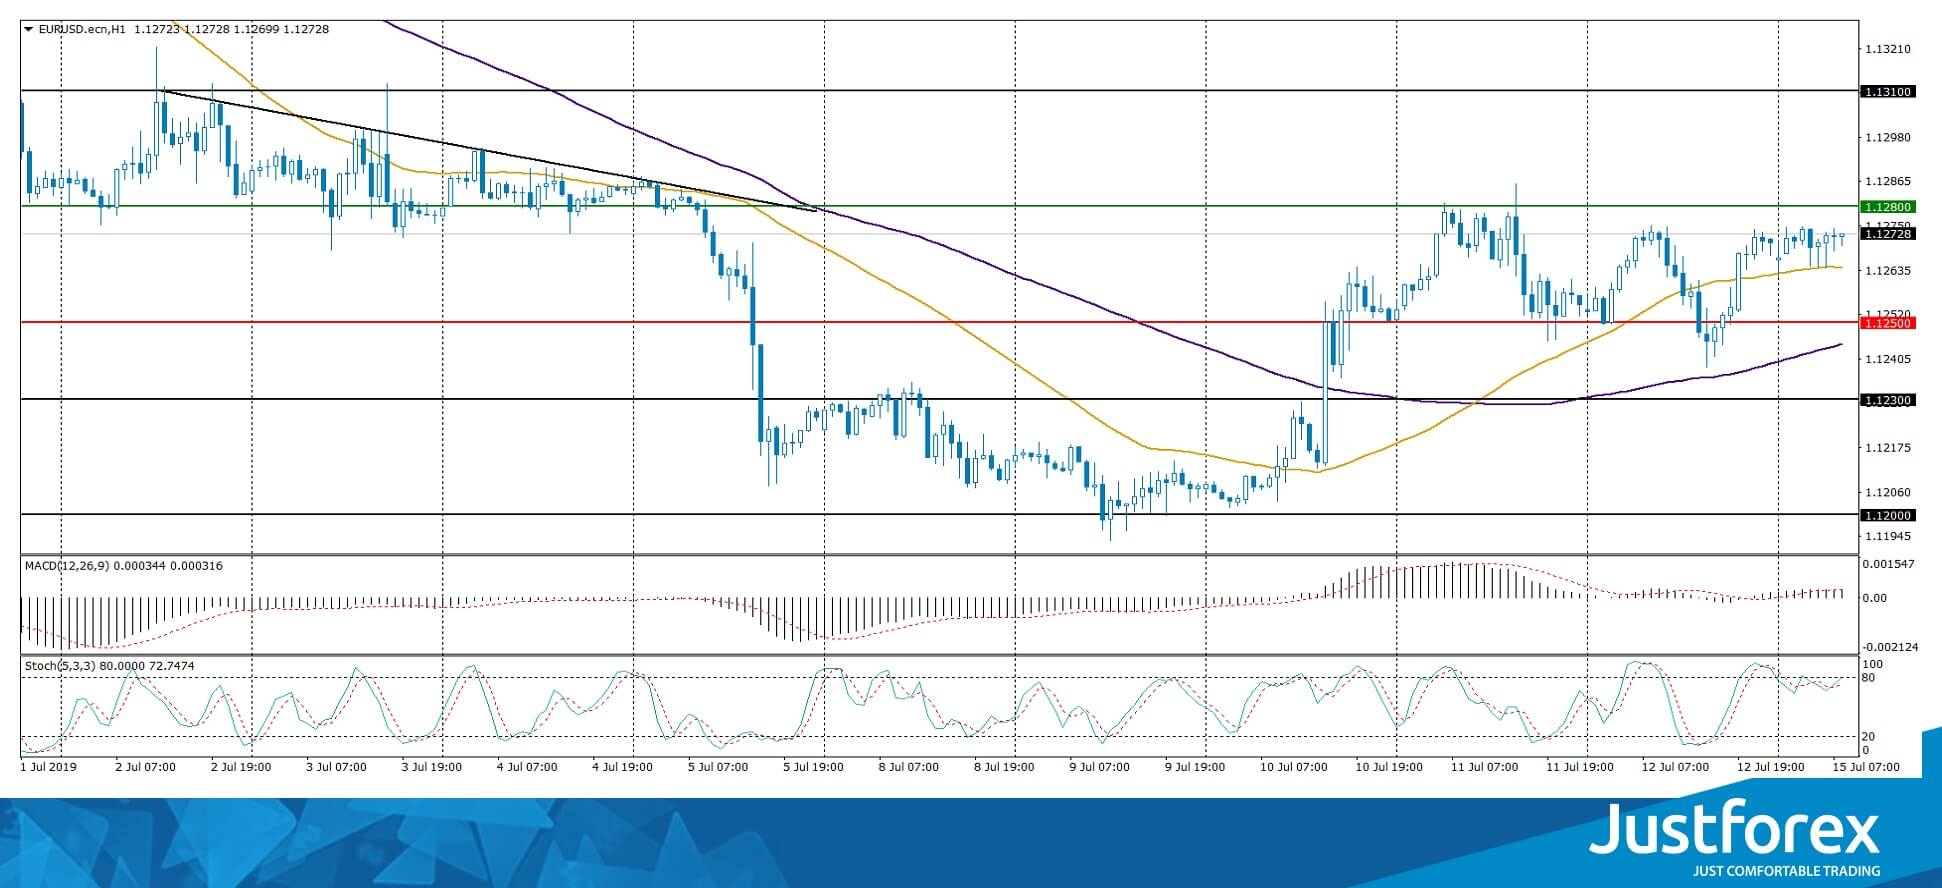
The price has fixed above 50 MA and 100 MA, which indicates the strength of buyers.
The MACD histogram is in the positive zone and continues to rise, which signals bullish moods.
The Stochastic Oscillator is located near the overbought zone, the %K line is above the %D line, which gives a weak signal to buy EUR/USD.
Trading recommendations
Support levels: 1.12500, 1.12300, 1.12000
Resistance levels: 1.12800, 1.13100, 1.13500
If the price consolidates above 1.12800, expect further growth to 1.13100-1.13400.
Alternatively, the quotes can drop to 1.12200-1.12000.
The GBP/USD currency pair
Technical indicators of the currency pair:
Prev Open: 1.25234
Open: 1.25495
% chg. over the last day: +0.43
Day's range: 1.25478 - 1.25778
52 wk range: 1.2438 - 1.3631
GBP/USD retreated from annual lows and updated the local maximums. This was largely caused by the technical factors. Investors began to partially fix positions on the pound after a long fall. At the moment, GBP/USD quotes are consolidating. The key range is 1.25400-1.25800. The trading instrument has the potential for further correction. We recommend to keep up to date information on Brexit. Positions must be opened from key levels.
The Economic News Feed for 15.07.2019 is calm.
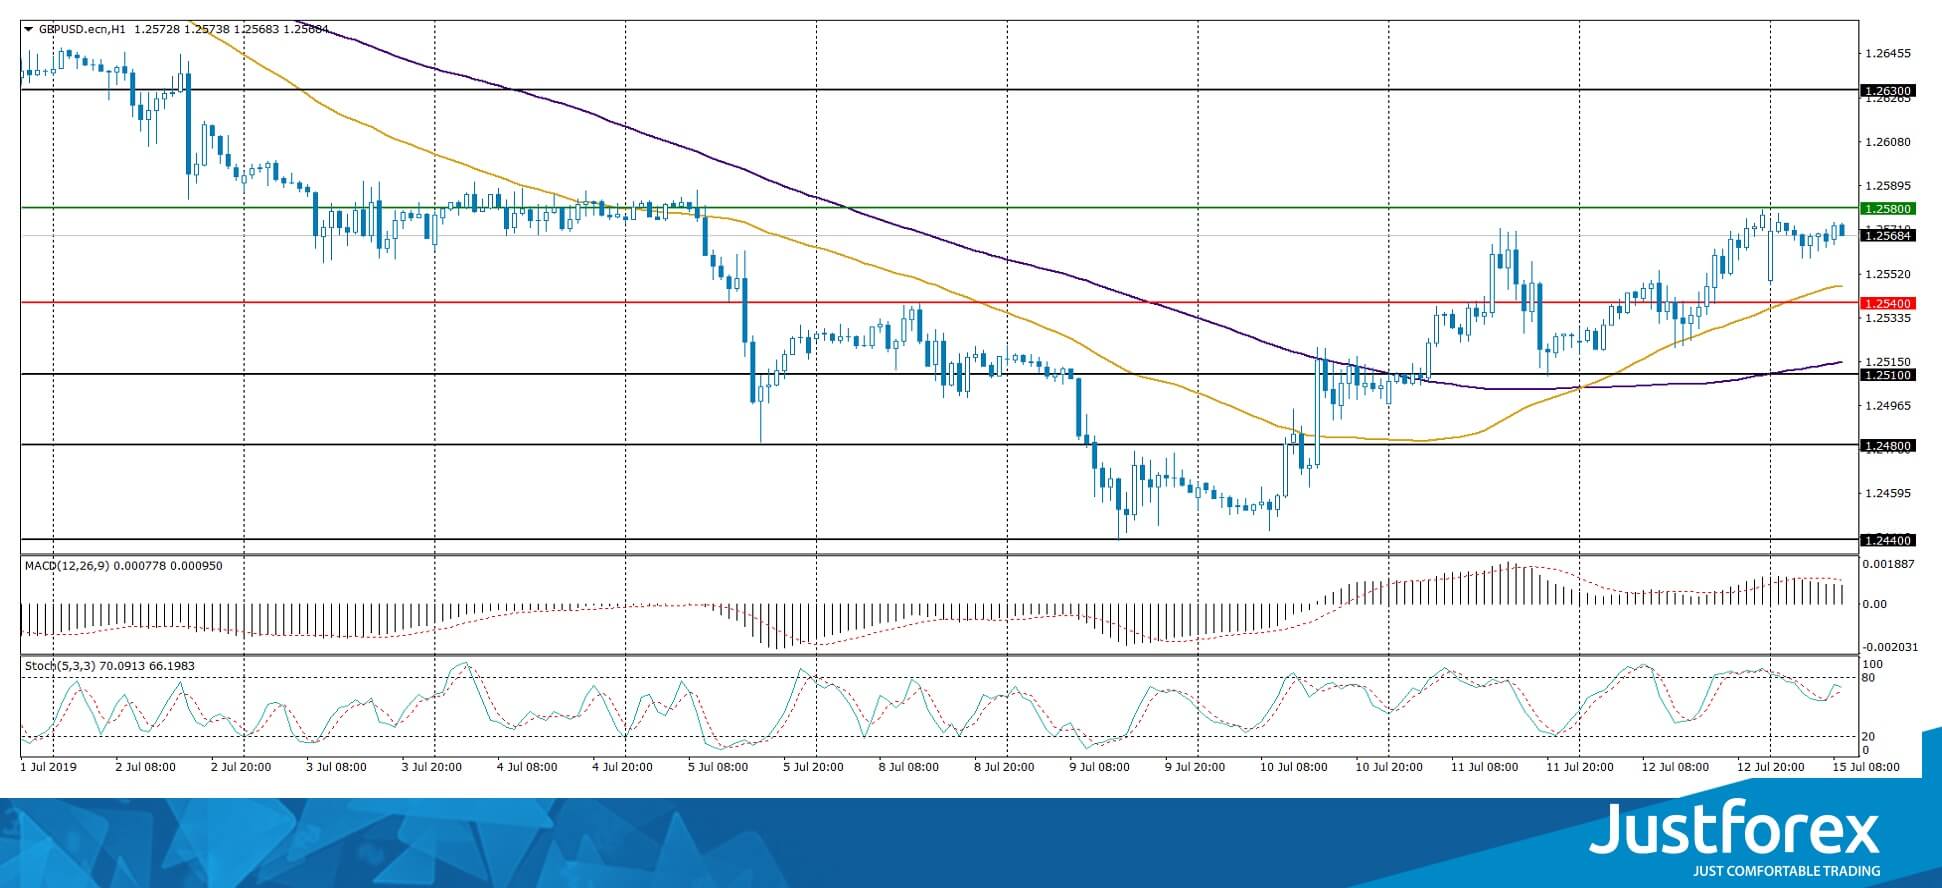
The price has fixed above 50 MA and 100 MA, which indicates the strength of buyers.
The MACD histogram is in the positive zone, but below the signal line, which gives a weak signal to buy GBP/USD.
The Stochastic Oscillator is in the neutral zone, the %K line has started to cross the %D line. There are no signals at the moment.
Trading recommendations
Support levels: 1.25400, 1.25100, 1.24800
Resistance levels: 1.25800, 1.26300
If the price consolidates above 1.25800, the quotes will ascend to 1.26200-1.26400.
Alternatively, the quotes can correct to 1.25100-1.24800.
The USD/CAD currency pair
Technical indicators of the currency pair:
Prev Open: 1.30699
Open: 1.30312
% chg. over the last day: -0.33
Day's range: 1.30255 - 1.30429
52 wk range: 1.2727 - 1.3664
The bearish mood prevails on the USD/CAD currency pair. At the moment, the trading tool is testing key extremes. USD/CAD quotes are consolidating near the local support level of 1.30200. 1.30500 is already a “mirror” resistance. Trading instrument can decline further. We recommend to pay attention to the oil quotes dynamics. You should open positions from key levels.
The Economic News Feed for 15.07.2019 is calm.
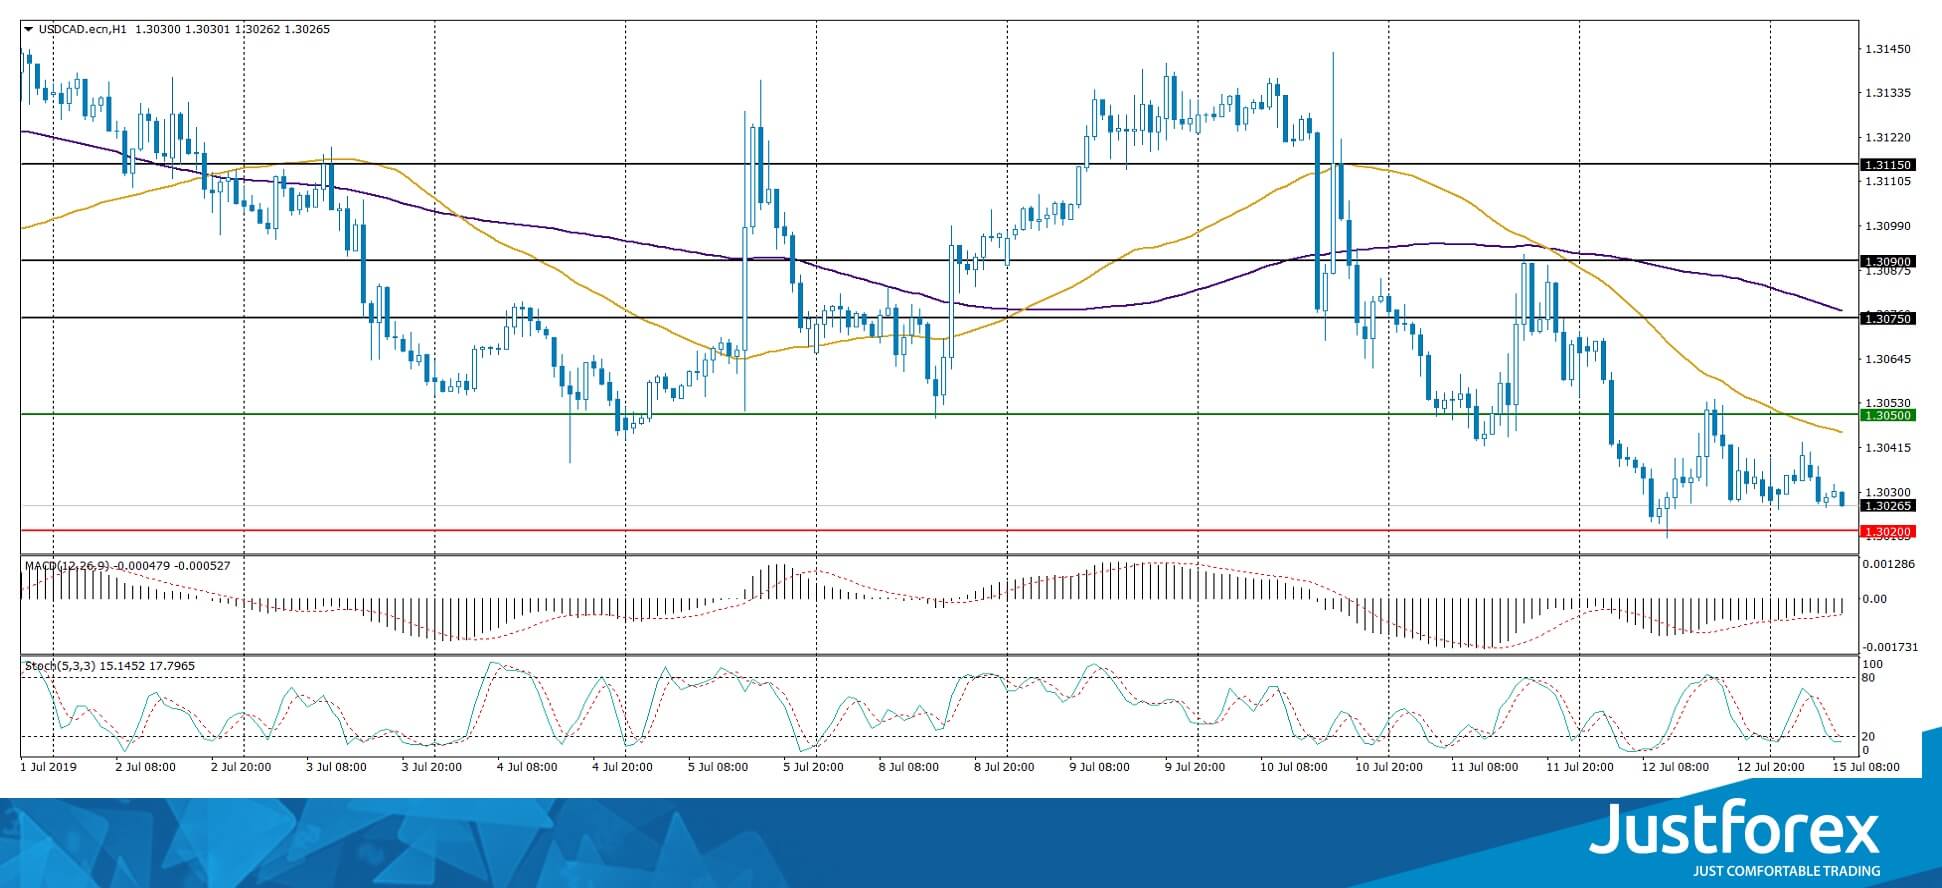
The price has fixed below 50 MA and 100 MA, which indicates the strength of the sellers.
The MACD histogram is in the negative zone and continues to decline, which gives a strong signal to sell USD/CAD.
The Stochastic Oscillator is in the oversold zone, the %K line is below the %D line, which also indicates bearish moods.
Trading recommendations
Support levels: 1.30200, 1.30000, 1.29750
Resistance levels: 1.30500, 1.30750, 1.30900
If the price consolidates below 1.30200, expect a descend toward 1.30000-1.29750.
Alternatively, the quotes can grow to 1.30700-1.30900.
The USD/JPY currency pair
Technical indicators of the currency pair:
Prev Open: 108.489
Open: 107.854
% chg. over the last day: -0.54
Day's range: 107.798 - 108.109
52 wk range: 104.97 - 114.56
The USD/JPY currency pair stabilized after a sharp decline at the end of last week. At the moment the trading instrument is consolidating. Local levels of support and resistance are 107.800 and 108.100. The USD/JPY currency pair can decline further. We recommend to pay attention to the US Treasury bonds' yield dynamics. Positions must be opened from key levels.
Japanese markets are closed due to the holiday.
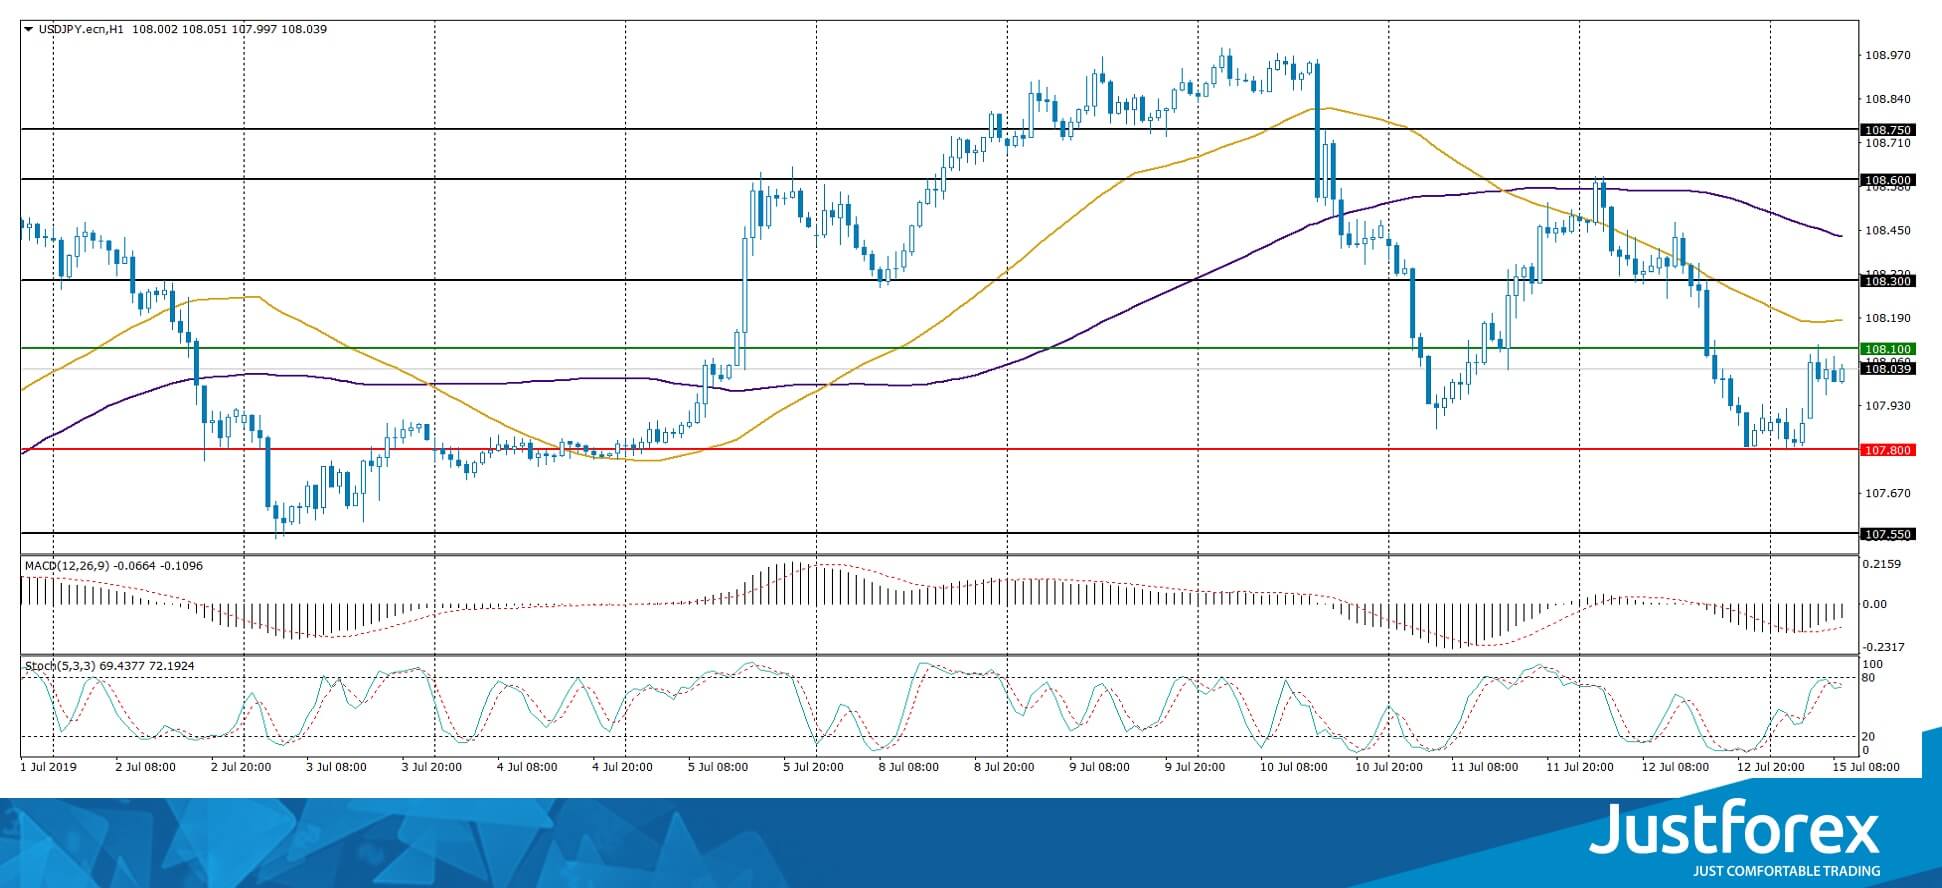
The price has fixed below 50 MA and 100 MA, which indicates the strength of the sellers.
The MACD histogram is in the negative zone, but above the signal line, which gives a weak signal to sell USD/JPY.
Stochastic Oscillator is in the neutral zone, the %K line crossed the %D line. There are no signals at the moment.
Trading recommendations
Support levels: 107.800, 107.550
Resistance levels: 108.100, 108.300, 108.600
If the price consolidates below 107.800, expect further descend toward 107.550-107.400.
Alternatively, the quotes can grow to 108.400-108.600.
EURUSD Makes Higher Low But Uptrend Not Confirmed Yet
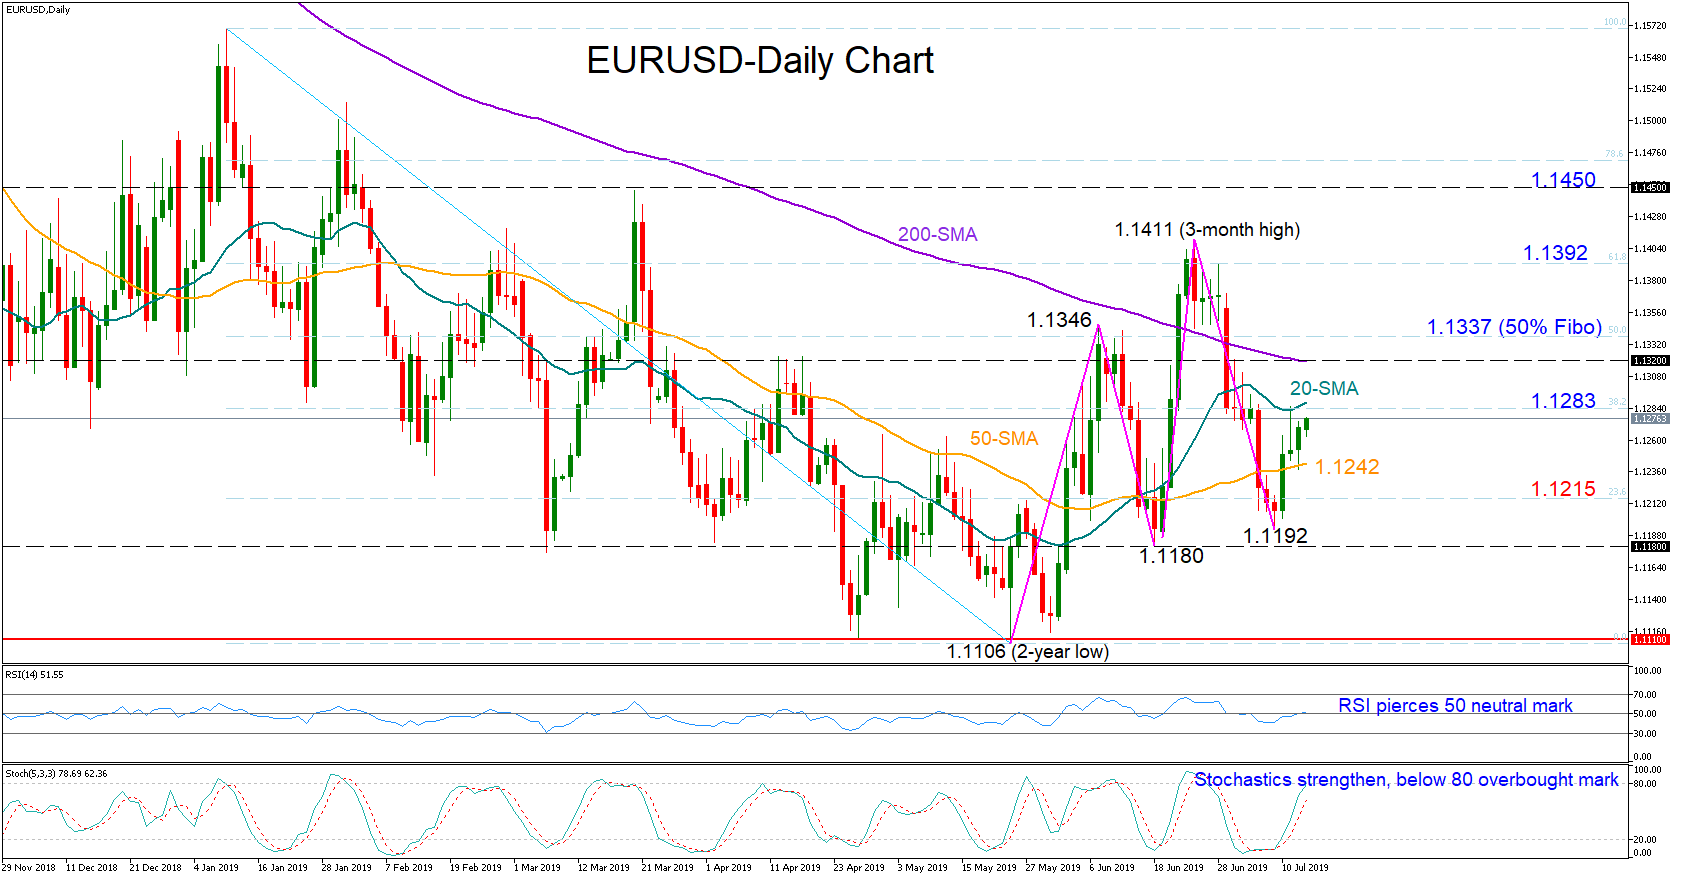
EURUSD confirmed another higher low at 1.1192 last week but the market needs a more aggressive rally above the 1.1411 top to resume confidence on the uptrend which started from the 1.1106 bottom. The short-term risk is currently looking neutral-to-positive as the RSI is trying to hold strength above the 50 level, while the Stochastics are positively sloped below the 80 overbought mark.
Immediate resistance to additional upside corrections could be detected around 1.1283, where the 38.2% Fibonacci retracement of the 1.1569-1.1106 bearish wave and the 20-day simple moving average (SMA) are located. A decisive close above the 200-day SMA and a break of the 50% Fibonacci of 1.1337 could push for further buying, probably until the 61.8% Fibonacci of 1.1392.
On the way down, the bears would likely pause near the 50-day SMA before heading towards the 23.6% Fibonacci of 1.1215. Traders could comfortably raise selling volumes under the 1.1180 mark, sending the price down to the 2-year low of 1.1106 reached in late-May.
Meanwhile in the medium-term window, EURUSD is in a range with a low boundary at 1.1105 and an upper boundary at 1.1450. The rising 50-day SMA and the falling 200-day SMA, however, increase hopes for a brighter outlook.
In brief, EURUSD is facing a neutral-to-positive bias in the short-term, while in the medium-term conditions remain neutral.
EURAUD Declines Sharply, Touching 38.2% Fibonacci
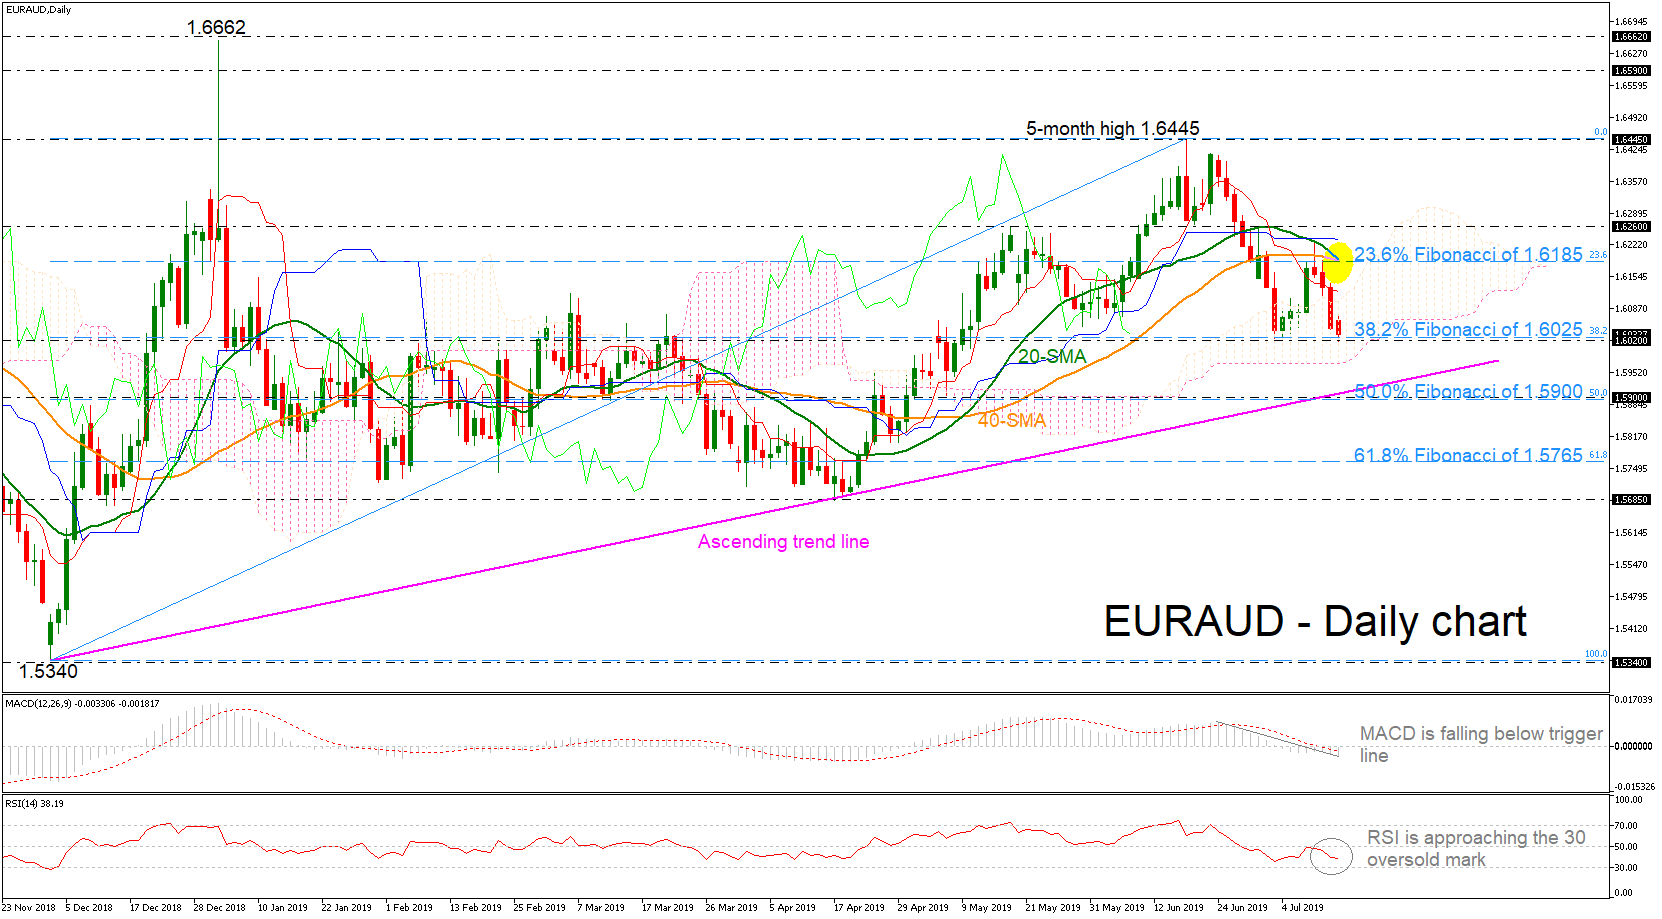
EURAUD has been underperforming in the past three days, challenging the 38.2% Fibonacci retracement level of the upward wave from 1.5340 to 1.6445 near 1.6025. The pair bounced off the 20-day simple moving average last Wednesday and is ready to complete a bearish crossover within the short-term SMAs.
Short-term momentum indicators are also pointing to a continuation of the bearish bias. However, the RSI is well below the 50-neutral level, heading towards the oversold zone, while the MACD is strengthening its negative movement. Moreover, the price has been developing within the Ichimoku cloud and may find the way to exit from it in the next few sessions.
If the pair continues the bearish move, the next level to have in mind is the long-term ascending trend line near the 50.0% Fibo of 1.5900. A penetration of this line would switch the positive tendency to neutral, hitting the 61.8% Fibonacci region of 1.5765.
Should prices reverse higher and pare previous days’ losses, they would meet resistance at the 20- and 40-SMAs, which overlaps with the 23.6% Fibo of 1.6185. A jump above this significant region would test the 1.6260 barrier ahead of the five-month high of 1.6445.
In the bigger picture, EURAUD has been trading within a rising trend line since December 2018, posting higher highs and higher lower. However, in the short-term view, the pair is likely to test the uptrend line before reversing higher again.
European Open – Flat After Chinese Data
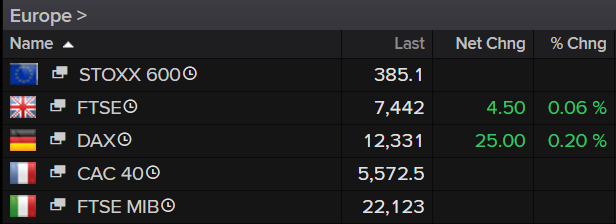
Markets flat after Chinese data
It's looking a little flat ahead of the European open on Monday, with data from China overnight offering another reminder of the damaging effects of trade wars.

China's economy grew by only 6.2% in the second quarter, its slowest rate of growth in 27 years. There's no doubt in anyone's minds that the trade war is a major contributing factor here, especially coming at a time when the economy was already in the midst of a slowdown as it transitions away from the heavy investment, export led model to a more sustainable domestically driven one.
While industrial production, fixed asset investment and, maybe more importantly, retail sales all exceeded expectations, all the focus has been on that lower growth number. Unemployment also rose slightly but this has been volatile in the past so won't be causing too much concern.
Chinese stocks staged something of a recovery as the session wore on but the trend is not their friend at the moment. Stocks throughout the rest of the region only posted small gains which hasn't offered much direction for Europe and the US, where futures are looking a little flat currently.
Currencies: Markets Await Guidance From Q2 Earnings
Rates: Small losses for bonds after solid Chinese eco data
Core bonds ended Friday on a quiet note following two days of volatility, especially on the US Treasury market. Solid Chinese eco data inflict small wounds on core bond markets this morning. The eco calendar is thin with only NY manufacturing business sentiment. The start of Q2 earnings season serves as a wildcard this week.
Currencies: Markets await guidance from Q2 earnings
EUR/USD rebounded from recent lows end of last week after Powell's soft comments were later echoed by other high profile Fed members. We expect a calm start of the week and with the Q2 earnings season looming. EUS/USD should be able to hold near current levels. EUR/GBP retreated from the 0.90 area.
The Sunrise Headlines
- US stocks ended Friday on a high note, gaining 0.45% (S&P) to 0.90% (Dow) with new all-time highs for three major benchmark indices. China outperforms this morning on solid eco data with Japan closed for Marine Day.
- Chinese industrial production (6.3% Y/Y), retail sales (9.8% Y/Y) and fixed investments (5.8% Y/Y) all beat consensus in June. Q2 GDP beat forecasts on a quarterly basis (1.6% Q/Q), matching the 6.2% Y/Y consensus.
- The leadership of the Czech Social Democratic Party will decide on whether or not to pull the plug in the ruling coalition over a dispute with the President who blocks them from replacing the culture minister with their preferred candidate.
- Acting IMF head Lipton, in an interview with the FT, backed the case for central banks to remain accommodative in light of sluggish growth and downside risks.
- US Treasury Secretary Mnuchin warned House Speaker Pelosi last Friday that the US Congress must raise the debt ceiling before leaving for Summer recess or else risking that the government runs out of cash early September.
- Reuters reports that the US may approve licenses for companies to re-start new sales to Huawei in as little in two weeks, citing a senior US official.
- Today's economic calendar contains US Empire Manufacturing July Business Sentiment. NY Fed governor Williams speaks and Citigroup kicks off Q2 earnings season.
Currencies: Markets Await Guidance From Q2 Earnings
Markets await Q2 earnings guidance
The dollar held strong during European dealings last Friday, initially eking out gains following stronger than expected US CPI the day before. The greenback staged an intraday turnaround, however, after president Trump accused China (again) of devaluing its currency. Voting Fed's Evans later reiterated the case for rate cuts after Powell paved the way to do so in July while testifying before US Congress earlier last week. EUR/USD eventually closed higher at 1.127 from 1.1254 with US/German yield spreads narrowing in favour of the couple. USD/JPY slipped from the mid 108's to below 108.
2019Q2 Chinese growth fell to the lowest on record (6.2% YoY). The quarterly dynamics (1.6% QoQ) and the monthly data batch (June retail sales, industrial production) are showing signs of bottoming out/acceleration however. It causes Chinese stocks to outperform. The yuan is little changed. EUR/USD is trading sideways, USD/JPY forces out a return above 108 amid low volume trading (Japan closed).
The week starts off calmly with only the US Empire Manufacturing index scheduled for release. A pick-up to 2 is expected from June's slump (-8.6). We see risks for a positive surprise following the G20 trade truce renewal but with little impact on monetary policy expectations. This weeks also marks the start of the 2019Q2 earnings season. Citigroup kicks off today but the large string of results isn't due until tomorrow (J&J, JPMorgan, GS …). With consolidation in core bond yields expected, we assume subdued EUR/USD trading ahead of the earnings season.
EUR/USD drifted lower in the 1.11/1.14 range, but rebounded from recent lows after Powell paving the way for a July rate cut. A rebound to the 1.13 would further ease the downside momentum. But with the most important eco data before the FOMC July meeting printed, we expect little inspired trading going forward.
EUR/GBP retreated from its recent highs at 0.90 end of last week during a mostly technically driven session. Markets await the outcome of the UK Tory race (July 23th) and what it could mean for Brexit. Although sterling recovered somewhat over the past few days, the political uncertainty, signs of a further cooling of the UK economy and technical factors continue to conspire against the currency. We don't expect any sustained sterling rebound anytime soon
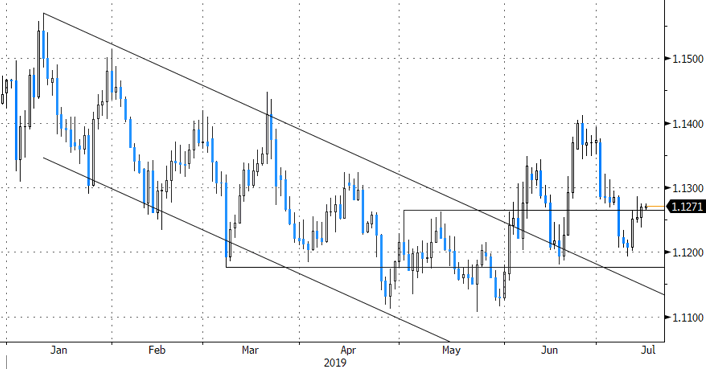
EUR/USD rebounded from recent lows after Powell paved the way for a July rate cut.
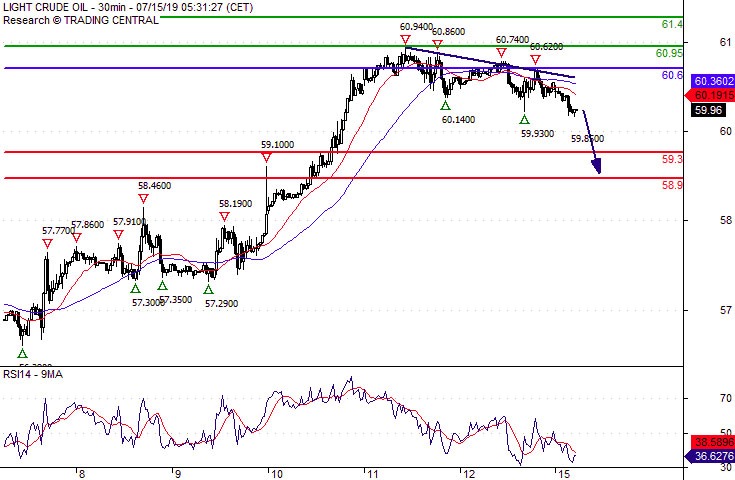
Crude Oil Aim @ 58.90
Pivot (invalidation): 60.60
Our preference Short positions below 60.60 with targets at 59.30 & 58.90 in extension.
Alternative scenario Above 60.60 look for further upside with 60.95 & 61.40 as targets.
Comment The RSI is bearish and calls for further decline.
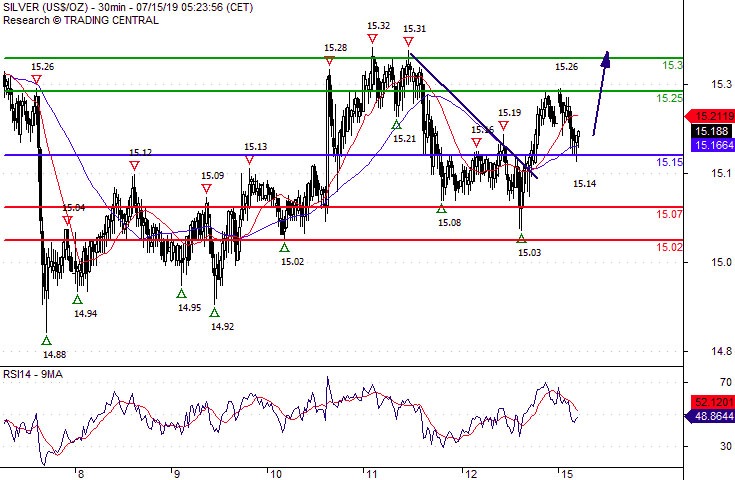
Silver Spot Bullish Bias Above 15.1500
Pivot (invalidation): 15.1500
Our preference Long positions above 15.1500 with targets at 15.2500 & 15.3000 in extension.
Alternative scenario Below 15.1500 look for further downside with 15.0700 & 15.0200 as targets.
Comment The RSI is mixed and calls for caution.
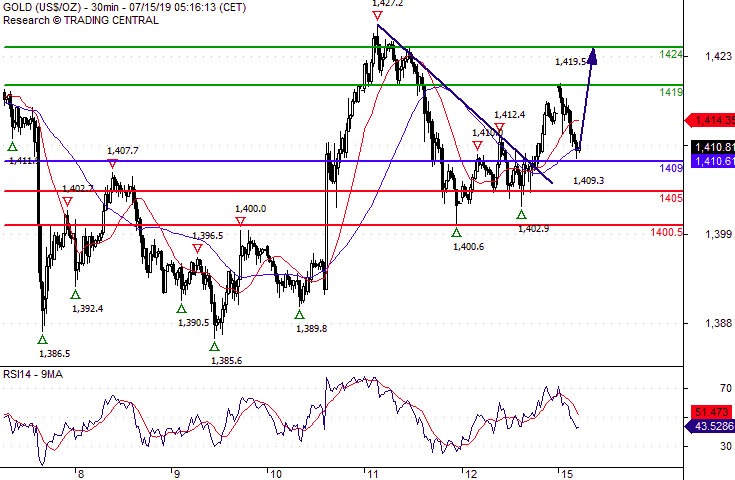
Gold Spot Caution
Pivot (invalidation): 1409.00
Our preference Long positions above 1409.00 with targets at 1419.00 & 1424.00 in extension.
Alternative scenario Below 1409.00 look for further downside with 1405.00 & 1400.50 as targets.
Comment Intraday technical indicators are mixed and call for caution.
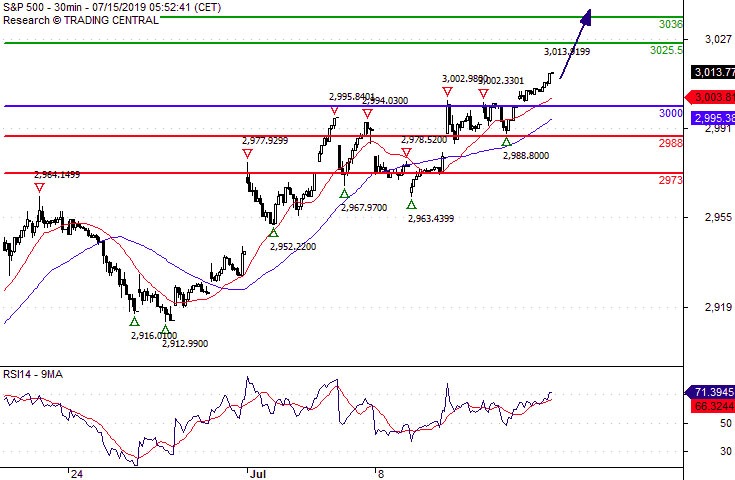
S&P 500 Watch 3036.00
Pivot (invalidation): 3000.00
Our preference Long positions above 3000.00 with targets at 3025.50 & 3036.00 in extension.
Alternative scenario Below 3000.00 look for further downside with 2988.00 & 2973.00 as targets.
Comment The RSI is bullish and calls for further upside.
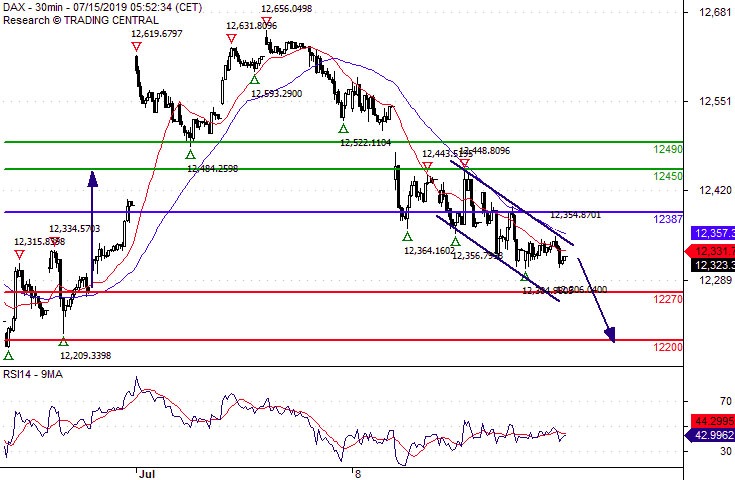
DAX The Downside Prevails
Pivot (invalidation): 12387.00
Our preference Short positions below 12387.00 with targets at 12270.00 & 12200.00 in extension.
Alternative scenario Above 12387.00 look for further upside with 12450.00 & 12490.00 as targets.
Comment The RSI is bearish and calls for further downside.