Sample Category Title
EURUSD Important Week Ahead
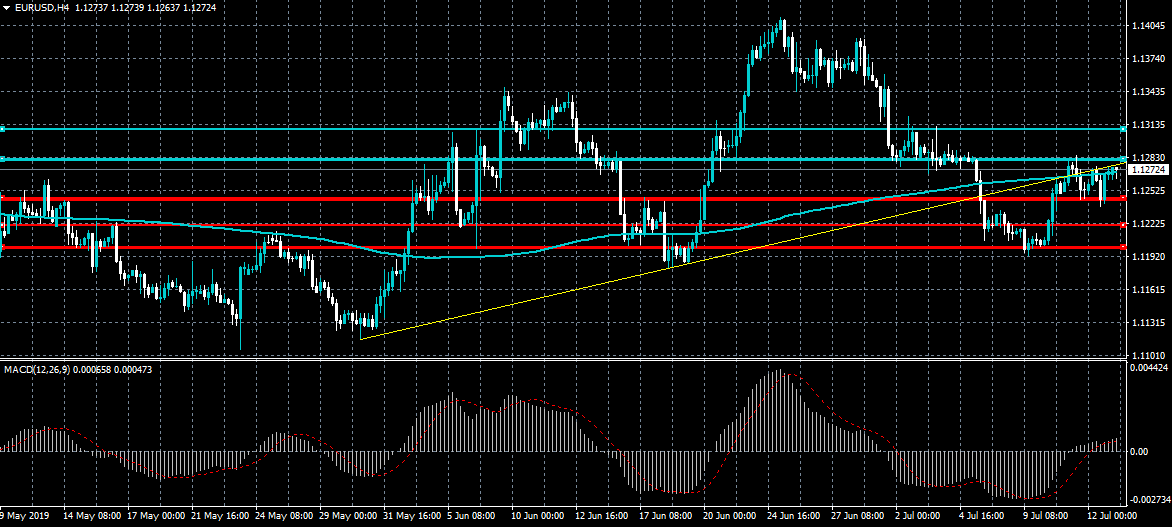
The euro currency is once again edging higher against the US dollar in early Monday as the technical recover from the current monthly low continues. The EURUSD faces an important week ahead as the trading range for the pair continues to narrow, pointing to a possible technical breakout. Bulls need to clearly break the 1.1310 resistance level, while sellers need to hold price under the 1.1200 level.
The EURUSD pair is only bullish while trading above the 1.1248 level, key technical resistance is found at the 1.1280 and 1.1310 levels.
If the EURUSD pair trades below the 1.1248 level, key support is found at the 1.1220 and 1.1200 levels.
GBPUSD 1.2610 Now Key
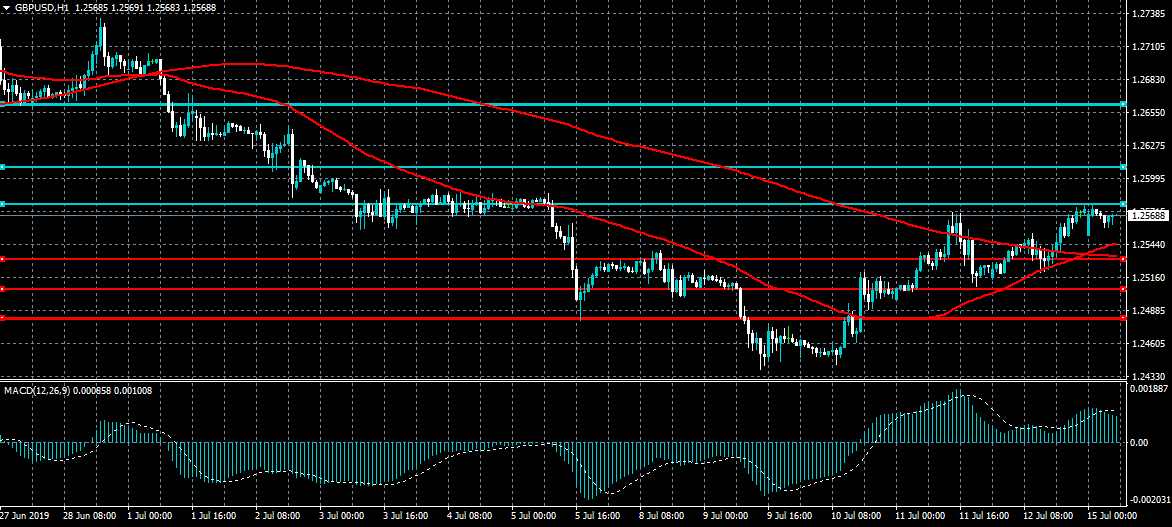
The British pound has opened the new trading week on solid footing against the US dollar, following a strong weekly price around the 1.2570 level. GBPUSD bulls need to advance the pair above the 1.2610 level to encourage a test of the key 1.2660 area. Sustained weakness below the 1.2530 level may start to trouble the GBPUSD pair, placing the emphasis back on the 1.2505 level.
The GBPUSD pair is bullish while trading above the 1.2550 level, key resistance is found at the 1.2610 and 1.2660 levels.
If the GBPUSD trades below the 1.2550 level, key support is located at the 1.2530 and 1.2505 levels.
EUR/GBP Daily Outlook
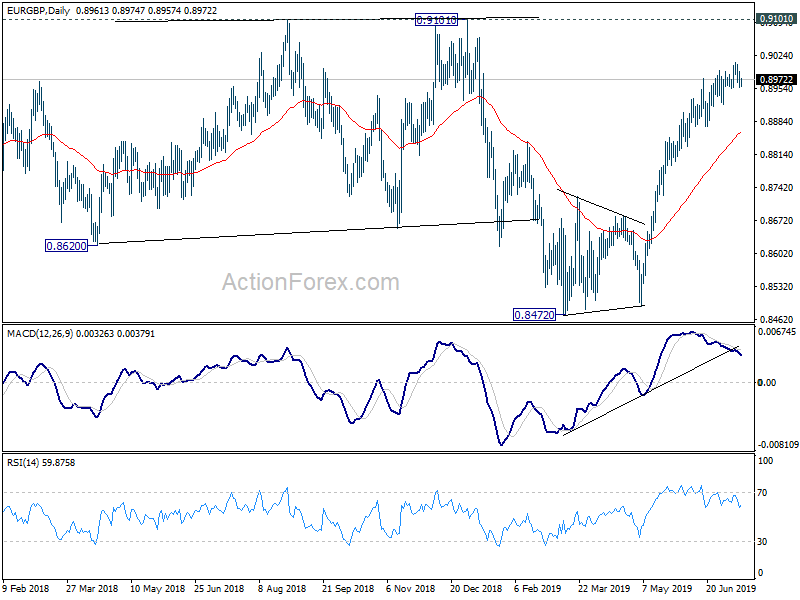
Daily Pivots: (S1) 0.8948; (P) 0.8970; (R1) 0.8983; More...
Intraday bias in EUR/GBP remains neutral for the moment. With 0.8954 minor support intact, another rise cannot be ruled out yet. . But we'd look for topping signal as it approaches 0.9101 key resistance. On the downside, break of 0.8954 support will indicate short term topping. In this case, deeper pull back could be seen to 55 day EMA (now at 0.8858) first.
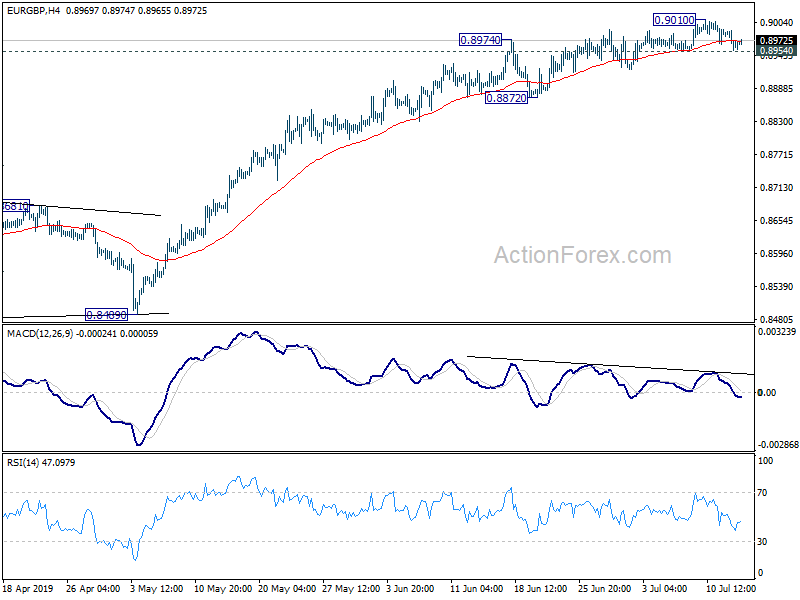
In the bigger picture, medium term decline from 0.9305 (2017 high) is seen as a corrective move. No change in this view. Current development argues that it might have completed with three waves down to 0.8472, just ahead of 38.2% retracement of 0.6935 (2015 low) to 0.9306 at 0.8400, after hitting 55 month EMA (now at 0.8545). Decisive break of 0.9101 resistance will confirm this bullish case. Nevertheless, as EUR/GBP is still staying inside long term falling channel, correction from 0.9305 could still extend to 0.8400 fibonacci level before completion, if upside is rejected by 0.9101.
Chinese Stocks Rise Despite Ongoing Trade War
Chinese stocks rose even as data from China supported the economy's weakening. Data from the statistics office showed that the GDP slowed in the second quarter to 6.2%. This was in line with expectations. In the first quarter, the economy grew by 6.4%. The quarterly growth was the slowest in more than 27 years and is evidence that the ongoing trade spat with the US is hurting. On a QoQ basis, the economy expanded by 1.6%, which was better than the expected 1.5%. Retail sales increased by a YOY rate of 9.8% while the industrial production rose by 6.3%. Fixed asset investments increased by 5.8% in June.
The price of crude oil was relatively unchanged in early trading as Iran and the United Kingdom initiated diplomacy measures to ease tensions. This happened after a British oil tanker was attacked by Iranian boats at the Strait of Hormuz. The attackers were dispersed by a British warship that was escorting the tanker. Over the weekend, top diplomats of the two countries made calls to demonstrate how both sides wanted to further discuss the crisis. In a tweet, Jeremy Hunt offered to return an Iranian tanker it captured two weeks ago if Iran promised that it won't go to Syria.
With no major economic data expected today, investors will be focusing on the upcoming earning season, which will start tomorrow when big banks like Citi and JP Morgan release their earnings. Other key economic data investors will focus on are the CPI data from New Zealand, UK employment data, retail sales data from the US, and Italian CPI data, which will be released tomorrow.
EUR/USD
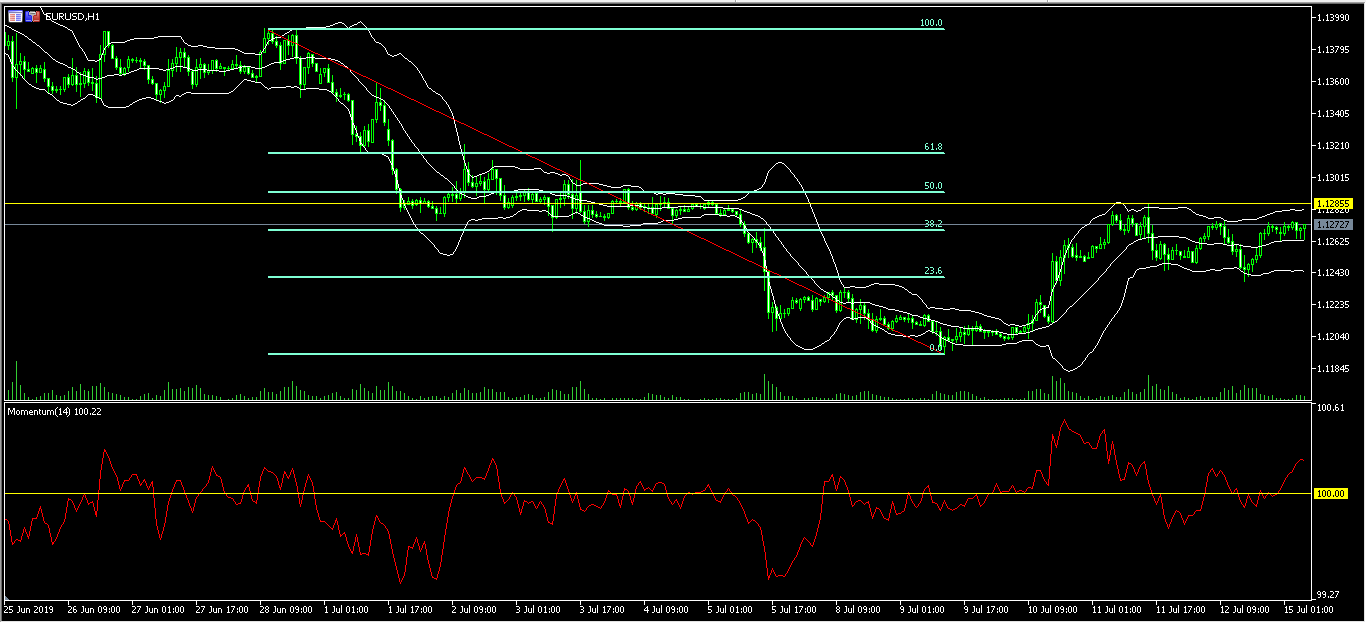
The EUR/USD pair was relatively unmoved in early trading. It is now trading at 1.1272, which is slightly below last week's high of 1.1285 and higher than last week's low of 1.1192. On the hourly chart below, this price is slightly higher than the middle line of the Bollinger Bands. It is also along the 38.2% Fibonacci Retracement level while the momentum indicator is above the 100 level mark. The pair will likely continue moving higher to test the 50% Fibonacci Retracement level of 1.3000.
AUD/USD
The AUD/USD pair moved higher in morning trading after the Chinese economic data was released. The pair reached a high of 0.7035, which is above the 25-day and 50-day moving averages. The pair's RSI has moved to above the overbought level of 70 while the accumulation/distribution indicator has continued to soar. The pair will likely continue moving higher, to test the important support level of 0.7045.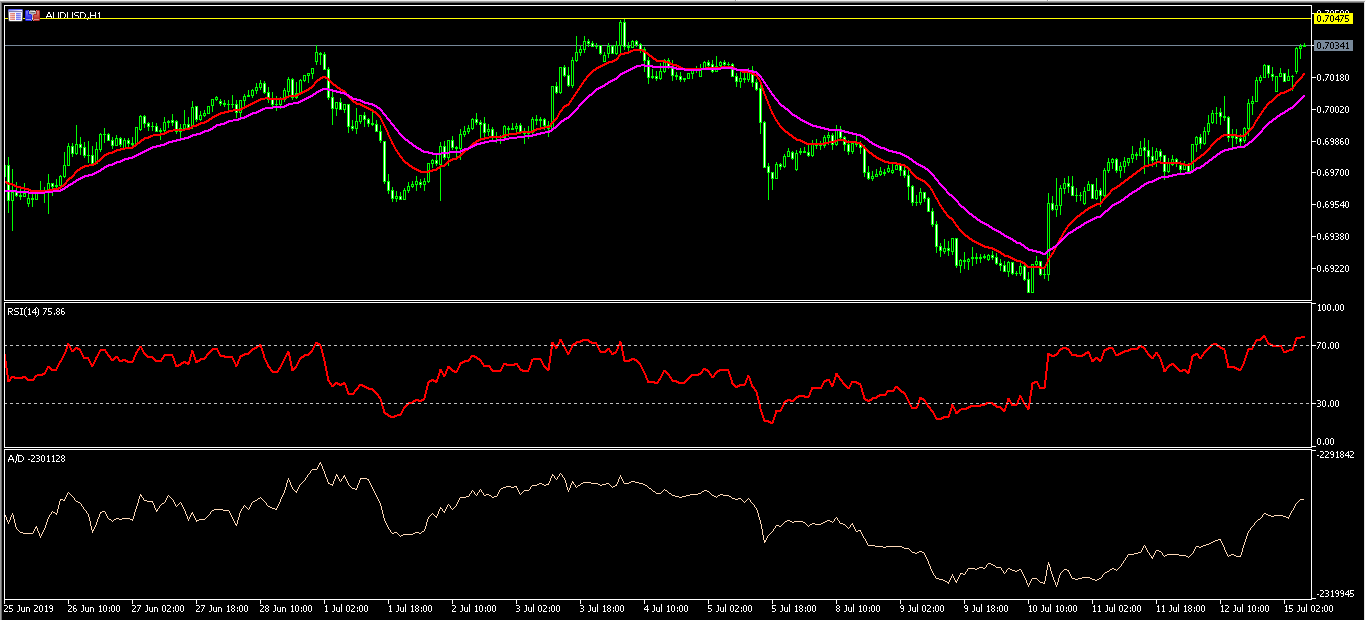
XBR/USD
The XBR/USD pair was little moved as traders follow UK/Iran tensions. The pair is trading at 66.34, which is slightly below Friday's high of 67.35. On the four-hour chart, this price is slightly above the 50% Fibonacci Retracement level. The price is also along the middle line of the Bollinger Bands. The RSI has moved slightly lower from a high of 78 to the current 57. The pair will likely breakout in either direction depending on the upcoming inventories data from the US.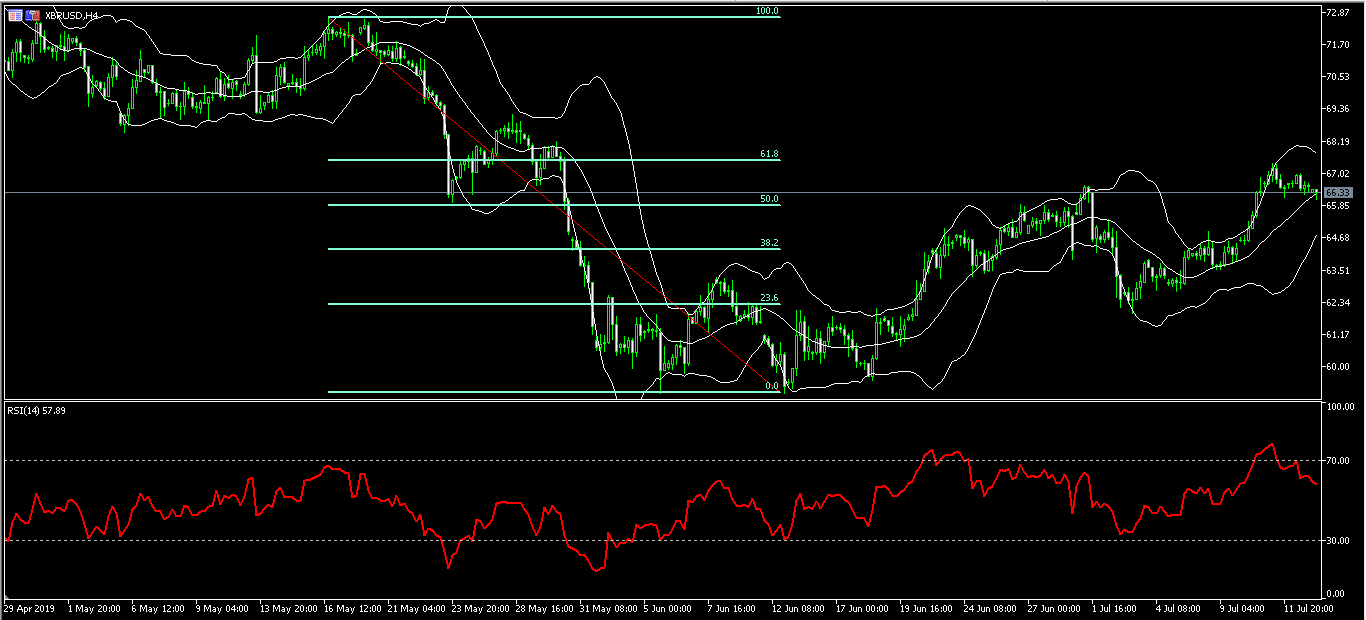
EUR/AUD Daily Outlook
Daily Pivots: (S1) 1.6018; (P) 1.6081; (R1) 1.6116; More...
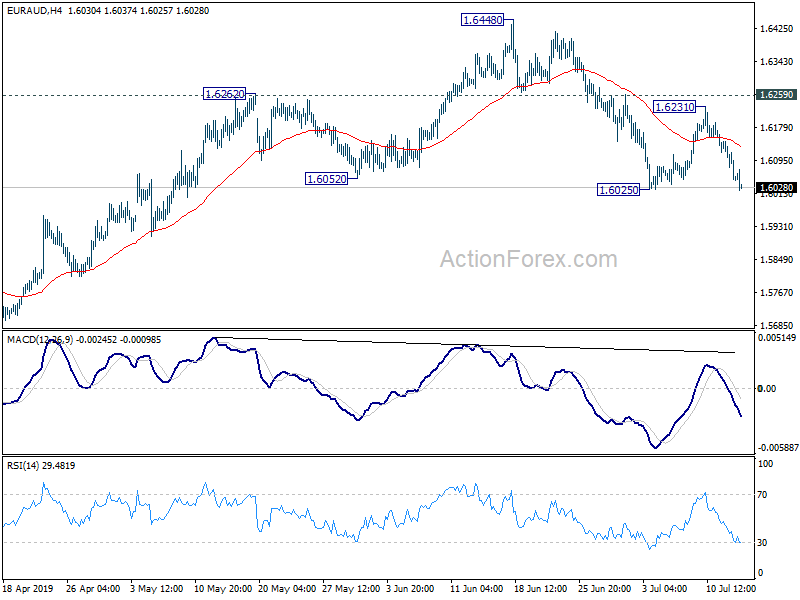
Focus is now on 1.6025 support in EUR/AUD. Firm break will resume the decline from 1.6448. Such decline is seen as the third leg of the consolidation pattern from 1.6765 high. Next target will be 1.5683 support and below. In any case, near term outlook will remain mildly bearish as long as 1.6259 resistance holds, in case of recovery.
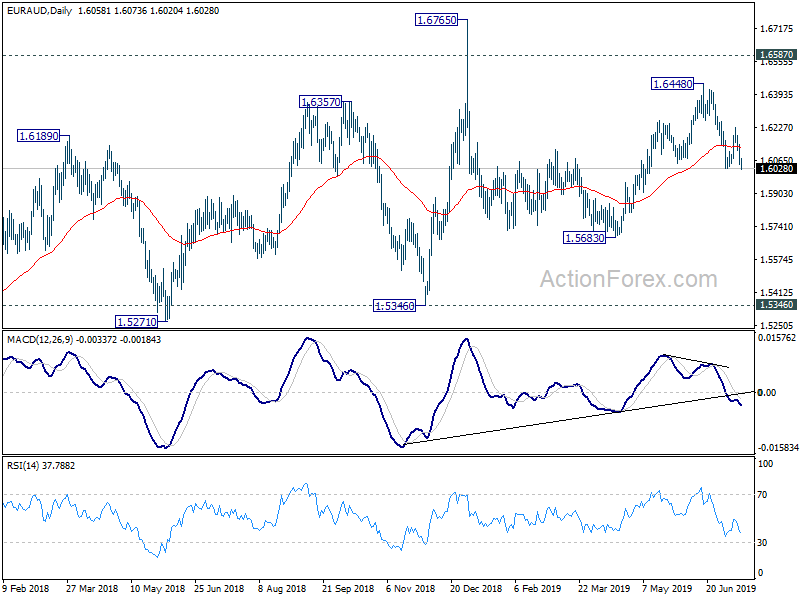
In the bigger picture, as long as 1.5346 support holds, outlook will still remain bullish. Up trend from 1.1602 (2012 low) is expected to resume sooner or later. Break of 1.6765 will target 61.8% retracement of 2.1127 (2008 high) to 1.1602 at 1.7488 next. However, firm break of 1.5346 key support will indicate trend reversal and turn outlook bearish.
EUR/CHF Daily Outlook
Daily Pivots: (S1) 1.1058; (P) 1.1107; (R1) 1.1141; More...
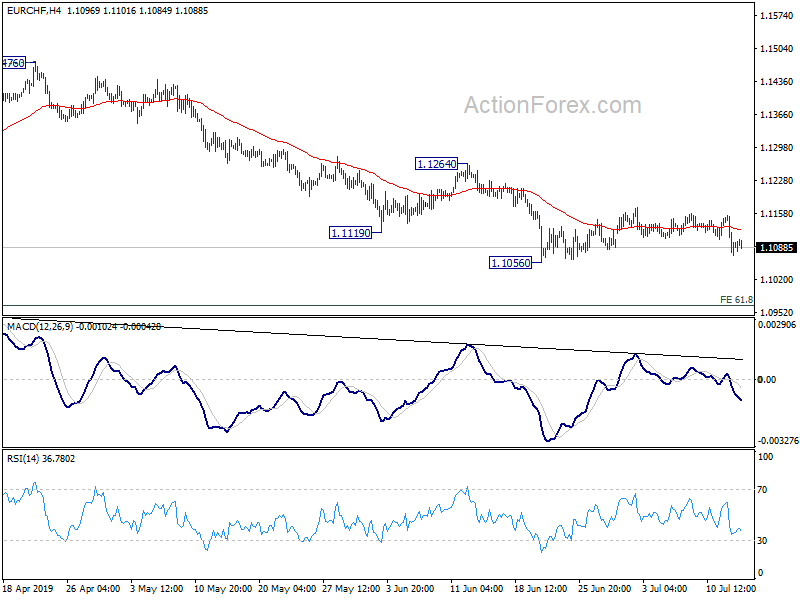
Intraday bias in EUR/CHF remains neutral as it's staying in range above 1.1056. More sideway trading could be seen. In case of another recovery, upside should be limited below 1.1264 resistance to bring fall resumption. On the downside, break of 1.1056 will extend the larger down trend for 61.8% projection of 1.2004 to 1.1173 from 1.1476 at 1.0962 next.
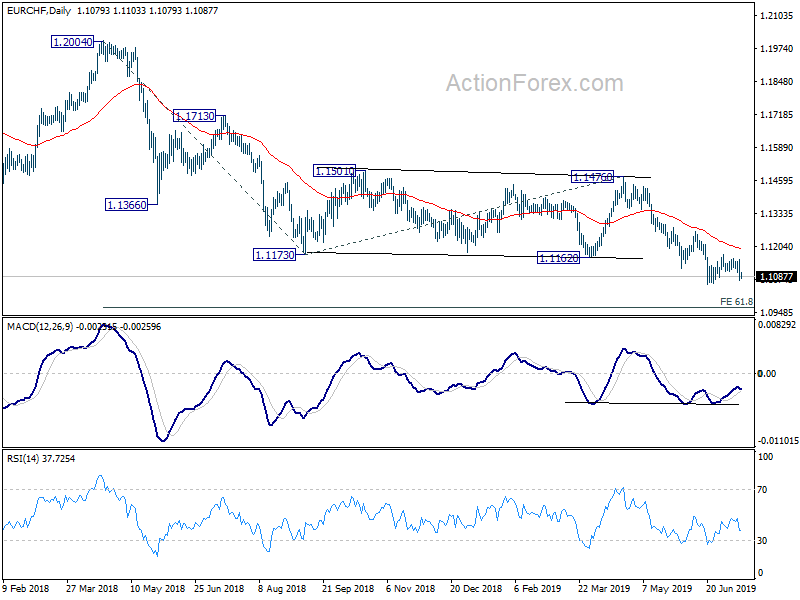
In the bigger picture, current development firstly suggests that down trend from 1.2004 is still in progress. More importantly, it's likely a long term down trend itself, rather than a correction. Outlook will remain bearish as long as 1.1476 resistance holds. EUR/CHF could target 1.0629 support and below.
EUR/USD Daily Outlook
Daily Pivots: (S1) 1.1248; (P) 1.1261; (R1) 1.1285; More...
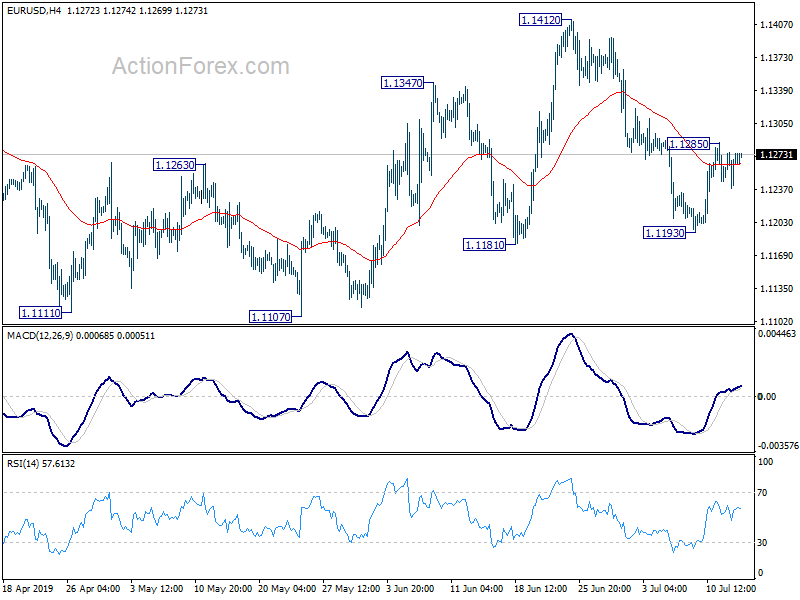
Intraday bias in EUR/USD remains neutral at this point but further rise is mildly in favor. On the upside, above 1.1285 will extend the rise from 1.1193 to 1.1412 resistance next. On the downside, below 1.1193 will resume the fall from 1.1412 to retest 1.1107 low.
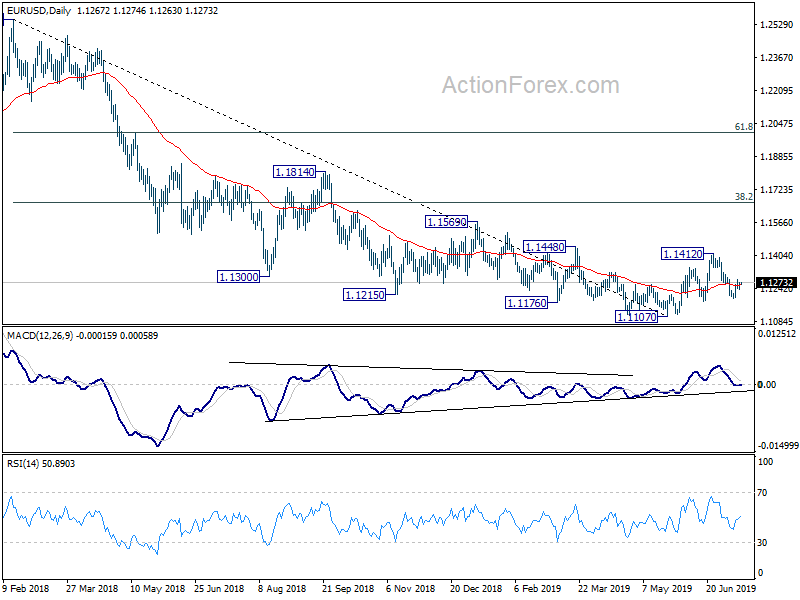
In the bigger picture, bullish convergence condition in daily and weekly MACD suggests that 1.1107 is a medium term bottom. However, rejection by 55 EMA retains medium term bearish. Outlook will be neutral for now. On the downside, break of 1.1107 will resume the down trend from 1.2555 (2018 high) to 78.6% retracement of 1.0339 to 1.2555 at 1.0813. Meanwhile, break of 1.1412 will resume the rebound to 38.2% retracement of 1.2555 to 1.1107 at 1.1660.
GBP/USD Daily Outlook
Daily Pivots: (S1) 1.2536; (P) 1.2558; (R1) 1.2596; More....
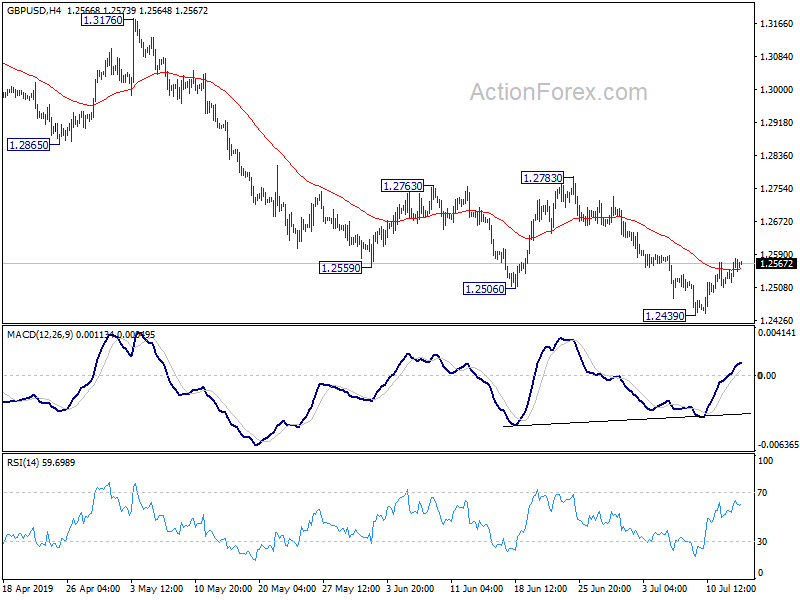
Intraday bias in GBP/USD remains neutral for the moment. Consolidation from 1.2439 might extend with stronger recovery. But upside should be limited below 1.2783 resistance to bring fall resumption. On the downside, break of 1.2439 would resume the decline from 1.3381 to retest 1.2391 low. Firm break there will resume larger down trend.
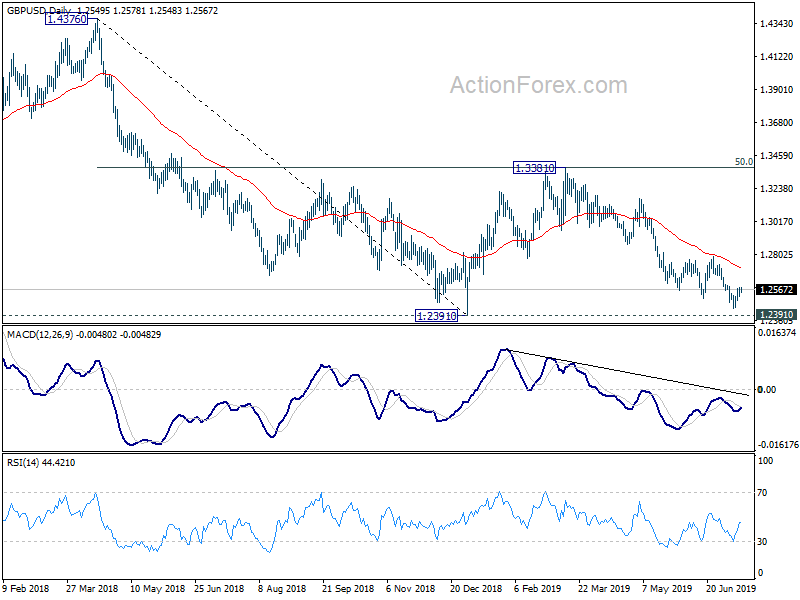
In the bigger picture, down trend from 1.4376 (2018 high) is still in progress. Break of 1.2391 would target a test on 1.1946 long term bottom (2016 low). For now, we don't expect a firm break there yet. Hence, focus will be on bottoming signal as it approaches 1.1946. In any case, medium term outlook will stay bearish as long as 1.3381 resistance holds, in case of strong rebound.
USD/CHF Daily Outlook
Daily Pivots: (S1) 0.9816; (P) 0.9862; (R1) 0.9888; More...
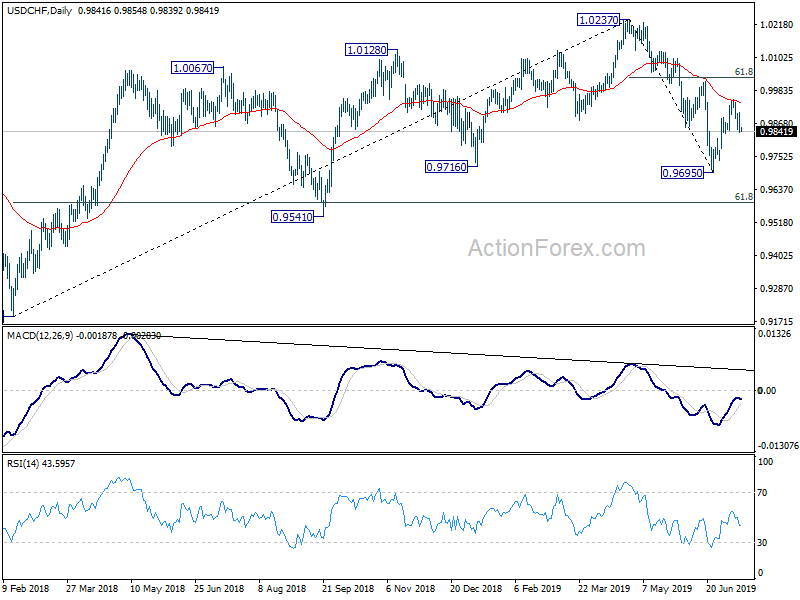
USD/CHF's correction rebound from 0.9695 should have completed at 0.9951, after rejection by 55 day EMA. Deeper fall should be seen back to retest 0.9695 low first. On the upside, above 0.9951 will extend the rebound from 0.9695. In that case, upside should be limited by 61.8% retracement of 1.0237 to 0.9695 at 1.0030.
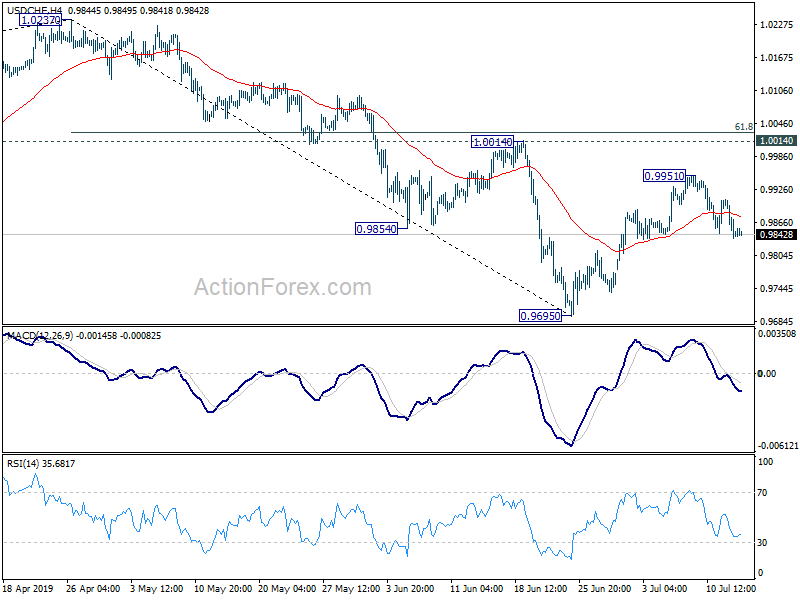
In the bigger picture, up trend from 0.9186 (2018 low) should have completed at 1.0237 already. Deeper decline would be seen to 61.8% retracement of 0.9186 to 1.0237 at 0.9587 and below. For now, USD/CHF is seen as in long term range pattern between 0.9186 and 1.0342. Hence, we'd pay attention to bottoming signal below 0.9587. However, sustained break of 1.0014 will revive medium term bullishness and turn focus back to 1.0237 high.
USD/JPY Daily Outlook
Daily Pivots: (S1) 107.60; (P) 108.11; (R1) 108.40; More...
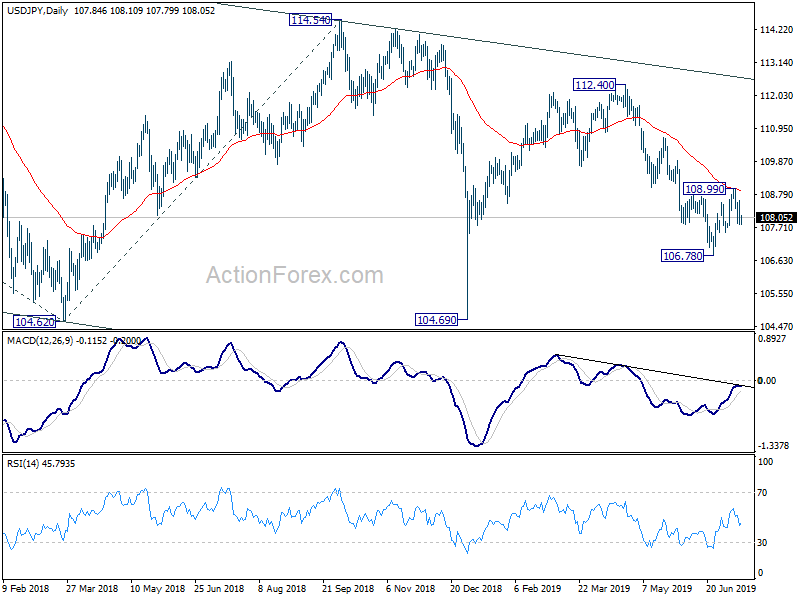
As noted before, corrective rebound from 107.54 should have completed at 108.99, after rejection by 55 day EMA. Further fall should be seen and break of 107.53 support will likely send USD/JPY through 106.78 to resume the decline from 112.40. For now, near term outlook will remain bearish as long as 108.99 resistance holds.
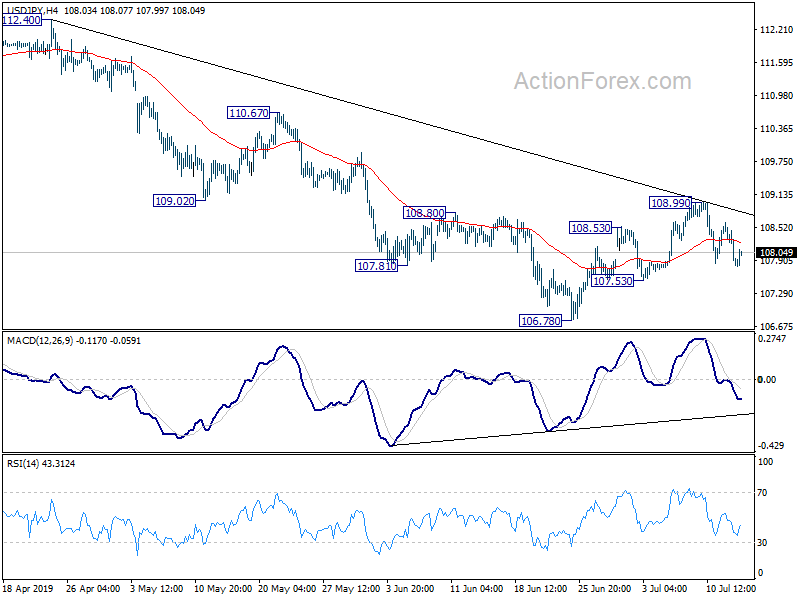
In the bigger picture, decline from 118.65 (Dec 2016) is still in progress, with the pair staying inside long term falling channel. Break of 104.62 will target 100% projection of 118.65 to 104.62 from 114.54 at 100.51. For now, we'd expect strong support above 98.97 (2016 low) to contain downside to bring rebound. In any case, break of 112.40 is needed to the first serious sign of medium term bullishness. Otherwise, further decline will remain in favor in case of rebound.