Sample Category Title
EUR/USD Likely To Face Hurdles Near 1.1300
Key Highlights
- The Euro started a decent rebound from 1.1200 against the US Dollar.
- EUR/USD is facing a significant resistance near 1.1300 and a bearish trend line on the 4-hours.
- The Euro Area Industrial Production in May 2019 increased 0.9% (MoM), better than the +0.2% market forecast.
- The NY Empire State Manufacturing Index in July 2019 might rise from -8.6 to 0.5.
EURUSD Technical Analysis
After a downside extension below 1.1250 support, the Euro found support near 1.1200 against the US Dollar. The EUR/USD pair started a decent rebound above 1.1220, but it is facing many hurdles on the upside.
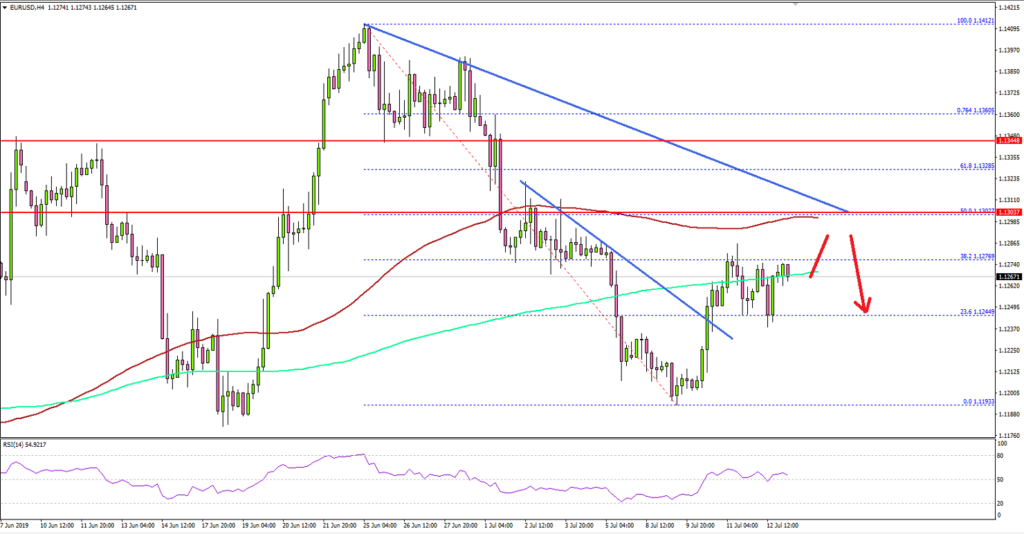
Looking at the 4-hours chart, the pair traded as low as 1.1193 and later recovered above the 1.1220 and 1.1240 resistance levels. Besides, there was a break above a connecting bearish trend line at 1.1245.
It opened the doors for more gains above 1.1250 plus the 23.6% Fib retracement level of the slide from the 1.1412 high to 1.1193 low. However, the pair is now facing a significant resistance near 1.1300 and the 100 simple moving average (red, 4-hours).
Moreover, the 50% Fib retracement level of the slide from the 1.1412 high to 1.1193 low is also near the 1.1302 level. Finally, there is a key bearish trend line forming with current resistance near 1.1310 on the same chart.
Therefore, the 1.1300 and 1.1310 levels are likely to act as major hurdles for the bulls. If there is no upside break above 1.1300 or 1.1310, the pair could decline once again.
An immediate support is near the 1.1240 level, below which the pair could revisit the 1.1200 support area in the near term.
Fundamentally, the Euro Area Industrial Production for May 2019 was released by the Eurostat. The market was looking for a 0.2% rise in the production compared with the previous month.
The actual result was above the market forecast, as there was a 0.9% rise in the production. Moreover, the last month’s reading was revised up from -0.5% to -0.4%. Looking at the yearly change, there was a decrease of 0.5%, better than the market forecast of -1.6%.
The report added:
In the euro area in May 2019, compared with April 2019, production of non-durable consumer goods rose by 2.7%, durable consumer goods by 2.3%, capital goods by 1.3% and energy by 0.7%, while production of intermediate goods fell by 0.2%.
Overall, EUR/USD recovered nicely above 1.1250, but it is likely to struggle to continue above the 1.1300 resistance area in the coming sessions. Similarly, GBP/USD is approaching towards the key 1.2600-1.2620 resistance area.
Economic Releases to Watch Today
- Swiss PPI for June 2019 (YoY) – Forecast -0.9%, versus -0.8% previous.
- NY Empire State Manufacturing Index for July 2019 – Forecast 0.5, versus -8.6 previous.
Daily Markets Broadcast
Wall Street tops record levels
US indices powered ahead on Friday, reaching new record highs in most cases, with expectations for a Fed rate cut this month still high despite hotter inflation data last week. China releases Q2 GDP data today. Japan markets are closed for a public holiday.
US30USD Daily Chart
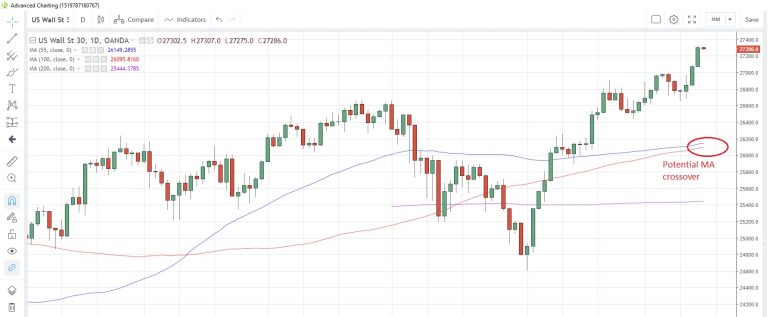
The US30 index advanced for a third straight day Friday, posting the biggest daily gain in three weeks
The 100-day moving average at 26,095 and the 55-day average at 26,149 are gradually converging and could crossover by the end of the month
US producer prices rose more than expected in June, posting a 0.1% m/m and 1.7% y/y increase, which echoed the slightly firmer consumer price indices that were released earlier in the week. There are no major data releases scheduled for today.
DE30EUR Daily Chart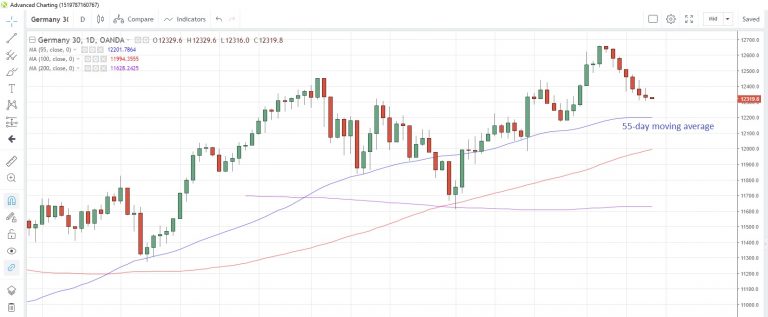
The Germany30 index fell for a seventh straight day yesterday, equaling the longest losing streak since October last year, despite better-than-expected economic data
The index touched the lowest in two weeks and is gravitating toward the 55-day moving average at 12,201
Euro-zone industrial production rose 0.9% m/m in May, beating estimates of a 0.2% gain. There are no major economic data releases scheduled for today.
CN50USD Daily Chart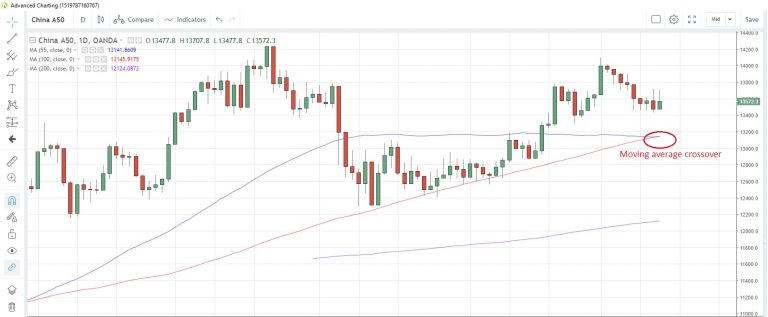
The China50 index rebounded from two-week lows on Friday, buoyed by the positive sentiment on Wall Street
The 55-day moving average at 13,142 moved below the 100-day moving average at 13,146 for the first time since February 26. This is often interpreted as a medium-term bearish signal
The Chinese economy probably grew 6.2% y/y in the second quarter, according to the latest survey of economists, slower than Q1’s 6.4% expansion. An even lower number would increase pressure on the authorities to introduce larger stimulus measures for the economy to combat the weakening impact of the trade war with the US.
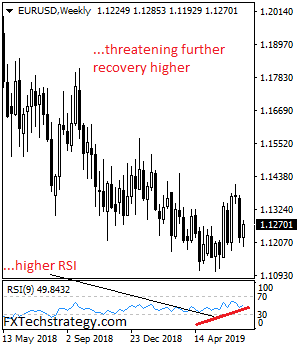
EURUSD Eyes Further Recovery Short Term
As it looks to extend gain in the new week. Support comes in at the 1.1200 where a violation will turn risk to the 1.1150 level. A break below here will target the 1.1100 level. Further down, support sits at the 1.1050. Conversely, on the upside, resistance resides at 1.1300 level with a break through there opening the door for further upside towards the 1.1.1350 level. Further up, resistance comes in at the 1.1400 level where a violation will expose the 1.1450 level. All in all, EURUSD expects more recovery to occur in the days ahead.
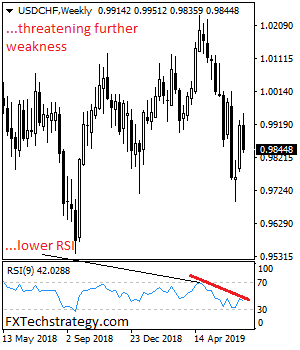
USDCHF Bear Pressure Set To Extend Lower
USDCHF bear pressure set to extend lower in the new week. Resistance resides at the 0.9900 level. Above here, resistance lies at the 0.9950 level and then the 1.0000 level. Further out, resistance comes in at the 1.0050 level. On the downside, support is seen at the 0.9800 level with a turn below here opening the door for more decline towards the 0.9750 level. And then the 0.9700 level. Further down, support resides at the 0.9650 level. Its weekly RSI is bearish and pointing lower suggesting further weakness. All in all, USDCHF remains biased to the downside on further weakness.
Eco Data 7/15/19
[php_everywhere instance="1"]
Forex Forecast and Cryptocurrencies Forecast
First, a review of last week’s events:
EUR/USD. Recall that 60% of experts named the zone 1.1100-1.1185 as a local bottom. As for the remaining 40%, in their opinion, support 1.1185 should have become an insurmountable obstacle, after which analysts had expected the pair to return to {1level 1.1275-1.1320. That's exactly what happened: the bottom was fixed at 1.1190, after which the pair turned around and went up, reaching the height of 1.1285 at the maximum. Then there was a bounce, and the pair completed the five-day week at the Pivot Point level of the first half of summer,1.1270;
GBP/USD. The line graph of the pair on D1 resembles a parabola, which, in general, reflects the two main forecasts of experts. 40% of them expected the pair to fall to the lows of December 2018 - January 2019, and it dropped to 1.2438. And then, as other analysts expected, the pair headed north, where it was stopped by resistance 1.2575;
USD/JPY. 40% of analysts hoped that the pair would be able to overcome the resistance of 108.80 and rise to the level 109.00-109.60. It seemed that this forecast was about to come true. However, the pair did not manage to touch the horizon of 109.00: not gaining just a couple of points, it collapsed down and returned to the strong support of June-July 2019 in the zone 107.85;
Cryptocurrencies. Bitcoin's extremely high volatility continues to keep investors and traders in constant tension, since fluctuations of 10-15-20% can not only enrich, but also ruin anyone in a short time. The reason, first of all, is the thin market. It is so thin that any fixation of profits by a major player, any more or less loud news, causes serious jumps in the rate.
For example, the statement by Fed Chairman Jerome Powell that Facebook should not be allow ed to launch its Libra cryptocurrency until the company settles all issues with regulatory authorities, turned the BTC/USD quotes down by 15% on Wednesday. Although it would seem, bitcoin should only be better in the absence of such a powerful competitor as Libra. As a result, the upward trend of the beginning of the week was interrupted and the pair returned to July 7 values in the $11,000-11,850 zone.
The stress tolerance of altcoins was significantly lower than that of the basic cryptocurrency. So, Ethereum (ETH/USD) lost 7% in seven days, Ripple (XRP/USD) lost 11%, and Litecoin (LTC/USD) lost 13%.
As for the forecast for the coming week, summarizing the opinions of a number of analysts, as well as forecasts made on the basis of a variety of methods of technical and graphical analysis, we can say the following:
EUR/USD. The markets continue to be ruled by expectations of a coming decline in interest rates by the US Federal Reserve and easing of the ECB’s monetary policy. In whose direction, the euro or the dollar, will the scale swing?
There is a high risk of slowing economic growth noted in the latest protocol of the European regulator. And if the situation does not improve in the near future (and why should it improve?), The ECB is ready to lower interest rates and increase bond purchases under the QE program. It is not necessary that this will be announced on July 25, however, the ECB meeting scheduled for this day should nevertheless bring some clarity.
It is possible that the issue of monetary policy easing, but this time in the United States, will also be addressed by Fed Chairman Jerome Powell, who will speak on Tuesday, July 16 at a conference in Paris. He will read a report on the features of monetary policy in the post-crisis era there, and the tonality of this report can have a strong influence on the dollar rate.
Another important event that could affect the dollar pairs will be the publication of data on the growth rate of China's GDP for the 2nd quarter of 2019. This will take place on Monday, July 15, and many experts expect a rather strong slowdown in the economic growth of the Middle Kingdom, which can provide serious support to the US currency.
As for trend indicators and oscillators, they are in antiphase on H4 and D1: if most of them are green in H4, the picture is the opposite on the day time frame.
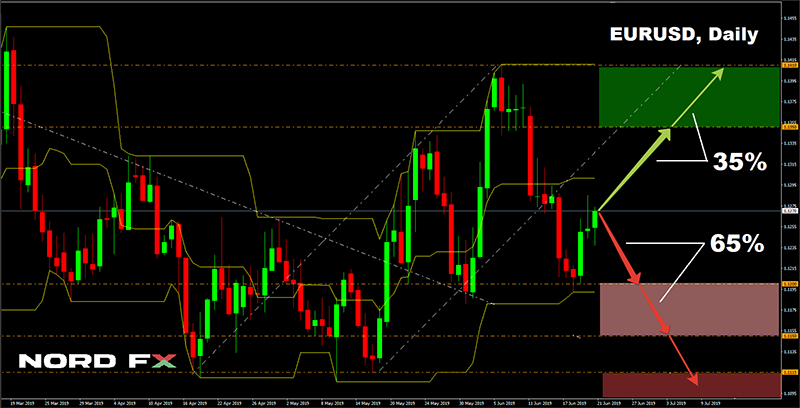
The forecasts of the majority (65%) of experts are also painted red, they expect further strengthening of the dollar and the slide of the pair to the zone of 1.1150-1.1200. The next target of the bears is the zone 1.1100-1.1115. As for the bulls, they see their goal in raising the pair to tier 1.1350-1.1410;
GBP/USD. Statistics on the labor market, wage growth rates and unemployment rates in the UK will be published on Tuesday, July 16. And on Wednesday, July 17, we will know the data on inflation. But experts expect no surprises from either of them.
At the moment, 60% of analysts, supported by graphical analysis and most of the indicators on D1, expect the pound to test support 1.2440 again and, if successful, drop to the low of January 3, 2019 at the level of 1.2405.
The remaining 40% of experts advise to open positions on the buy. There are two main arguments: the increase in the spread of government bonds profitability in the UK and the USA, and the rising oil prices. Both of these factors should push the pound up.The nearest resistance is 1.2755, the next is 1.2825;
USD / JPY. It is known that this pair has a strong correlation with the US stock market, and on the eve of the Dow Jones Industrial Average - for the first time in history! - Overcame the mark of 27.000 and reached last Friday the mark of 27.330. The pair may show growth to the 108.50-109.00 zone against this background. The next target is 109.65. However, only 30% of analysts voted for such a scenario. The majority of experts (70%), with the support of 90% of trend indicators on D1, expect the pair to decline to June lows around 106.75-107.00.
As for the graphical analysis on D1, it draws the lateral movement of the pair in the channel 107.70-109.00 with the predominance of bullish moods;
Cryptocurrencies. If on H4 and D1 time frames we observe lateral movement of the BTC/USD pair with gradual consolidation around $ 11,500-12,000 for the third week, the picture looks much more optimistic on W1 and MN: the uptrend is in full swing.
Positive predictions are made by many experts. For example, it was for the first time that the American rating agency Weiss Ratings assigned A-grade to Bitcoin, stressing that at the moment the potential benefits of investing in the first cryptocurrency exceed the risks. And Morgan Creek Capital Management CEO Mark Yusko suggested that the current market cycle could raise the price of Bitcoin to a new historical high of $30,000. Bitcoin mining is also growing. Researchers at Cambridge University have shown that today this process consumes more electricity than such countries as Switzerland or Kuwait. However, no one can predict yet at what point a new jump will occur, and experts' forecasts for the upcoming week do not go beyond the range of $9,725-13,765.
EUR/USD Weekly Outlook
EUR/USD edged lower to 1.1193 last week but bottomed ahead of 1.1181 support and recovered. Initial bias remains neutral this week first. On the upside, above 1.1285 will extend the rise from 1.1193 to 1.1412 resistance next. On the downside, below 1.1193 will resume the fall from 1.1412 to retest 1.1107 low.
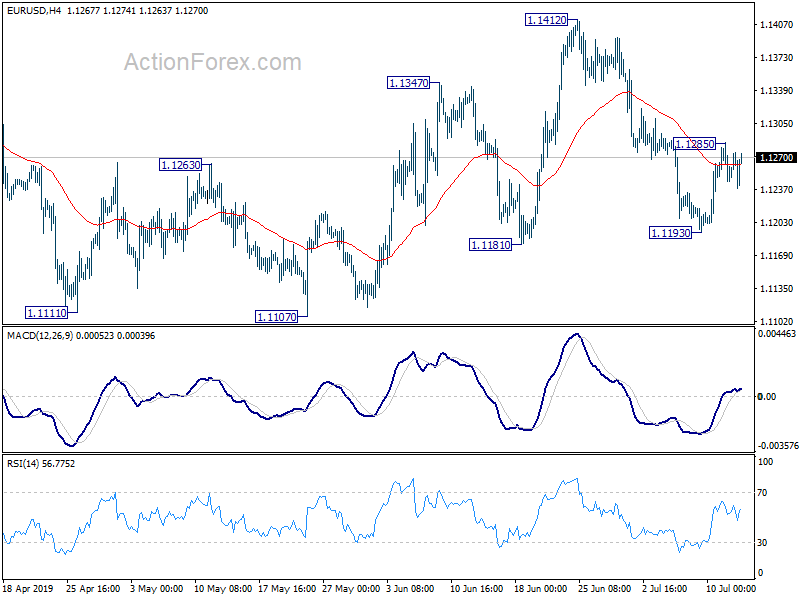
In the bigger picture, bullish convergence condition in daily and weekly MACD suggests that 1.1107 is a medium term bottom. However, rejection by 55 EMA retains medium term bearish. Outlook will be neutral for now. On the downside, break of 1.1107 will resume the down trend from 1.2555 (2018 high) to 78.6% retracement of 1.0339 to 1.2555 at 1.0813. Meanwhile, break of 1.1412 will resume the rebound to 38.2% retracement of 1.2555 to 1.1107 at 1.1660.
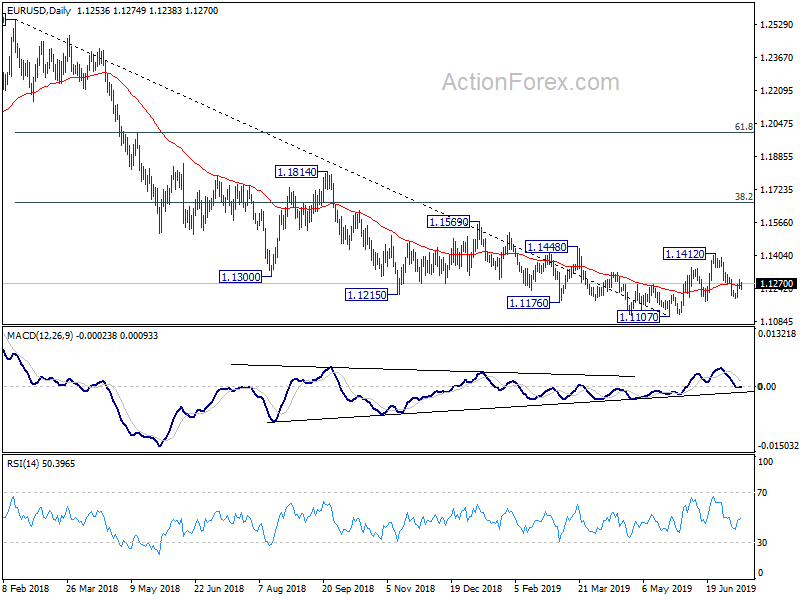
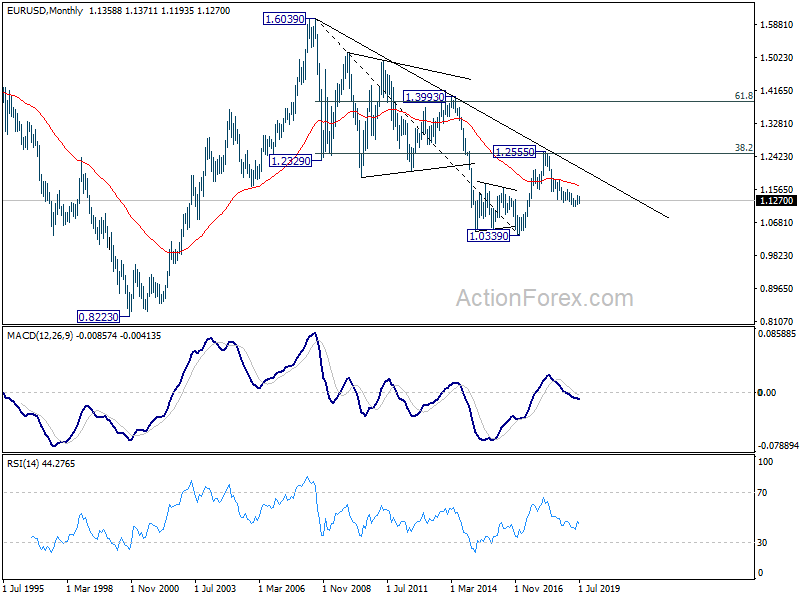
In the long term picture, outlook remains bearish for now. EUR/USD is held below decade long trend line that started from 1.6039 (2008 high). It was also rejected by 38.2% retracement of 1.6039 to 1.0339 at 1.2516 before. A break of 1.0039 low will remain in favor as long as 55 month EMA (now at 1.1674) holds).
USD/JPY Weekly Outlook
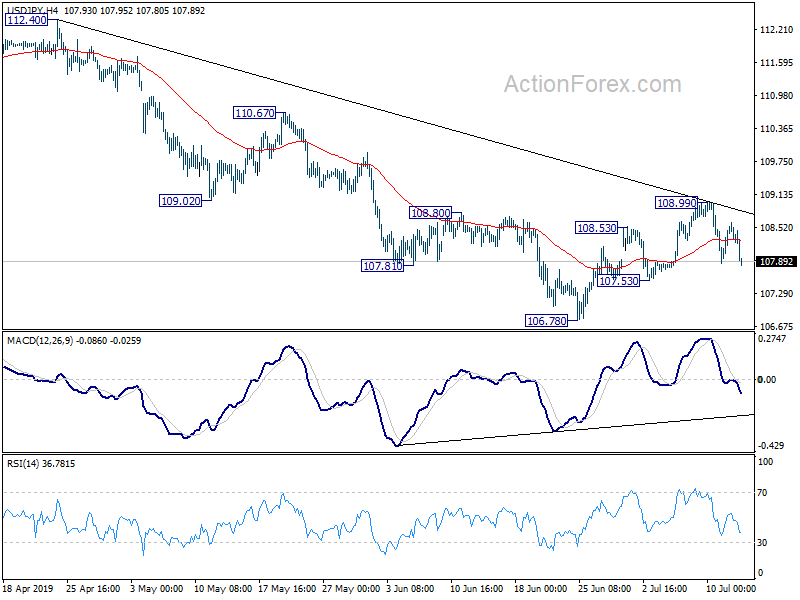
USD/JPY edged higher to 108.99 last week but was rejected by 55 day EMA and reversed. Corrective rebound from 107.54 should have completed. Initial bias stays on the downside this week for 107.53 first. Break of 107.53 will likely send USD/JPY through 106.78 to resume the decline from 112.40. For now, near term outlook will remain bearish as long as 108.99 resistance holds.
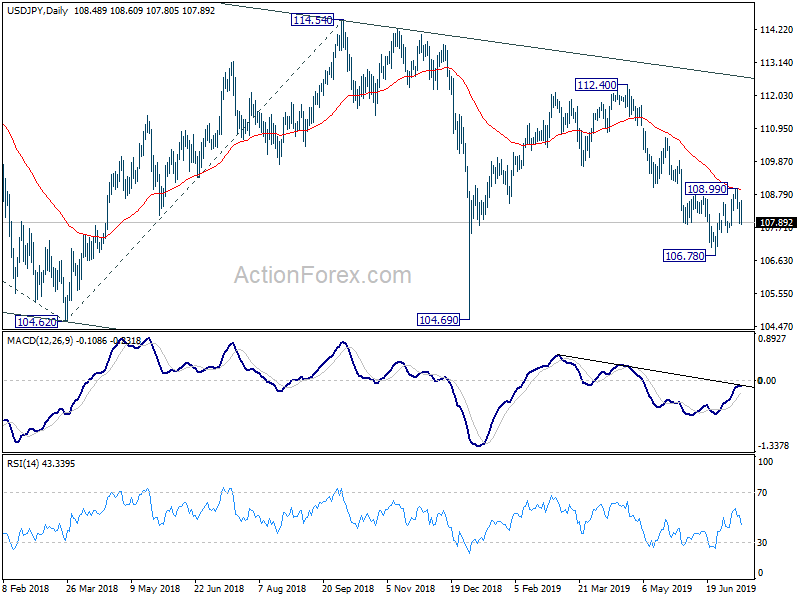
In the bigger picture, decline from 118.65 (Dec 2016) is still in progress, with the pair staying inside long term falling channel. Break of 104.62 will target 100% projection of 118.65 to 104.62 from 114.54 at 100.51. For now, we'd expect strong support above 98.97 (2016 low) to contain downside to bring rebound. In any case, break of 112.40 is needed to the first serious sign of medium term bullishness. Otherwise, further decline will remain in favor in case of rebound.
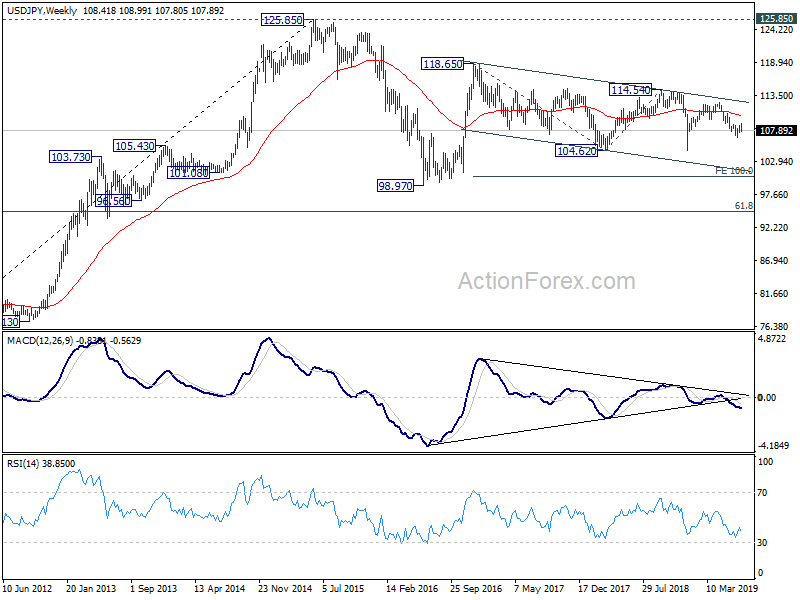
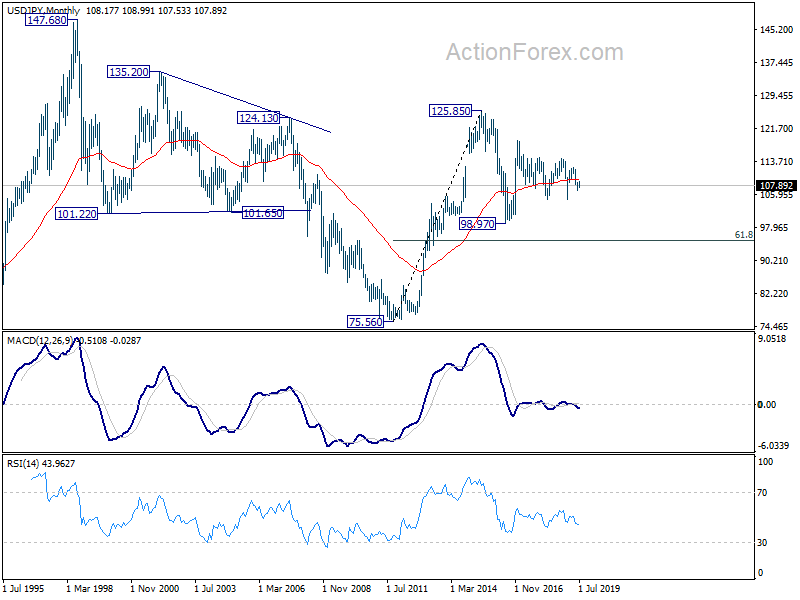
In the long term picture, the rise from 75.56 (2011 low) long term bottom to 125.85 (2015 high) is viewed as an impulsive move, no change in this view. Price actions from 125.85 are seen as a corrective move which could still extend. In case of deeper fall, downside should be contained by 61.8% retracement of 75.56 to 125.85 at 94.77. Up trend from 75.56 is expected to resume at a later stage for above 135.20/147.68 resistance zone.
GBP/USD Weekly Outlook
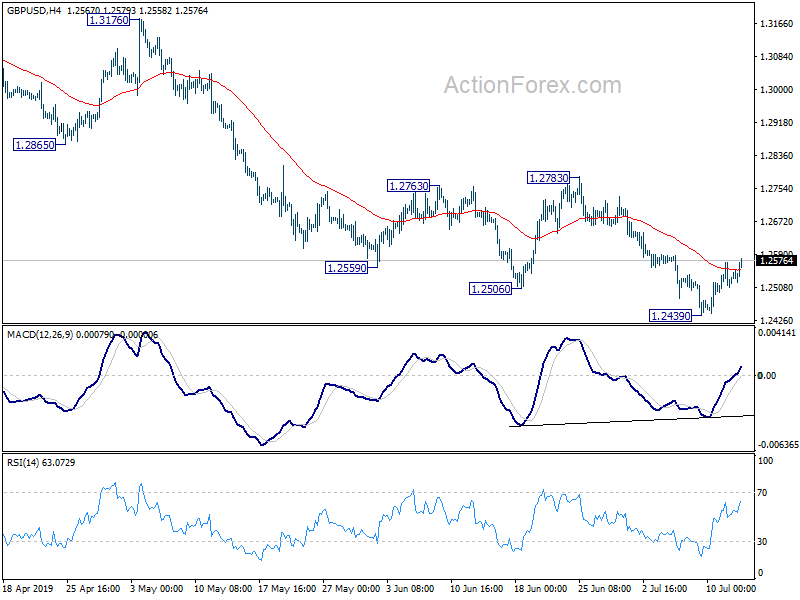
GBP/USD edged lower to 1.2439 last week but recovered since then. Initial bias remains neutral this week for some more consolidations. Upside should be limited below 1.2783 resistance to bring fall resumption. On the downside, break of 1.2439 would resume the decline from 1.3381 to retest 1.2391 low. Firm break there will resume larger down trend.
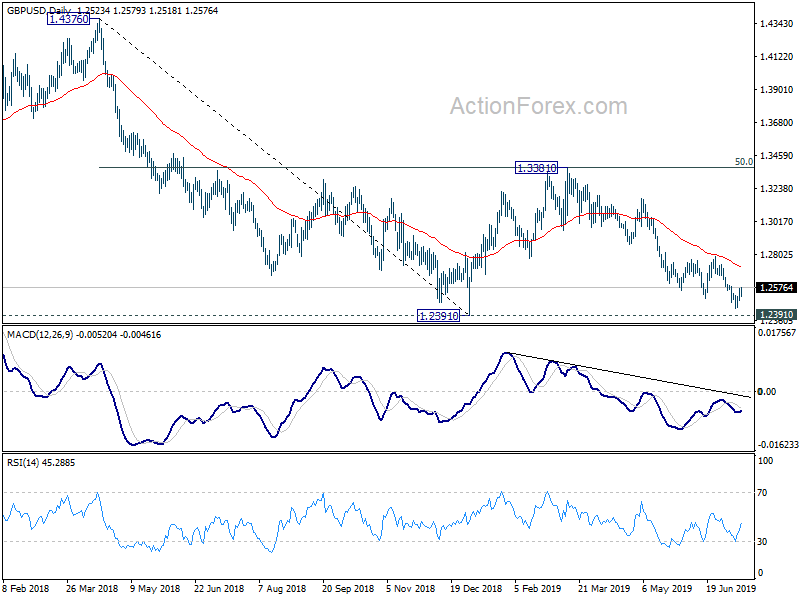
In the bigger picture, down trend from 1.4376 (2018 high) is still in progress. Break of 1.2391 would target a test on 1.1946 long term bottom (2016 low). For now, we don't expect a firm break there yet. Hence, focus will be on bottoming signal as it approaches 1.1946. In any case, medium term outlook will stay bearish as long as 1.3381 resistance holds, in case of strong rebound.
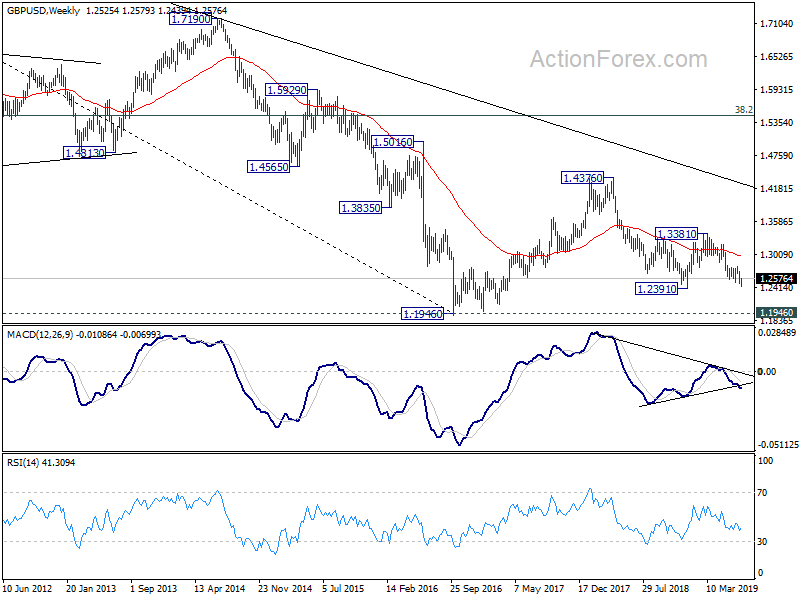
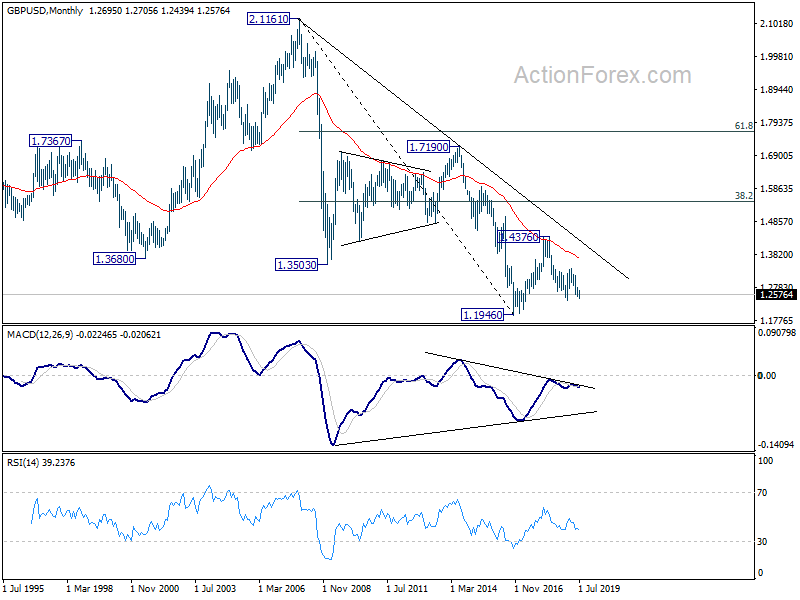
In the longer term picture, consolidative pattern from 1.1946 (2016 low) could still extend with another rising leg. But after all, decisive break of 38.2% retracement of 2.1161 (2007 high) to 1.1946 at 1.5466 is needed to indicate long term reversal. Otherwise, an eventual downside breakout will remain in favor.
USD/CHF Weekly Outlook
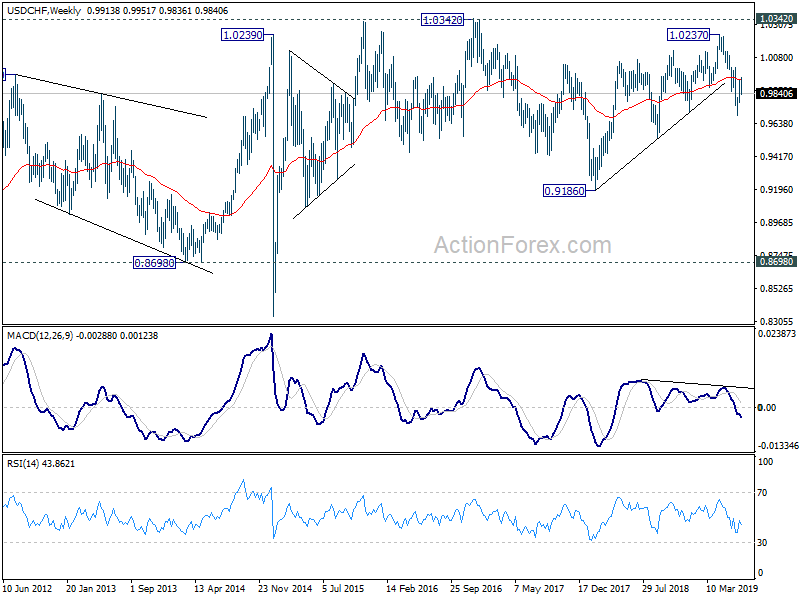
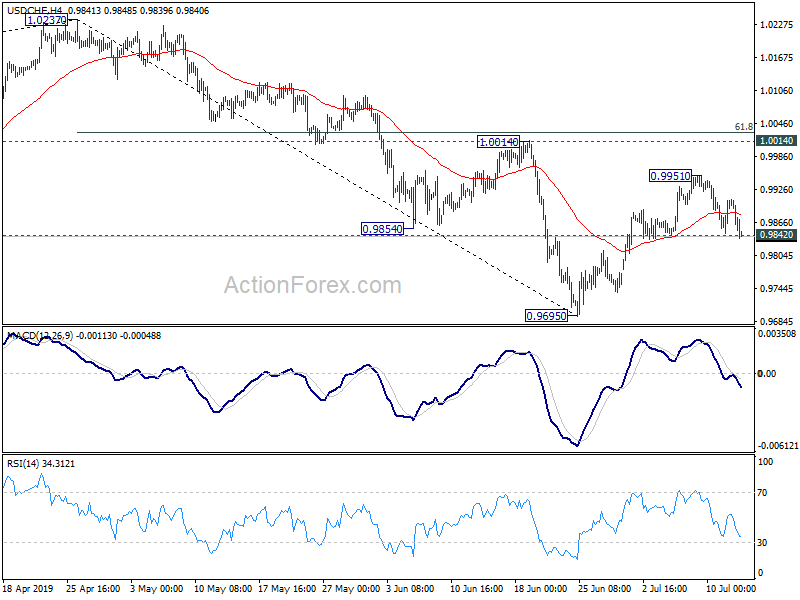
USD/CHF edged higher to 0.9951 last week was rejected by 55 day EMA and reversed since then. Rebound from 0.9695 should have completed already. Initial bias is back on the downside this week for retesting 0.9695 low first. On the upside, above 0.9951 will extend the rebound from 0.9695. In that case, upside should be limited by 61.8% retracement of 1.0237 to 0.9695 at 1.0030.
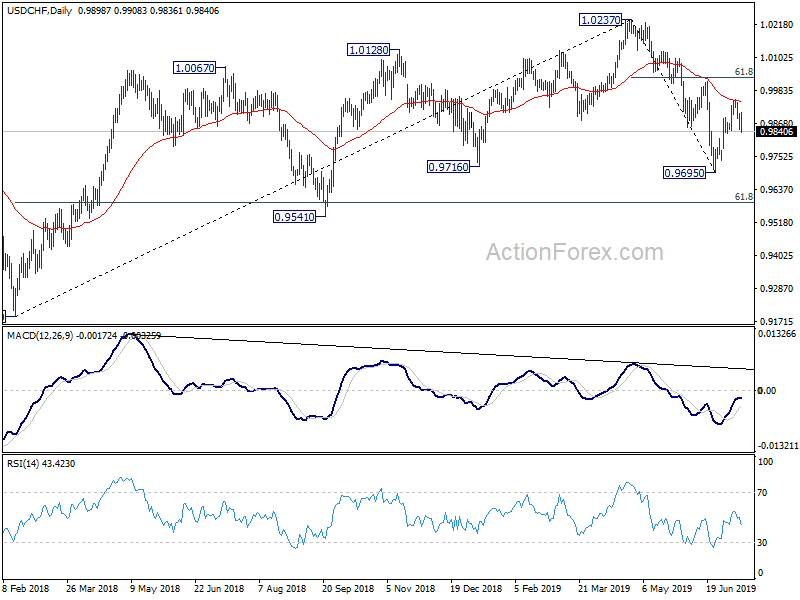
In the bigger picture, up trend from 0.9186 (2018 low) should have completed at 1.0237 already. Deeper decline would be seen to 61.8% retracement of 0.9186 to 1.0237 at 0.9587 and below. For now, USD/CHF is seen as in long term range pattern between 0.9186 and 1.0342. Hence, we'd pay attention to bottoming signal below 0.9587. However, sustained break of 1.0014 will revive medium term bullishness and turn focus back to 1.0237 high.
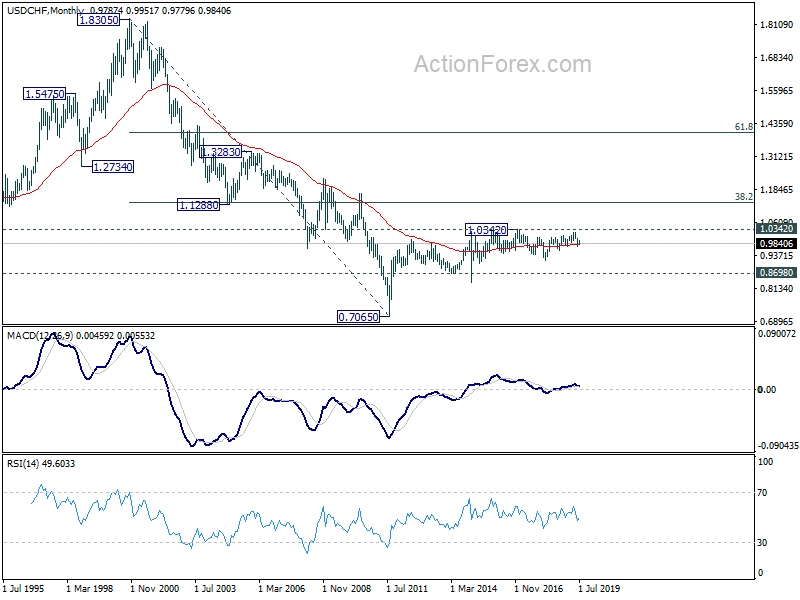
In the long term picture, price actions from 0.7065 (2011 low) are not clearly impulsive yet. Thus, we'll treat it as developing into a corrective pattern, at least, until a firm break of 1.0342 resistance.