

Sample Category Title
USD/JPY Mid-Day Outlook
Daily Pivots: (S1) 108.06; (P) 108.29; (R1) 108.73; More...
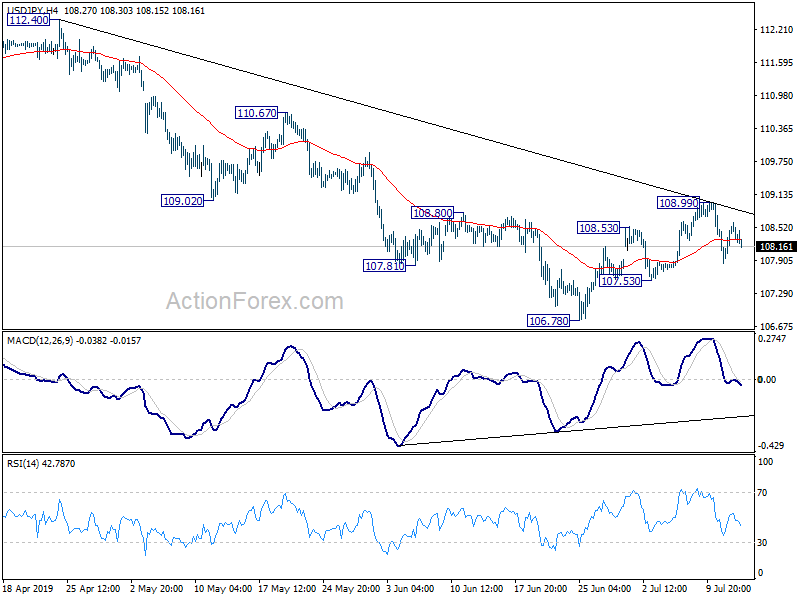
No change in USD/JPY's outlook. Corrective rebound from 106.78 should have completed at 108.99, after rejection by 55 day EMA. Break of 107.53 will likely send USD/JPY through 106.78 to resume the decline from 112.40. For now, near term outlook will remain bearish as long as 108.99 resistance holds.
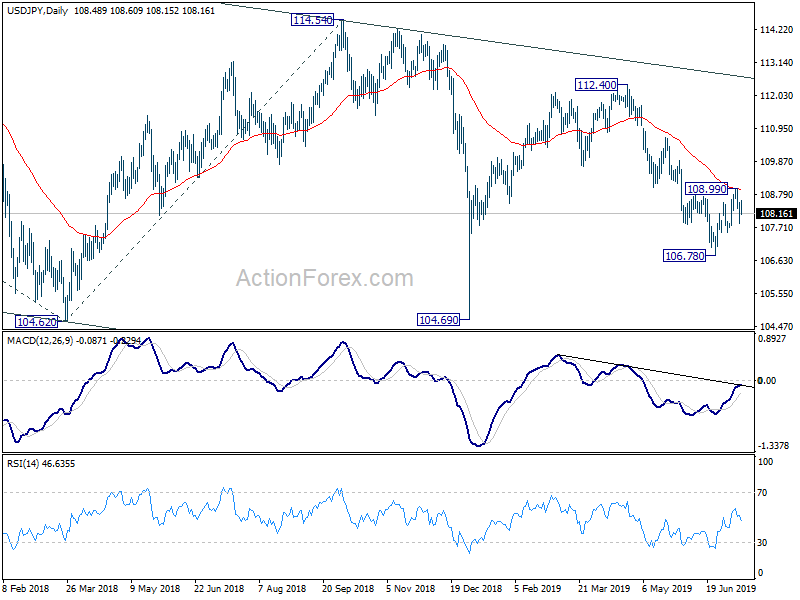
In the bigger picture, decline from 118.65 (Dec 2016) is still in progress, with the pair staying inside long term falling channel. Break of 104.62 will target 100% projection of 118.65 to 104.62 from 114.54 at 100.51. For now, we'd expect strong support above 98.97 (2016 low) to contain downside to bring rebound. In any case, break of 112.40 is needed to the first serious sign of medium term bullishness. Otherwise, further decline will remain in favor in case of rebound.
USD/CHF Mid-Day Outlook
Daily Pivots: (S1) 0.9863; (P) 0.9887; (R1) 0.9928; More...
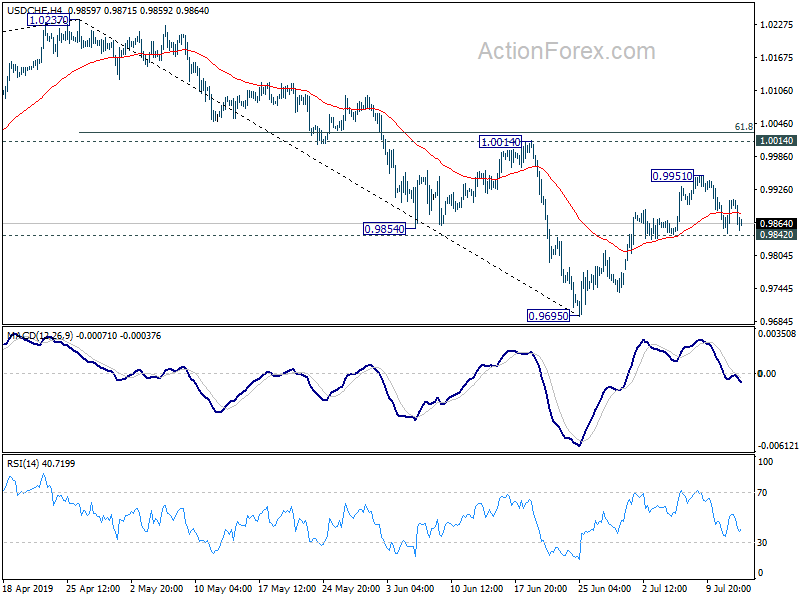
Intraday bias in USD/CHF remains neutral at this point. On the downside, break of 0.9842 will indicate that rebound from 0.9695 has completed at 0.9951. In this case, intraday bias will be turned back to the downside for retesting 0.9695 low. On the upside, above 0.9951 will target 1.0014. But upside could be limited by 61.8% retracement of 1.0237 to 0.9695 at 1.0030.
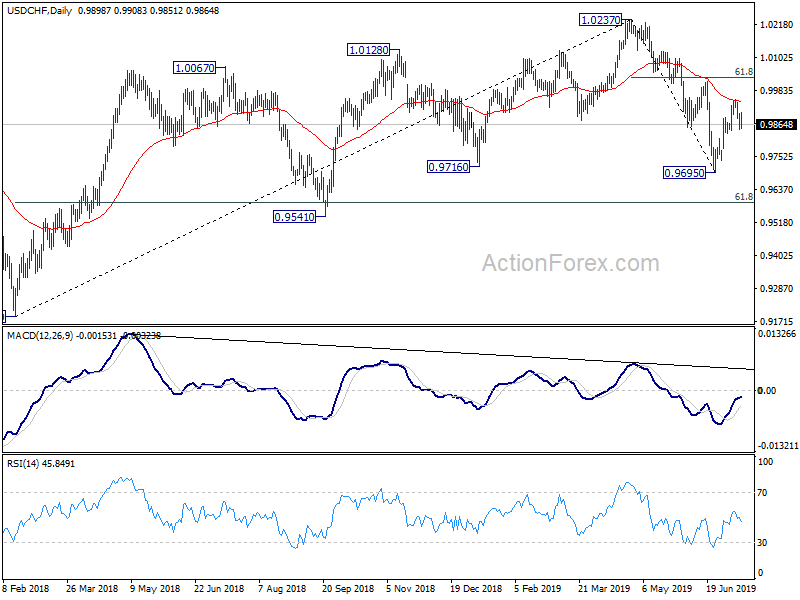
In the bigger picture, current development suggests that up trend from 0.9186 (2018 low) has completed at 1.0237 already. Deeper decline would be seen to 61.8% retracement of 0.9186 to 1.0237 at 0.9587 and below. For now, USD/CHF is seen as in long term range pattern between 0.9186 and 1.0342. Hence, we'd pay attention to bottoming signal below 0.9587. However, sustained break of 1.0014 will revive medium term bullishness and turn focus back to 1.0237 high.
GBP/USD Mid-Day Outlook
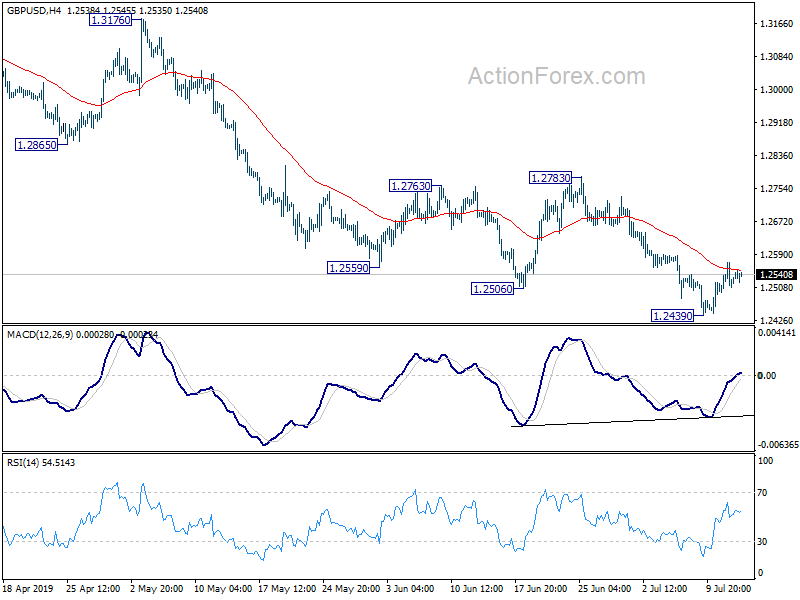
Daily Pivots: (S1) 1.2490; (P) 1.2530; (R1) 1.2568; More....
Intraday bias in GBP/USD remains neutral as consolidation from 1.2439 is extending. Further rise cannot be ruled out but upside should be limited well below 1.2783 resistance to bring fall resumption. On the downside, break of 1.2439 would resume the decline from 1.3381 to retest 1.2391 low. Firm break there will resume larger down trend.
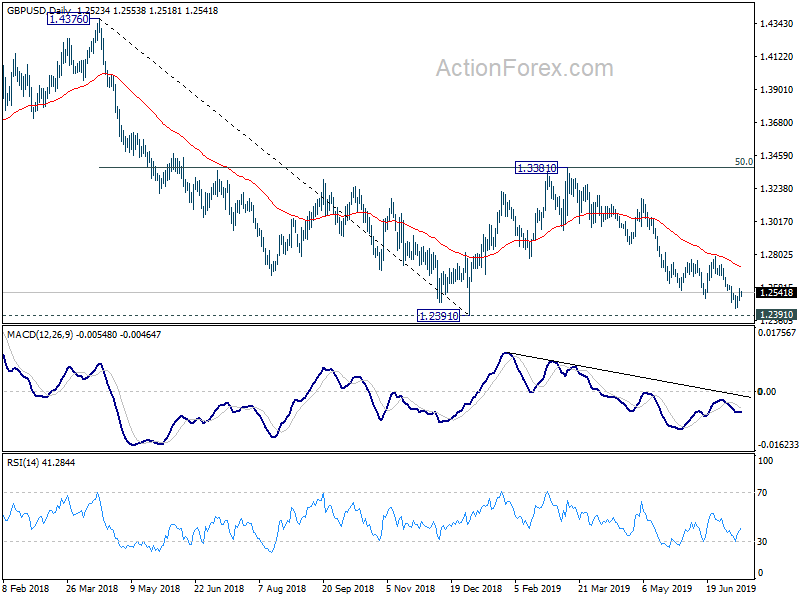
In the bigger picture, down trend from 1.4376 (2018 high) is still in progress. Break of 1.2391 would target a test on 1.1946 long term bottom (2016 low). For now, we don't expect a firm break there yet. Hence, focus will be on bottoming signal as it approaches 1.1946. In any case, medium term outlook will stay bearish as long as 1.3381 resistance holds, in case of strong rebound.
EUR/USD Mid-Day Outlook
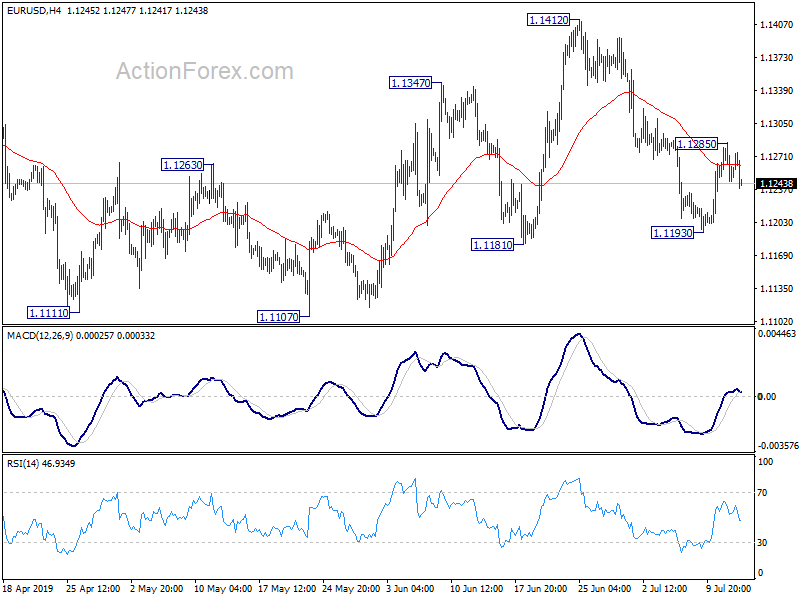
Daily Pivots: (S1) 1.1238; (P) 1.1262; (R1) 1.1279; More...
Intraday bias in EUR/USD is turned neutral with 4 hour MACD crossed below signal line. A temporary top is formed at 1.1285. On the upside, above 1.1285 will extend the rebound from 1.1193 to 1.1412 resistance. Break will resume the whole choppy rise from 1.1107. On the downside, break of 1.1193 will turn bias back to the downside to retest 1.1107 low instead.
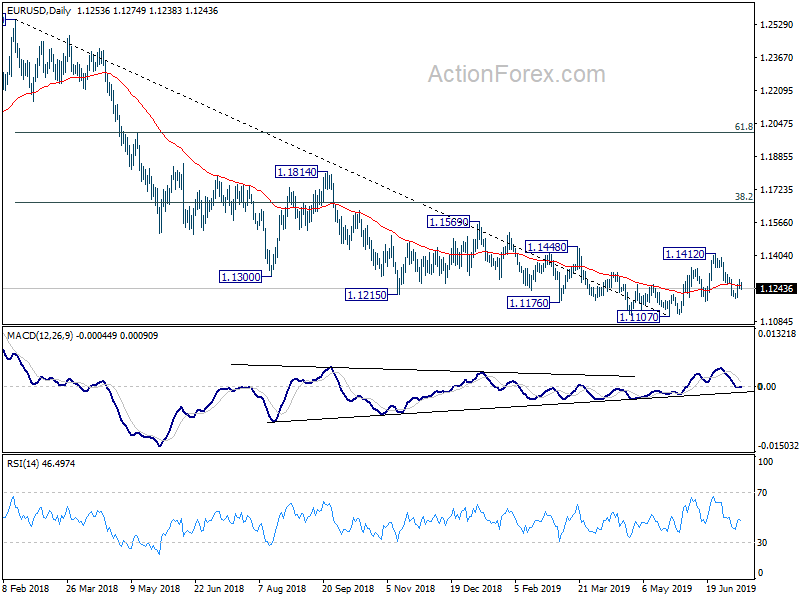
In the bigger picture, bullish convergence condition in daily and weekly MACD suggests that 1.1107 is a medium term bottom. However, rejection by 55 EMA retains medium term bearish. Outlook will be neutral for now. On the downside, break of 1.1107 will resume the down trend from 1.2555 (2018 high) to 78.6% retracement of 1.0339 to 1.2555 at 1.0813. Meanwhile, break of 1.1412 will resume the rebound to 38.2% retracement of 1.2555 to 1.1107 at 1.1660.
Euro Turns Soft, Ignoring Strong Industrial Production and Rebound in German Yield
While Dollar remains the worst performing one for the week, Euro is overtaking as the weakest one for today. Selloff in crosses, in particular in EUR/CHF, is dragging down the common currency. Much stronger than expected industrial production data was ignored. Instead, it's clear that ECB is on track for more monetary stimulus, and could probably deliver even ahead of Fed.
Staying in the currency markets, Dollar is so far the weakest one for today, followed by New Zealand Dollar. Swiss Franc and Yen are the strongest ones, also ignoring resilience in stock markets and rebound in treasury yields. Canadian Dollar is the third strongest for now.
In Europe, currently, FTSE is up 0.10%. DAX is up 0.07%. CAC is up 0.44%. German 10-year yield is up 0.061 at -0.203, it hit record low at -0.407 just earlier this month. Earlier in Asia, Nikkei rose 0.20%. Hong Kong HSI rose 0.14%. China Shanghai SSE rose 0.44%. Singapore Strait Times rose 0.21%. Japan 10-year JGB yield rose 0.0259 to -0.114.
WH Navarro: Trade negotiation with China in a quiet period, be patient and don't listen to garbage
White House trade advisor Peter Navarro said trade negotiation with China is "in a quiet period" and urged people to be "patient with the process". He also trashed media in US and China as they reported "garbage" regarding trade negotiation. Instead he urged people to only listen to comments from either Trump or Trade Representative Robert Lighthizer.
Navarro said on CNBC Squawk Box that "my advice for investors is to be patient with the process and don't believe anything you read in either the Chinese or the US press about these negotiations unless it comes from the mouth of either the president or advisor Lighthizer".
And, "there's just going to be a lot of garbage coming out of the Wall Street Journal and the People's Daily and everything in between," he added, "there were all sorts of stories written and they were designed to shape the negotiations and they didn't have any insight into them."
US PPI rose 0.1%, 1.7% yoy in June, versus expectation of 0.1% mom, 1.6% yoy. PPI core rose 0.3% mom, 2.3% yoy, versus expectation of 0.2% mom, 2.1% yoy.
ECB Visco: Will asset hot to adjust policy instruments in the coming weeks
ECB Governing Council member Ignazio Visco said the central bank "will need to adopt further expansionary measures if the euro zone economy does not pick up." And, "in the coming weeks the ECB will continue to assess how to adjust the instruments at its disposal". This is in-line with market expectations that ECB is ready ramp up monetary stimulus either on July 25 or later in September.
Being Governor of Bank of Italy too, Visco expected the Italian economy to grow just 0.1% this year, marginally below the government's 0.2% official forecast. Though, he also expected growth to pickup to just slightly below 1% in 2020 and 2021. He urged the government to adopt "prudent" budget deficit targets for the coming years. But he also welcomed recent fall in Italian yields, after EU averted the Excessive Deficit Procedure on the country.
Eurozone industrial production rose 0.9% mom in May, above expectation
Eurozone industrial production rose 0.9% mom in May, well above expectation of 0.2% mom. Comparing by industrial grouping, production of non-durable consumer goods rose by 2.7%, durable consumer goods by 2.3%, capital goods by 1.3% and energy by 0.7%, while production of intermediate goods fell by 0.2%.
EU 28 industrial production rose 0.8% mom. Among member states for which data are available, the highest increases in industrial production were registered in Denmark (+4.4%), Ireland (+2.3%) and France (+2.1%). The largest decreases were observed in Finland (-2.9%), Romania (-1.9%) and Croatia (-1.7%).
China trade surplus widened to USD 51B, both imports and exports declined
In June, in USD terms, US imports dropped -7.3% yoy to USD 16.19B. Exports dropped -1.3% yoy to 21.28B. Both import and exports were worse than expectation of -4.6% yoy and -0.6% yoy respectively. Trade surplus came in at USD 51.0B above expectation of USD 45.2B.
The results clearly showed some impacts in trade after US imposition on higher tariffs on USD 200B of Chinese goods came into effect. But so far, there was no notably improvement in US-China trade balance. US trade deficit with China came in at USD -140.5B in the first half, worse than USD -133.8B in first half of 2018.
From Jan to Jun, with US: Total trade dropped -14.2% yoy to USD 258.3B. Exports dropped -8.1% yoy to USD 199.4B. Imports dropped -29.9% yoy to USD 58.9B. Trade surplus was at USD 140.5B.
From Jan to Jun, with EU: Total trade rose 4.9% yoy to USD 338.0B. Exports rose 6.0% yoy to USD 202.8B. Imports rose 3.3% yoy to 135.2B. Trade surplus was at USD 67.6B
From Jan to Jun, with AU: Total trade rose 6.3% yoy to 78.7B. Exports rose 2.0% to USD 22.1B. Imports rose 8.1% to USD 56.7B. Trade deficit was at USD -34.6B.
New Zealand BusinessNZ PMI rose to 51.3, but employment worsened
New Zealand BusinessNZ Performance of Manufacturing Index rose to 51.3 in June, up from 50.4. BusinessNZ's executive director for manufacturing Catherine Beard said that while the sector avoided further deterioration in activity from May, there were still a number of concerns about manufacturing's current state of play.
She said: "The key sub-indexes of production (51.0) and new orders (52.8) recovered from May, which ensured the sector didn't fall into contraction for June. However, employment (48.0) worsened to its lowest level since August 2016, while deliveries of raw materials (48.9) also fell into negative territory for the first time since December 2017, and its lowest result since September 2012.
EUR/USD Mid-Day Outlook
Daily Pivots: (S1) 1.1238; (P) 1.1262; (R1) 1.1279; More...
Intraday bias in EUR/USD is turned neutral with 4 hour MACD crossed below signal line. A temporary top is formed at 1.1285. On the upside, above 1.1285 will extend the rebound from 1.1193 to 1.1412 resistance. Break will resume the whole choppy rise from 1.1107. On the downside, break of 1.1193 will turn bias back to the downside to retest 1.1107 low instead.
In the bigger picture, bullish convergence condition in daily and weekly MACD suggests that 1.1107 is a medium term bottom. However, rejection by 55 EMA retains medium term bearish. Outlook will be neutral for now. On the downside, break of 1.1107 will resume the down trend from 1.2555 (2018 high) to 78.6% retracement of 1.0339 to 1.2555 at 1.0813. Meanwhile, break of 1.1412 will resume the rebound to 38.2% retracement of 1.2555 to 1.1107 at 1.1660.
Economic Indicators Update
| GMT | Ccy | Events | Actual | Forecast | Previous | Revised |
|---|---|---|---|---|---|---|
| 22:30 | NZD | BusinessNZ Manufacturing PMI Jun | 51.3 | 50.2 | 50.4 | |
| 04:30 | JPY | Industrial Production M/M May F | 2.20% | 2.30% | 2.30% | |
| 07:00 | CNY | Trade Balance (CNY) Jun | 345B | 276B | 276B | |
| 07:00 | CNY | Imports Y/Y (CNY) Jun | -0.40% | 4.50% | -2.50% | |
| 07:00 | CNY | Exports Y/Y (CNY) Jun | 6.10% | 7.70% | 7.70% | |
| 07:00 | CNY | Trade Balance (USD) Jun | 51.0B | 45.2B | 41.7B | |
| 07:00 | CNY | Imports Y/Y (USD) Jun | -7.30% | -4.60% | -8.50% | |
| 07:00 | CNY | Exports Y/Y (USD) Jun | -1.30% | -0.60% | 1.10% | |
| 09:00 | EUR | Eurozone Industrial Production M/M May | 0.90% | 0.20% | -0.50% | -0.40% |
| 12:30 | USD | PPI M/M Jun | 0.10% | 0.10% | 0.10% | |
| 12:30 | USD | PPI Y/Y Jun | 1.70% | 1.60% | 1.80% | |
| 12:30 | USD | PPI Core M/M Jun | 0.30% | 0.20% | 0.20% | |
| 12:30 | USD | PPI Core Y/Y Jun | 2.30% | 2.10% | 2.30% |
Gold Loses Steam, after Rallying Out of Long-Term Trading Range
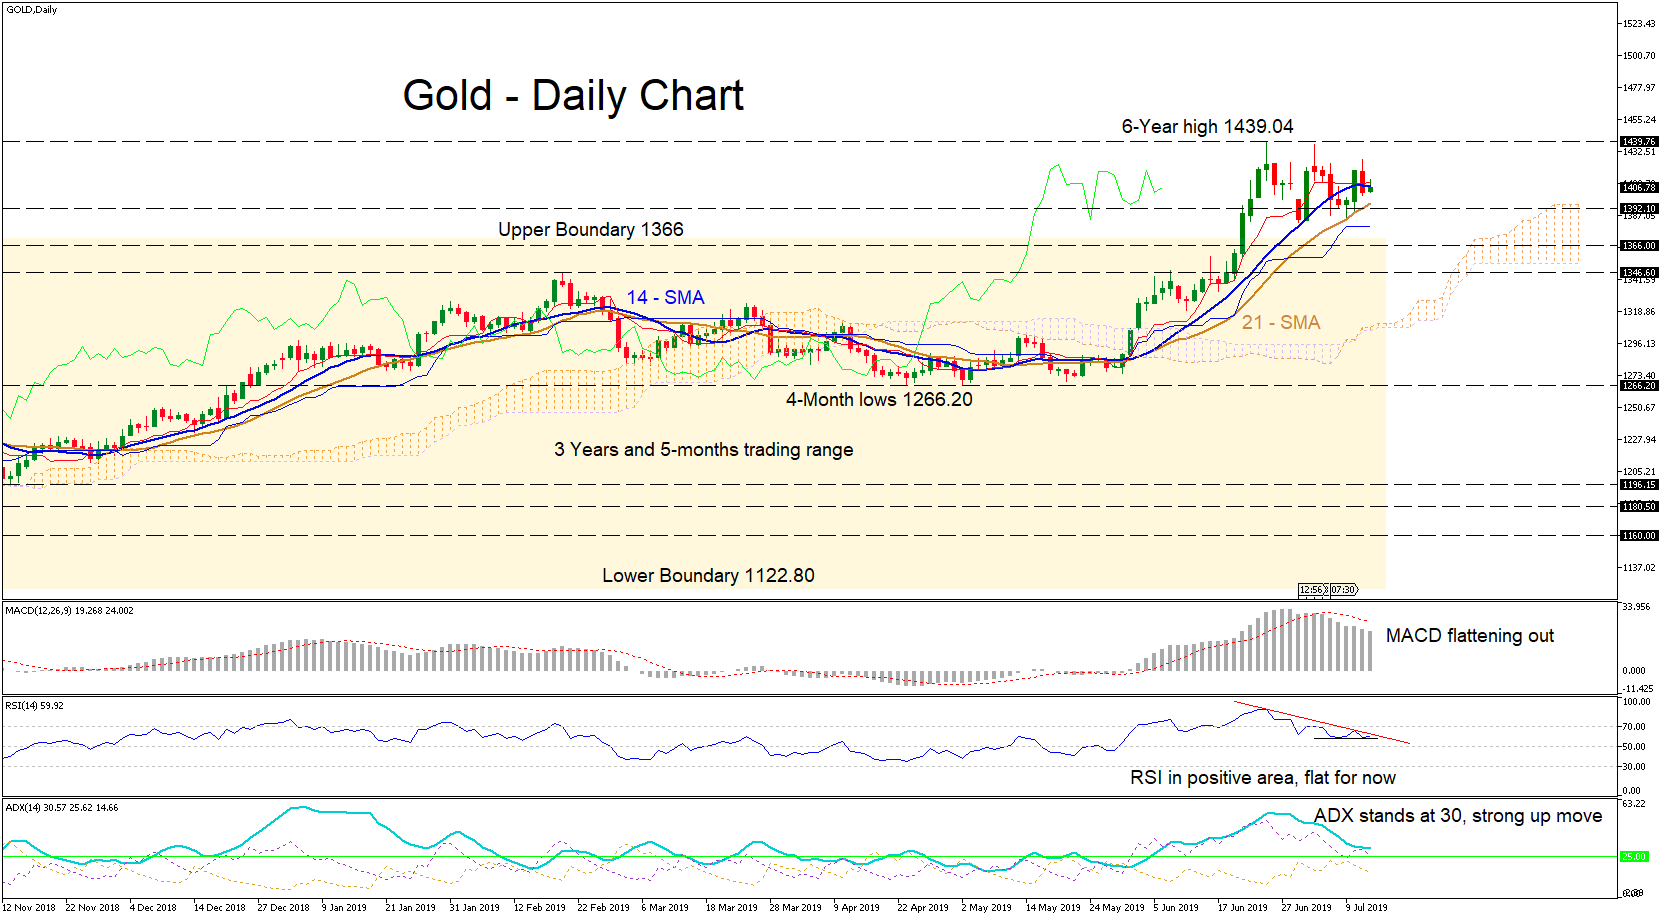
Gold lost steam in the last weeks, after a rally that began at the beginning of June. Price moved sideways after the break above the upper boundary of the three-year and five-month trading range, of 1366, and is currently trading between the short-term simple moving averages (SMAs) of the 14- and 21-day SMAs.
Momentum indicators suggest a short-term neutral bias, as the MACD and RSI flatten out in positive areas. The Chikou span is pointing up and above the price, with the averages of the Ichimoku indicator flat as well. The ADX at 30 suggests the uptrend still stands strong.
Although medium-term view remains positive, and should it hold up, there would be an immediate retest of the high of 1437.60 and the six year high of 1439.04.
On the other hand, for a shift to the downside, the 21-SMA, coupled with support at 1392.10 would need to be fractured before seeing the next obstacles of 1366 and 1346.60. But ultimately, the break of the four-month low of 1266.20 would turn the outlook bearish.
Summing up, the short-term view is neutral, even though a general positive outlook exists.
US PPI slowed to 1.7% yoy, core PPI unchanged 2.3% yoy
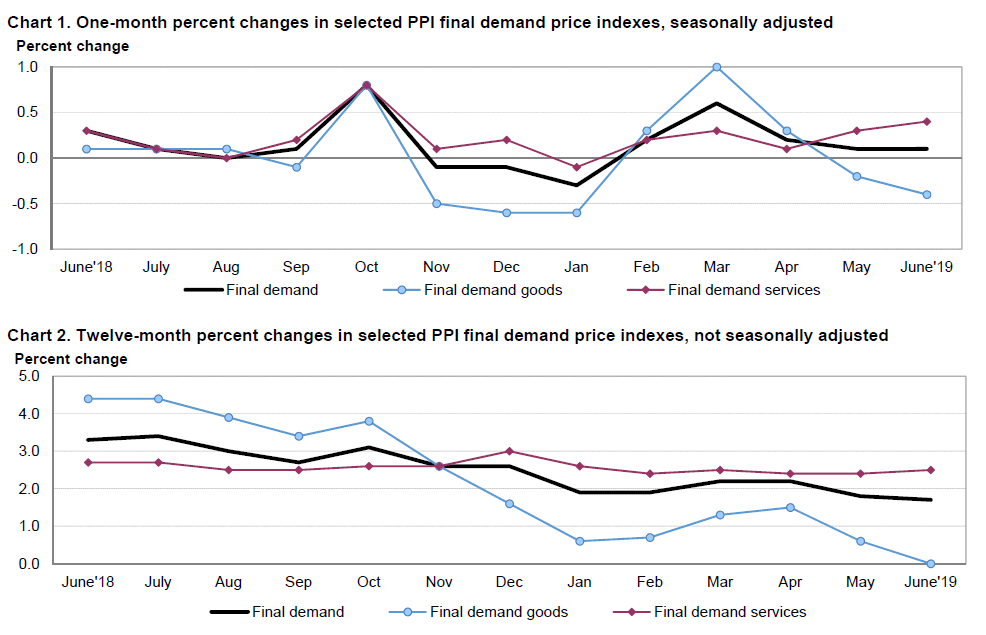
US PPI rose 0.1%, 1.7% yoy in June, versus expectation of 0.1% mom, 1.6% yoy. PPI core rose 0.3% mom, 2.3% yoy, versus expectation of 0.2% mom, 2.1% yoy.
US Open – All Eyes on Earnings
Heading for record territory
We’re trading in the green again on Friday, with US futures pointing to fresh record highs on Wall Street after a satisfying testimony from Jerome Powell earlier in the week.
Powell testified on the semi-annual monetary policy report and Wednesday and Thursday and, safe to say, he passed with flying colors as far as investors are concerned.
His downbeat tone when reflecting on the economic outlook and inflation combined with his complete lack of desire to correct market expectations, despite a cut being 100% priced in this month, gave investors exactly what they wanted.
Trade talks are continuing between the US and China although Trump’s tweet about Chinese purchases of agricultural products yesterday further highlighted how more speed bumps may remain in the road ahead.
The G20 was a positive development but there’s still a long way to go and while a deal makes sense for both sides this year, it’s far from guaranteed and could hit many more snags.
Still, with talks ongoing and the Fed soon to be back in easing mode, attention can now shift to earnings season which gets underway next week. It’s expected to be a tough season for companies with a large number have offered negative guidance in the run up to it.
An earnings recession looks on the cards, with earnings expected to have declined by a little below 3% in the second quarter, further fueling the case for rate cuts.
US 30 Index Flies at New All-Time Highs
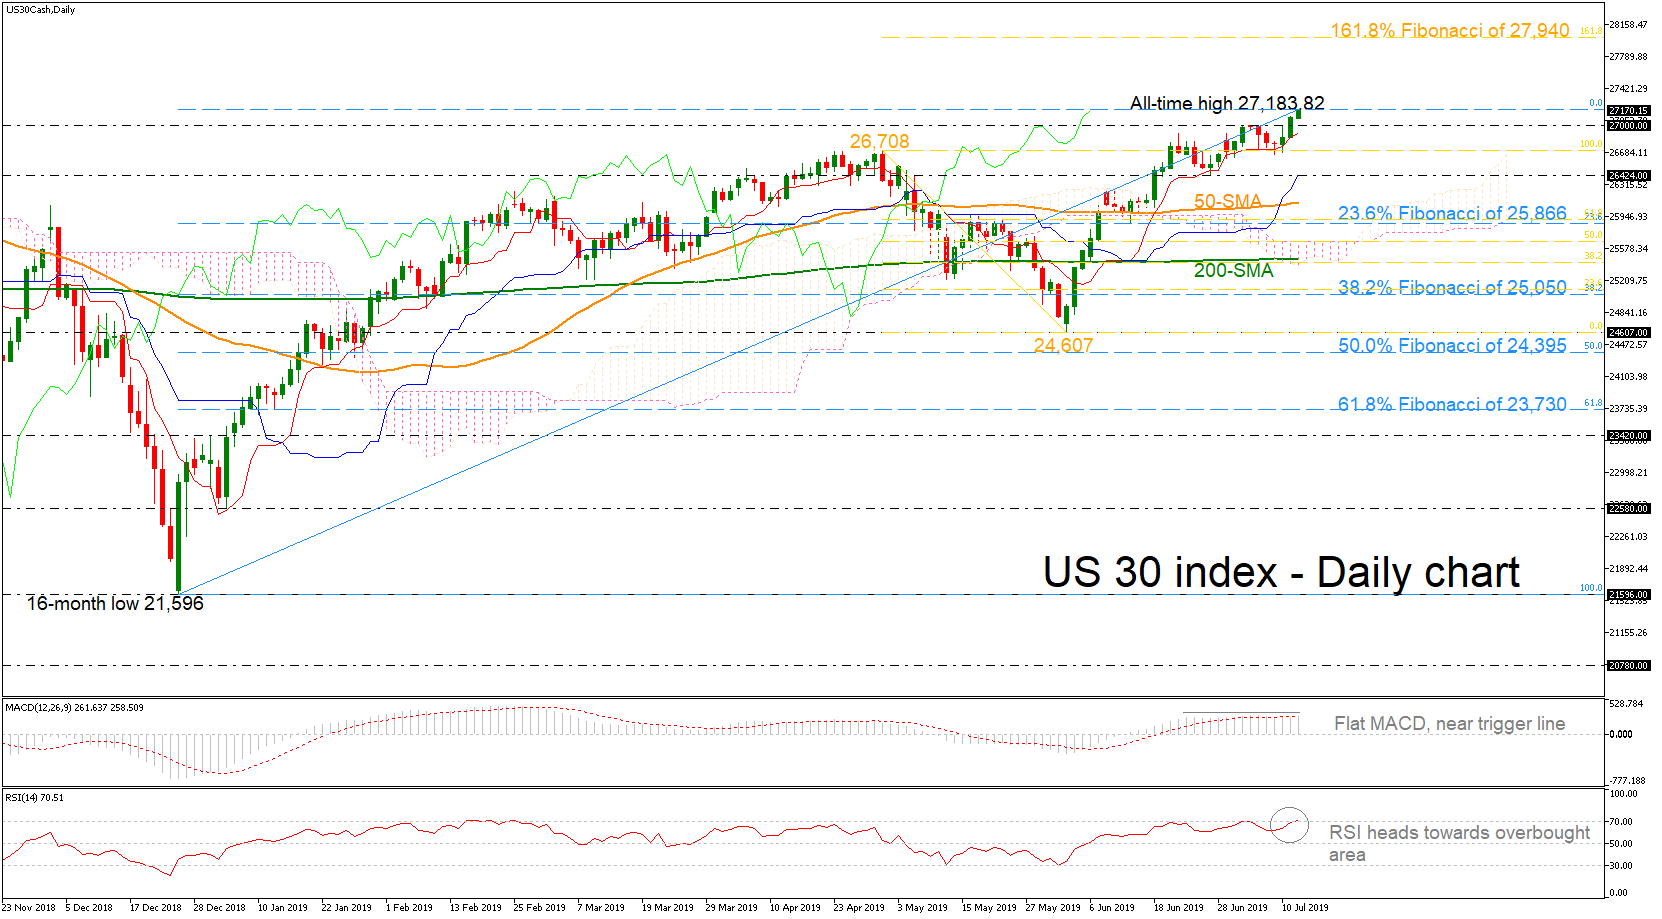
The US 30 index has been in a flying mode over the last couple of days, resting near a fresh all-time high of 27,183.82.
The flat momentum in the MACD, which trends above its trigger line, signals that fresh record highs can be achieved but the volatility in the price would weaken. Still, the RSI warns that the market is approaching overbought territory and hence downside corrections cannot be ruled out.
Jumping above the latest record high, the index could hit the 161.8% Fibonacci extension level of the downfall from the 26,708 high to the 24,607 low near 27,940.
Otherwise, if the market weakens below the 27,000 psychological mark, the 26,424 support, which overlaps with the blue Kijun-sen line could come into focus. Moving lower, the 50-day simple moving average (SMA) currently at 26,108 could attract traders’ attention before touching the 23.6% Fibonacci region of the upleg from 21,596 to 27,183.82 near 25,866.
In the long-term picture, a bull market began after the jump above the previous high of 27,000. In case of a drop below the 23.6% Fibo of 25,866 the outlook could switch to neutral.
WH Navarro: Trade negotiation with China in a quiet period, be patient and don’t listen to garbage
White House trade advisor Peter Navarro said trade negotiation with China is "in a quiet period" and urged people to be "patient with the process". He also trashed media in US and China as they reported "garbage" regarding trade negotiation. Instead he urged people to only listen to comments from either Trump or Trade Representative Robert Lighthizer.
Navarro said on CNBC Squawk Box that "my advice for investors is to be patient with the process and don't believe anything you read in either the Chinese or the US press about these negotiations unless it comes from the mouth of either the president or advisor Lighthizer".
And, "there's just going to be a lot of garbage coming out of the Wall Street Journal and the People's Daily and everything in between," he added, "there were all sorts of stories written and they were designed to shape the negotiations and they didn't have any insight into them."