

Sample Category Title
Swiss Franc Reverses Its Gains In The Asian Session
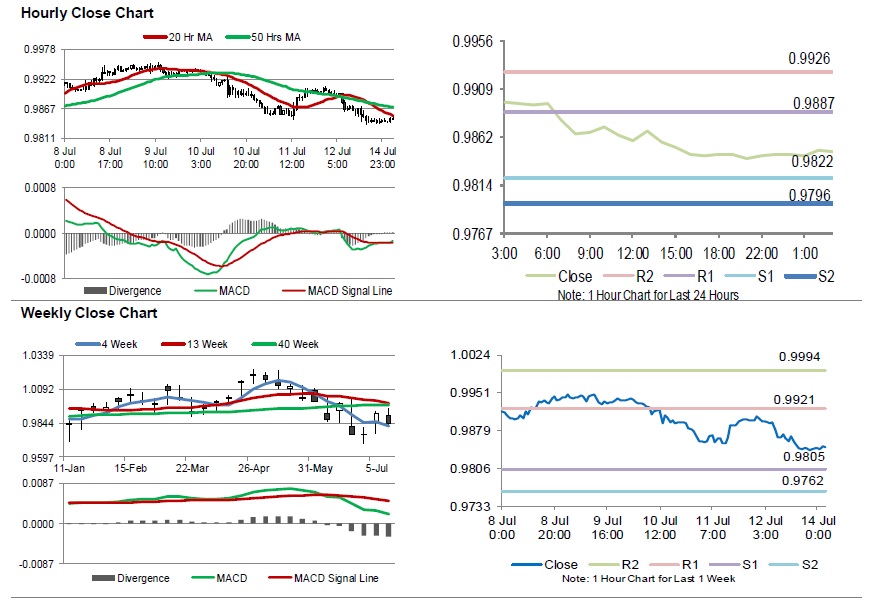
For the 24 hours to 23:00 GMT, the USD declined 0.58% against the CHF and closed at 0.9841 on Friday.
In the Asian session, at GMT0300, the pair is trading at 0.9847, with the USD trading 0.06% higher against the CHF from Friday’s close.
The pair is expected to find support at 0.9822, and a fall through could take it to the next support level of 0.9796. The pair is expected to find its first resistance at 0.9887, and a rise through could take it to the next resistance level of 0.9926.
Trading trend in the Swiss Franc today, is expected to be determined by Switzerland’s producer & import price index for June, slated to release in a while.
The currency pair is showing convergence with its 20 Hr moving average and trading below its 50 Hr moving average.
Loonie Trading A Tad Lower In The Morning Session
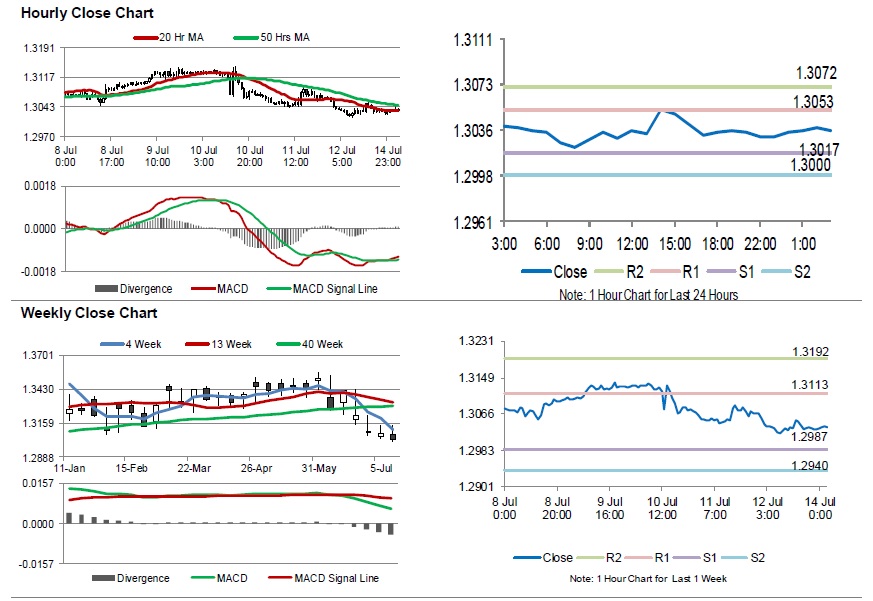
For the 24 hours to 23:00 GMT, the USD declined 0.26% against the CAD and closed at 1.3034 on Friday.
In the Asian session, at GMT0300, the pair is trading at 1.3035, with the USD trading slightly higher against the CAD from Friday’s close.
The pair is expected to find support at 1.3017, and a fall through could take it to the next support level of 1.3000. The pair is expected to find its first resistance at 1.3053, and a rise through could take it to the next resistance level of 1.3072.
Moving ahead, investors would closely monitor Canada’s existing home sales for June, scheduled to release later in the day.
The currency pair is showing convergence with its 20 Hr moving average and trading below its 50 Hr moving average.
Aussie Trading Higher, Ahead Of The RBA Meeting Minutes
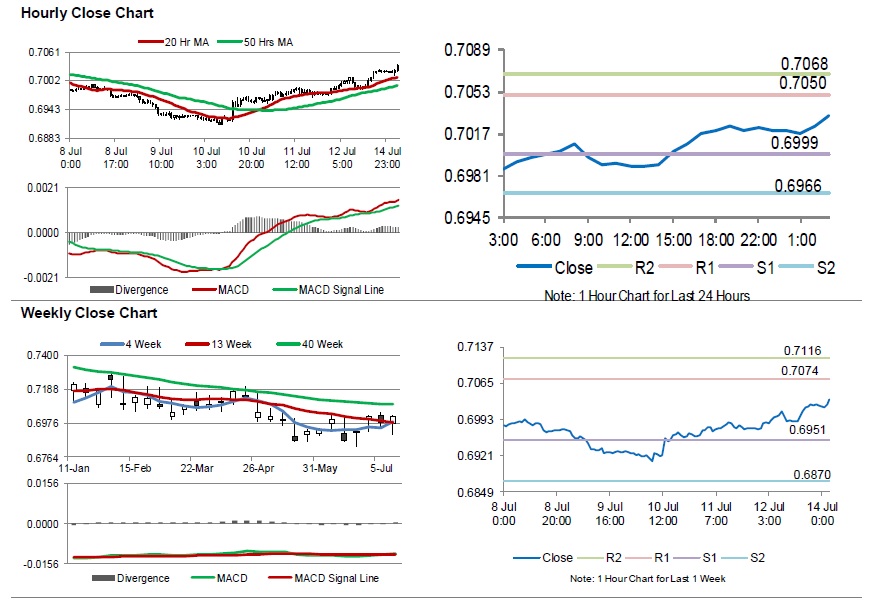
For the 24 hours to 23:00 GMT, the AUD rose 0.66% against the USD and closed at 0.7020 on Friday.
LME Copper prices rose 0.4% or $25.0/MT to $5950.0/MT. Aluminium prices declined 0.4% or $7.5/MT to $1799.0/MT.
In the Asian session, at GMT0300, the pair is trading at 0.7033, with the AUD trading 0.19% higher against the USD from Friday’s close.
Overnight data showed that China’s gross domestic product (GDP) climbed 1.6% on a quarterly basis in 2Q 2019, rising at its weakest pace in 27 years and higher than market expectations for an advance of 1.5%. In the previous quarter, GDP had recorded a rise of 1.4%. Moreover, the nation’s industrial production jumped 6.3% on an annual basis in June, higher than market expectations for a rise of 5.2%. In the previous month, industrial production had registered an increase of 5.0%. Additionally, retail sales advanced 9.8% on a yearly basis in June, higher than market expectations for a rise of 8.5%. In the prior month, retail sales had recorded a rise of 8.6%.
The pair is expected to find support at 0.6999, and a fall through could take it to the next support level of 0.6966. The pair is expected to find its first resistance at 0.7050, and a rise through could take it to the next resistance level of 0.7068.
Looking ahead, traders would await the Reserve Bank of Australia’s meeting minutes, slated to release overnight.
The currency pair is trading above its 20 Hr and 50 Hr moving averages.
Gold: Yellow Metal Reverses It Gains In The Morning Session
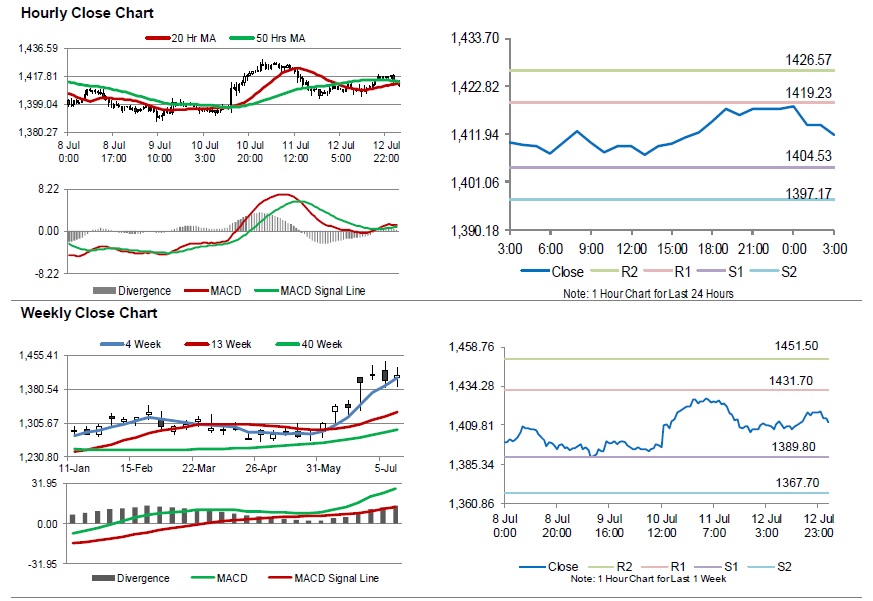
For the 24 hours to 23:00 GMT, Gold rose 0.75% against the USD and closed at USD1417.60 per ounce on Friday, amid weakness in the greenback.
In the Asian session, at GMT0300, the pair is trading at 1411.90, with gold trading 0.40% lower against the USD from Friday’s close.
The pair is expected to find support at 1404.53, and a fall through could take it to the next support level of 1397.17. The pair is expected to find its first resistance at 1419.23, and a rise through could take it to the next resistance level of 1426.57.
The yellow metal is showing convergence with its 20 Hr and 50 Hr moving averages.
Silver: White Metal Trading On A Weaker Footing This Morning
For the 24 hours to 23:00 GMT, Silver rose 0.63% against the USD and closed at USD15.24 per ounce on Friday, tracking gains in gold prices.
In the Asian session, at GMT0300, the pair is trading at 15.20, with silver trading 0.26% lower against the USD from Friday’s close.
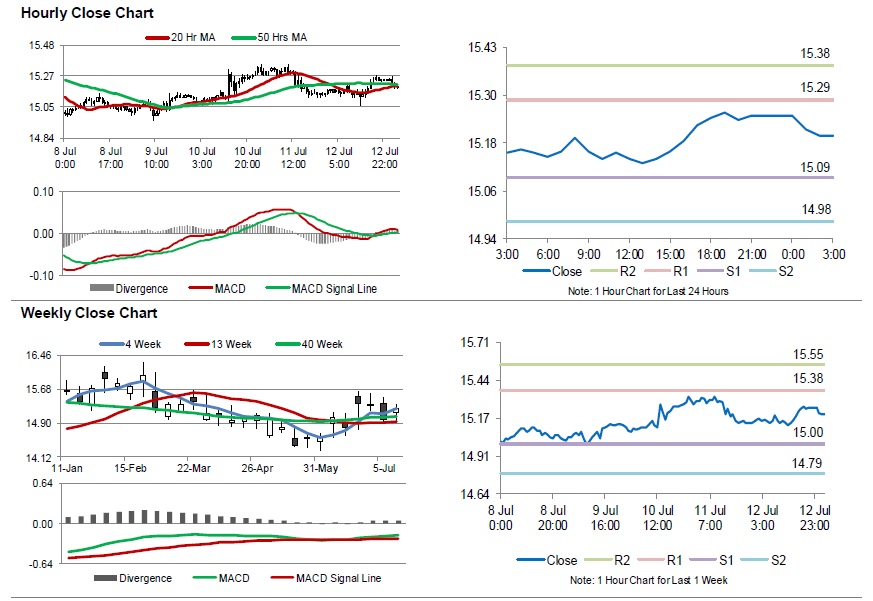
The pair is expected to find support at 15.09, and a fall through could take it to the next support level of 14.98. The pair is expected to find its first resistance at 15.29, and a rise through could take it to the next resistance level of 15.38.
The white metal is showing convergence with its 20 Hr and 50 Hr moving averages.
Crude Oil: Oil Extends Its Losses In The Asian Session
For the 24 hours to 23:00 GMT, Crude Oil declined 0.18% against the USD and closed at USD60.27 per barrel on Friday, amid growing concerns over near term scenarios for demand and supply.
Meanwhile, fresh figures from Baker Hughes disclosed that the number of active oil rigs dropped by 4 to 784 in the week ended 12 July.
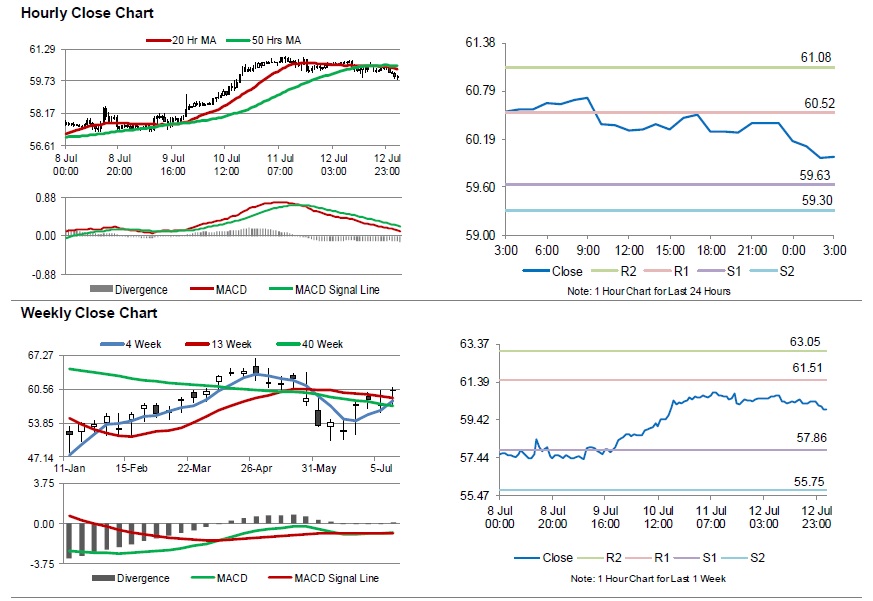
In the Asian session, at GMT0300, the pair is trading at 59.97, with oil trading 0.50% lower against the USD from Friday’s close.
The pair is expected to find support at 59.63, and a fall through could take it to the next support level of 59.30. The pair is expected to find its first resistance at 60.52, and a rise through could take it to the next resistance level of 61.08.
Crude oil is trading below its 20 Hr and 50 Hr moving averages.
China Q2 GDP slowed to 27-year low, but June data beat expectations
GDP growth slowed to 6.2% yoy in Q2, down from Q1's 6.4% yoy, matched expectations. That's also the slowest pace in at least 27 years. However, quarterly growth actually accelerated to 1.6% qoq, up from Q1's 1.4% qoq and beat expectation of 1.5% qoq.
Also June's data come in stronger than expected. But it remains to be seen if the momentum towards the end of the quarter could sustain. Headwinds from US tariffs and weaker global growth would still likely drag down China's growth ahead.
Fixed assessment investment, excluding rural, rose 5.8% ytd yoy in June, up from 5.6% and beat expectation of 5.6%. Industrial production rose 6.3% yoy in June, up from 5.0% and beat expectation of 5.2%. Retail sales jumped 9.8% yoy, up from 8.6% yoy and beat expectation of 8.5% yoy. Surveyed unemployment rate rose from 5.0% to 5.1%.
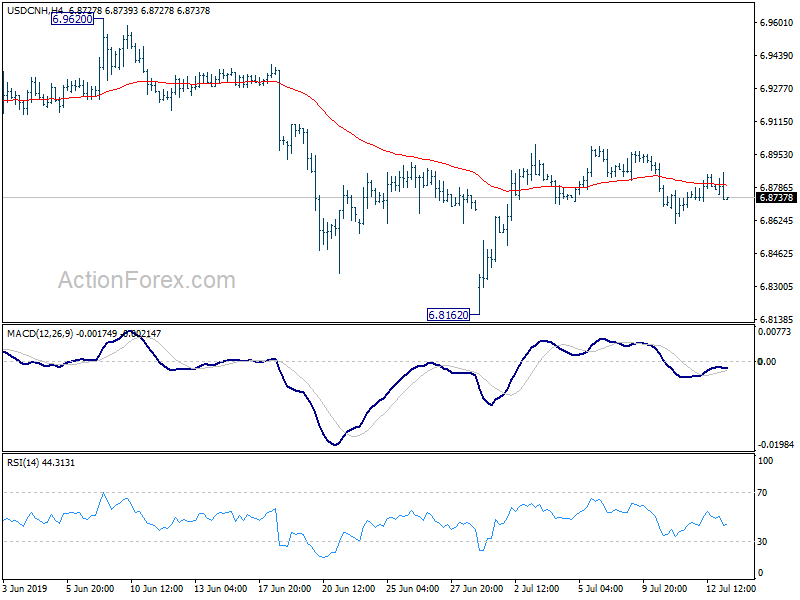
USD/CNH (offshore Yuan), dips mildly in Asian session but that's mainly due to mild weakness in Dollar. Recent consolidation from 6.9620 is still in progress and would extend further in range.
Aussie Steady As China Growth Slows
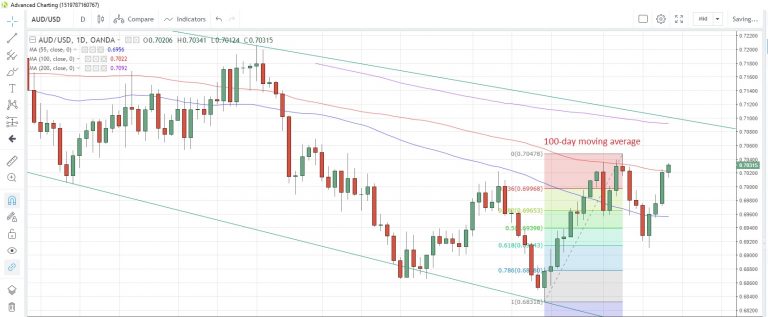
AUD/USD holds near 10-day highs
The AUD/USD FX pair held steady near 10-day highs after the Chinese economy showed signs of slowing in the second quarter. Q2 growth was 6.2% y/y, a slowdown from Q1’s 6.4% and the lowest growth recorded in 27 years as the impact of the US-China trade war increased.
In comments after the data release, China’s National Bureau of Statistics admitted that China “faces more external uncertainties an instabilities while the domestic economy faces new downward pressure”. For the first half of the year, capital formation made up 19.2% of GDP growth while net exports reached 20.7%.
AUD/USD Daily Chart
Other data beat forecasts
In other data released today, industrial production rose 6.3% y/y in June, beating estimates of a 5.2% gain and the fastest expansion in three months. Retail sales also came in better than expected, rising 9.8% y/y, which was the biggest gain since March 2018, and accelerating from May’s 8.6% while also beating forecasts of an 8.3% increase. Fixed asset investment also showed an upturn with a 5.8% y/y increase year-to-date, an increase from 5.6% posted in May.
Latest RRR cut implemented
In other China-related news, the central bank implemented its third phase of cuts to the Reserve Ratio Requirement which was announced on May 6. It is estimated that the cut would free up about 100 billion yuan of previously tied up capital. The first phase took place on May 15, the second on June 16 and the third one today, releasing a total of 300 billion yuan of liquidity.
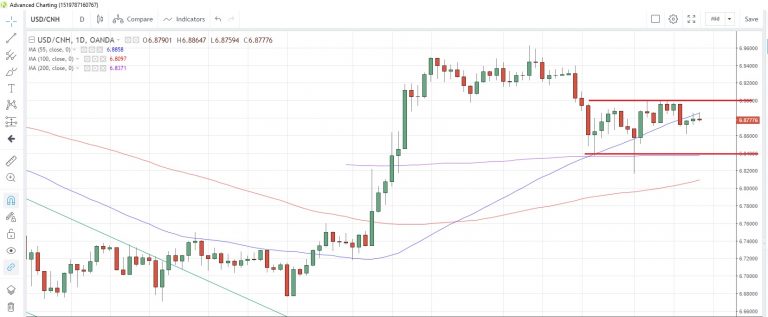
USD/CNH has traded modestly today, holding just below the 55-day moving average at 6.8858 while being confined to a broader 6.84-6.80 range for the past month.
USD/CNH Daily Chart
Slow data calendar for the rest of today
There are no data releases scheduled for the European session and for the North American session there is only the Empire State manufacturing index for July on tap. That is expected to rebound from -8.6 in June to +0.5.
GBP/USD And EUR/GBP: British Pound Remains Supported
GBP/USD gained traction and climbed above the 1.2500 and 1.2550 resistance levels. EUR/GBP declined below 0.8980 and it seems like it could continue to correct lower.
Important Takeaways for GBP/USD and EUR/GBP
- The British Pound is trading with a positive bias above the 1.2520 support area.
- There is a major bullish trend line forming with support near 1.2540 on the hourly chart of GBP/USD.
- EUR/GBP broke the key 0.8980 support level and it seems like the pair might even break 0.8950.
- There was a break below a major bullish trend line with support near 0.8970 on the hourly chart.
GBP/USD Technical Analysis
The British Pound formed a strong support base near the 1.2450 this past week against the US Dollar. As a result, the GBP/USD pair started a decent upward move and broke the key 1.2500 resistance level.
It gained traction above the 1.2520 pivot level and settled above the 50 hourly simple moving average. Finally, there was a break above the 1.2550 level and the pair traded close to the 1.2580 level.
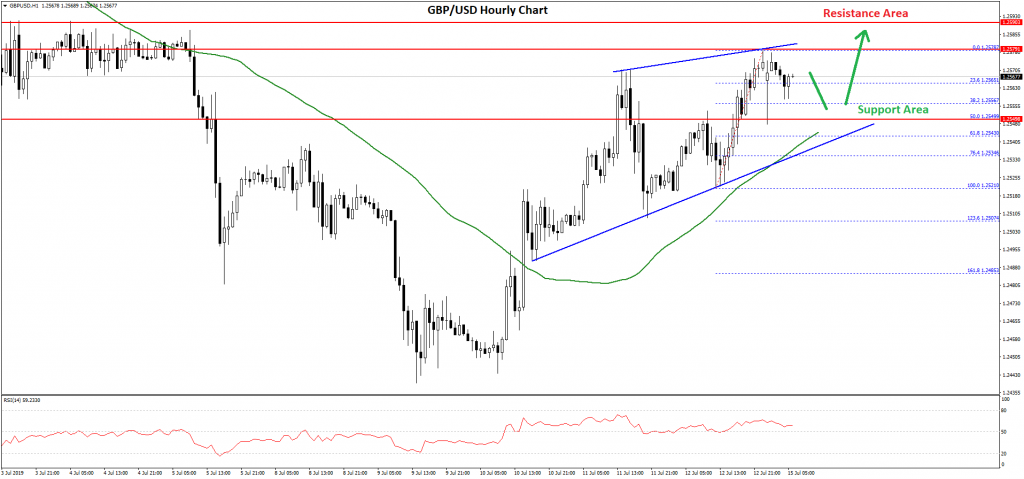
A swing high was formed near 1.2578 on FXOpen and the pair recently started a downside correction. It broke the 23.6% Fib retracement level of the last wave from the 1.2521 low to 1.2578 high.
However, losses are limited and the pair remains well supported above the 1.2550 and 1.2540 levels. There is also a major bullish trend line forming with support near 1.2540 on the hourly chart of GBP/USD.
Moreover, the 50% Fib retracement level of the last wave from the 1.2521 low to 1.2578 high is near the 1.2550 level to act as a support. If there is a downside break below the trend line, the pair could test the 1.2520 or 1.2500 support level.
On the upside, an immediate resistance is near the 1.2580 level. If there is an upside break above the 1.2580 level, the pair may even attempt to clear the main 1.2600 resistance area in the coming sessions.
EUR/GBP Technical Analysis
The Euro failed to hold gains above the 0.9000 level against the British Pound. The EUR/GBP pair topped near the 0.9010 level and recently started a downward move below the 0.9000 level.
The pair broke the 0.8980 support level and the 50 hourly simple moving average to enter a bearish zone. During the decline, there was a break below a major bullish trend line with support near 0.8970 on the hourly chart.
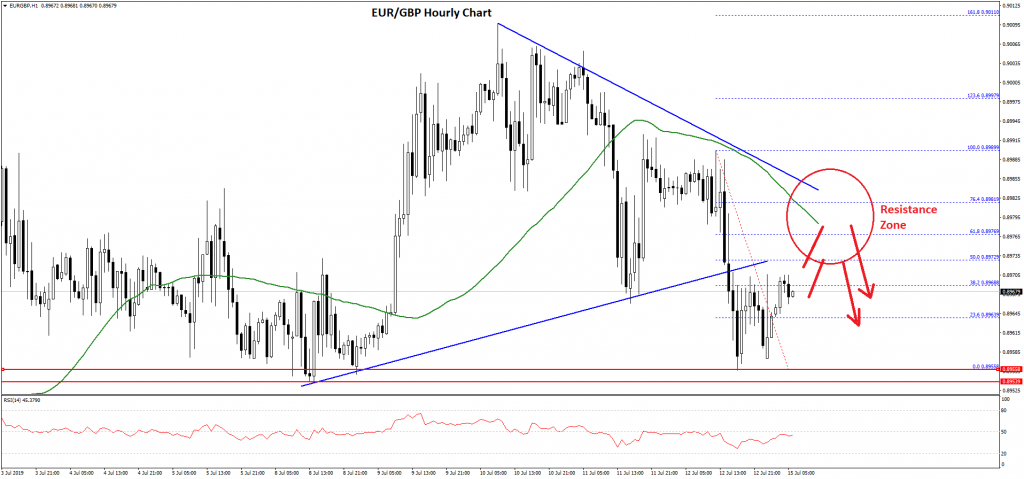
The pair traded close to the 0.8950 level and a swing low was formed at 0.8955. The pair is currently correcting higher above the 23.6% Fib retracement level of the last decline from the 0.8989 high to 0.8955 low.
On the upside, there is a strong resistance forming near the 0.8980 level and the 50 hourly simple moving average. An immediate resistance is near 0.8972 plus the 50% Fib retracement level of the last decline from the 0.8989 high to 0.8955 low.
However, the main resistance is near the 0.8980 level, above which the pair could move back above the 0.9000 resistance area in the near term.
Conversely, if EUR/GBP fails to climb above 0.8972 or 0.8980, it could resume its decline. On the downside, the main support is near the 0.8950 level, below which the pair could test the 0.8920 support.
Market Morning Briefing: Pound Has Moved Further Higher And Is Heading Towards 1.2600 As Expected
STOCKS
The rally in the Dow is gaining momentum and is retaining our bullish view intact. DAX is heading towards a key support and can reverse higher again. Shanghai continues to trade sideways and the bias remains bullish to see an upside break of this range. India's Sensex and Nifty can consolidate before falling further.
As expected Dow (27332.03, +243.95, +0.90%) has surged breaking above 27000 and is heading towards 27500 in line with our expectation. A pull-back to 27200-27000 is possible before the current rally extends targeting 28000.
DAX (12323.32, -8.8, -0.07%) remains subdued and is inching lower to test the 12300-12250 support zone. We expect the DAX to bounce from this support zone and resume its overall uptrend targeting 12800-13000 over the medium term.
Nikkei (21685.90) is closed today on account of a public holiday.
Shanghai (2925.50, -5.05, -0.17%) continues to consolidate between 2900 and 2950 as expected. We retain our bullish view and expect the index to breach 2950 and rally to 3000 in the coming days.
Sensex (38736.23, -86.88, -0.22%) and Nifty (11552.50, -30.40, -0.26%) struggles to gain momentum. The broader bias is bearish. However, the indices can consolidate sideways in the range of 38400-39100 (Sensex) and 11450-11650 (Nifty) before targeting 38100-38000 (Sensex) and 11400-11350 (Nifty) on the downside.
COMMODITIES
Commodities like gold, silver and copper are consolidating. The recent upmove in oil seems to be losing steam and pull-back looks possible in the coming days.
Gold (1408) sustains above 1400 and remains mixed in the near term. As we mentioned earlier, gold can consolidate in a broad range of 1380 and 1440 for some time before we see a fresh rally towards 1460 and higher levels.
Silver (15.17) on the other hand can trade between 14.90 and 15.50.
Copper (2.70) can consolidate between 2.60 and 2.75. Within this range, the near-term view remains bullish to test 2.73-2.75 on the upside.
Brent (66.48) is struggling to rise past 67 decisively. While below 67, a fall to 65 and 64.5 is possible in the coming days. The possibility of a rise to 68 that we were expecting last week seems to be reducing now.
Nymex WTI (59.90) can dip to 59 in the coming sessions. A strong rise past 61 is needed to bring back the bullish view of testing 62 on the upside which we were expecting last week.
FOREX
Dollar can see an intermediate bounce but could be short-lived and the weakness is likely to come back again. The majors like the Euro, Aussie, Yen and Pound continue to remain bullish in the near term. Dollar-Rupee has risen above the key resistance level of 68.60 and can test 68.80 on the upside.
Dollar Index (96.85) can find support at 96.70 and see an intermediate bounce to 98. But the upside is likely to be capped at 97 and the index can reverse lower again targeting 96.50 and 96.25 on the downside.
Euro (1.1266) has been oscillating around 1.1250. The bias on the chart is bullish to test 1.1300 and 1.325. As mentioned earlier, a break above 1.1285 will trigger this rise.
Dollar-Yen (107.95) has bounced but has strong resistances at 108.25 and 108.50 which can restrict the upside and keep the pair pressured on the downside to test 107.5 and 107 on the downside in the coming days.
Euro-Yen (121.69) remains mixed within its 121-123.5 sideways range and can fall to the lower end of this range if it breaks below 121.5.
Aussie (0.7026) has risen towards 0.7025 as expected and remains bullish to test 0.7060 on the upside.
Pound (1.2550) has moved further higher and is heading towards 1.2600 as expected. We expect the current corrective fall to halt in the 1.2600-1.2625 region and the broader downtrend can resume thereafter.
USDCNY (6.8771) has resistance at 6.88 which can cap the upside and drag the pair lower to 6.86 again. As we have been mentioning, while below 6.88, the outlook is bearish to test 6.84-6.83 on the downside in the coming days.
Dollar-Rupee (68.6850) can test 68.80 on the upside from where a pull-back to 68.50 is possible. But a break above 68.80, if seen immediately will pave way for 69 and even 69.25.
INTEREST RATES
The US Treasury yields have risen across tenors as it is getting support from the inflation numbers released last week. The German yields are trading mixed. The yields at the near-end remains subdued while the far-end are moving higher. The Indian 10Yr GoI lacks momentum and looks vulnerable for further fall.
The US Treasury yields have risen sharply across tenors on Friday. Following the rise in Core-CPI numbers on Thursday, the Core-PPI numbers released on Friday provided additional support for the yields. The Core-PPI increased 0.34% (MoM) in June from 0.17% a month ago while the YoY dipped slightly to 2.25% from 2.26% over the same period.
The US 2Yr (1.85%) and 5Yr (1.87%) Treasury yields were up 4bps and 5bps respectively while the 10Yr (2.12%) and 30Yr (2.65%) were up 7bps each. The Treasury yields can rise further in the near term. The 10Yr can test 2.20% and 2.25% while the 30Yr can test 2.70%-2.75% on the upside in the coming weeks.
The German yields continue to trade mixed. The yields continue to dip in the near-end while on those at the far end are moving higher. The 2Yr (-0.75%) and 5Yr (-0.58%) have dipped slightly while the 10Yr (-0.21%) and 30Yr (0.38%) have moved up. The yields at the far end can move further higher in the coming days. The 10Yr can test -0.15% and -0.13% while the 30Yr has room to surge towards 0.50% in the coming weeks.
The 10Yr GOI (6.4880%) seems to lack momentum to bounce-back above 6.50% decisively. This leaves the broader picture negative. Resistance is at 6.54% and while below it the 10Yr GOI can test 6.35% on the downside in the coming days.