

Sample Category Title
The US Dollar Is Still Under Pressure. Investors Expect Additional Drivers
On Friday, the US dollar fell against a basket of major currencies. The US currency is under pressure due to "dovish" comments by Fed Chairman, Jerome Powell. The official pointed to the Fed's willingness to cut the base interest rate later this month in order to support the economy amid the weakening of global growth and uncertainty concerning trade disputes. The US dollar index (#DX) closed in the negative zone (-0.25%).
Today, during the Asian trading session, optimistic statistics from China have been published. GDP growth in the country in the 2nd quarter met market expectations and counted to 6.2% (y/y). GDP (q/q) accelerated to 1.6% from 1.4%. Industrial production rose by 6.3% in June instead of the forecasted value of 5.2%. These economic releases supported the Australian and New Zealand dollars.
The "black gold" prices stabilized after significant growth last week. At the moment, futures for the WTI crude oil are testing the mark of $60.15 per barrel.
Market Indicators
On Friday, the bullish sentiment was observed in the US stock markets: #SPY (+0.45%), #DIA (+0.91%), #QQQ (+0.58%).
The 10-year US government bonds yield rose slightly. Currently, the indicator is at the level of 2.11-2.12%.
The News Feed on 2019.07.15:
Today, the publication of important economic news is not expected. The financial markets of Japan are closed due to the holiday.
BTCUSD Rises To Pare Negative Gap, Lacks Direction In Near Term
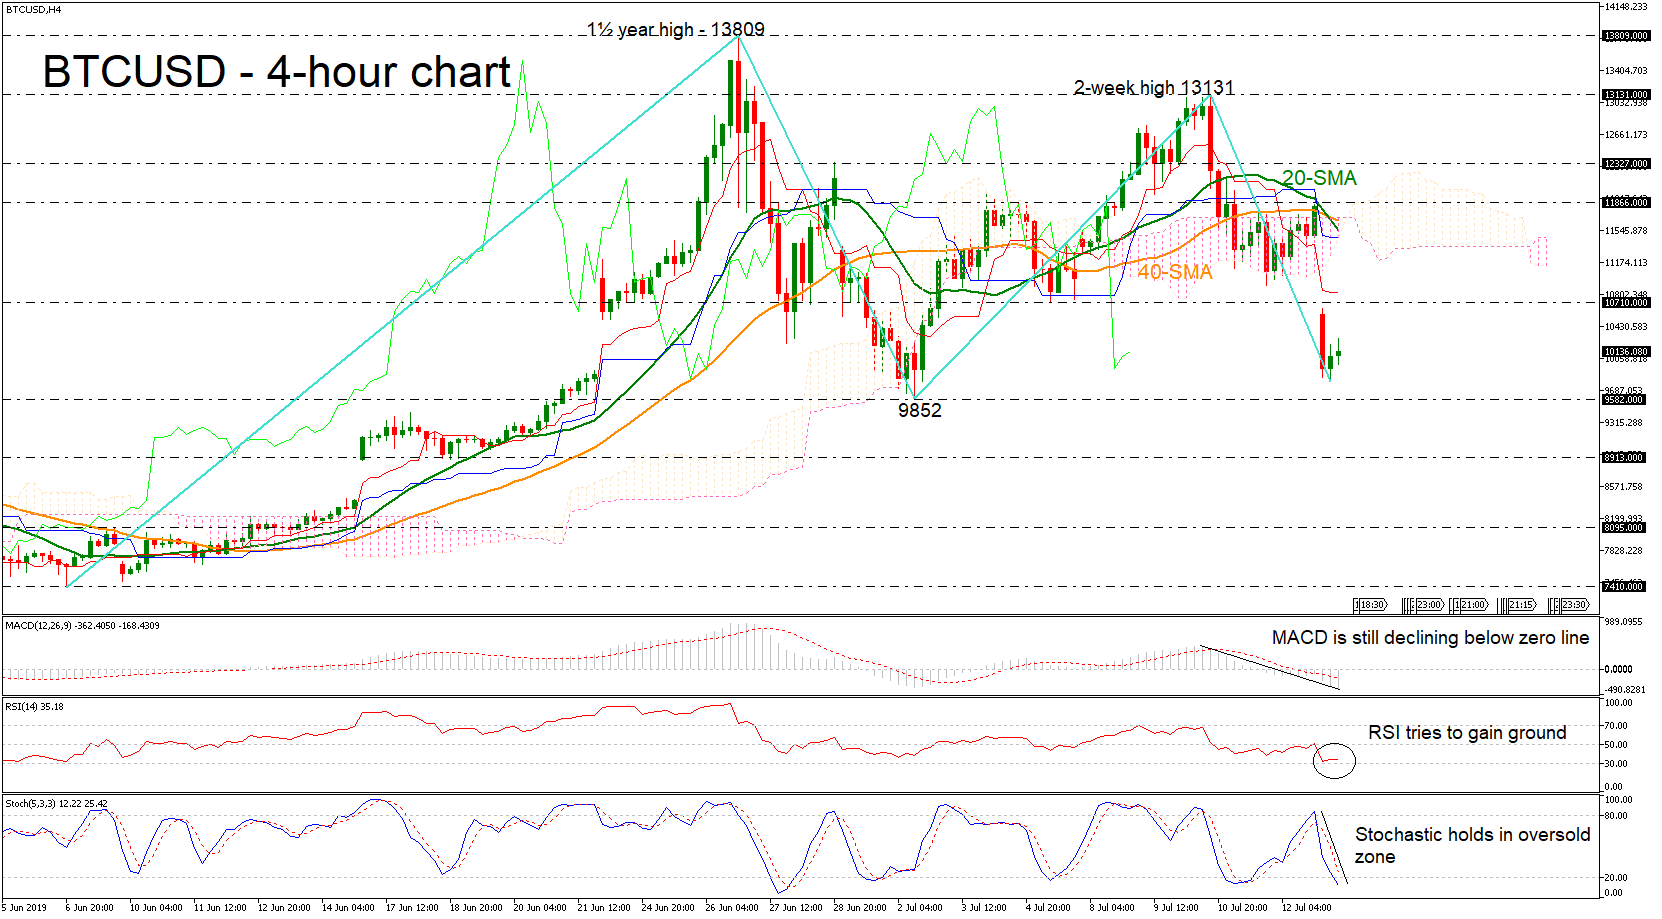
BTCUSD opened with a noteworthy negative gap today, posting a fresh almost two-week low near 9792.
The price dived below the Ichimoku cloud but is currently trying to pare some of today’s losses. The MACD oscillator is moving even lower below the zero and trigger lines, while the stochastic is holding in the oversold territory. However, the RSI indicator is heading higher, confirming the bullish move in the price action.
More gains could send the price towards the 10710 resistance level, taken from the inside swing bottom on July 5, while a successful attempt above this level, could endorse the scenario for bullish recovery of the gap until the short-term moving averages near 11600.
On the downside, the 9582 support level is coming into focus before bitcoin rest around the 8913 hurdle, identified by the low on June 18.
Summarizing, BTCUSD is looking cautiously neutral in the short-term as it has lacked direction over the last three weeks.
EUR/AUD 4H Chart: Might Edge Lower
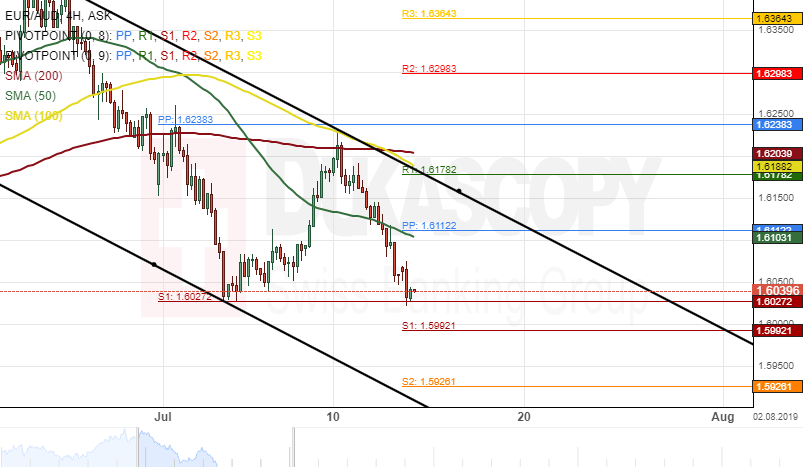
The EUR/AUD currency pair has been trading down since the middle of June when the pair reversed south from the upper boundary of a descending channel pattern at 1.6407.
Currently, the currency pair is testing a support level formed by the monthly S1 at 1.6027.
If the pair passes the support level, Bears could drag the currency exchange rate towards the bottom border of the channel pattern at 1.5858 during the following trading sessions.
Although, if the pair fails to pass the monthly S1, Bulls might dominate this week's trading sessions.
EUR/CAD 4H Chart: Breakout Might Occur
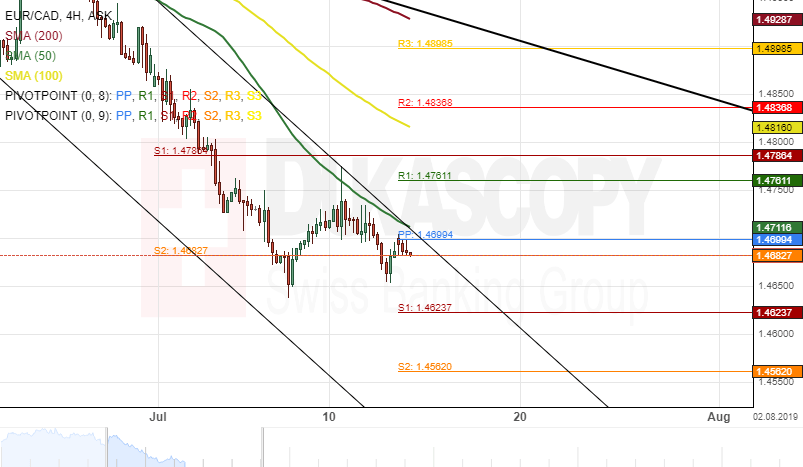
The single European currency has been depreciating against the Canadian Dollar since the beginning of June. This southern movement has been bounded in a descending channel pattern.
Currently, the exchange rate is trading near the upper boundary of the descending channel pattern and could be set for a breakout.
If this breakout occurs, bullish traders could aim for a resistance cluster at 1.4899 within this week's trading sessions.
However, a resistance level formed by the weekly pivot point and the 50-hour simple moving average at 1.4699 could hinder bulls from pushing the currency exchange rate up.
Why Is Gold Price Still Strong?
Gold price has given up some of its gains after better than expected Chinese economic numbers. The People Bank of China has been providing its full support for the economy and this backing has saved the day for China. However, the economic data did show that the Chinese economic growth has slowed to the weakest pace since 1992. The Chinese GDP q/q number of 6.2% clearly shows that the on going trade war has left a massive dent in the economic growth of the country. Having said this, the factory output and retail sales numbers have beaten estimates and this has brought some risk on appetite among investors.
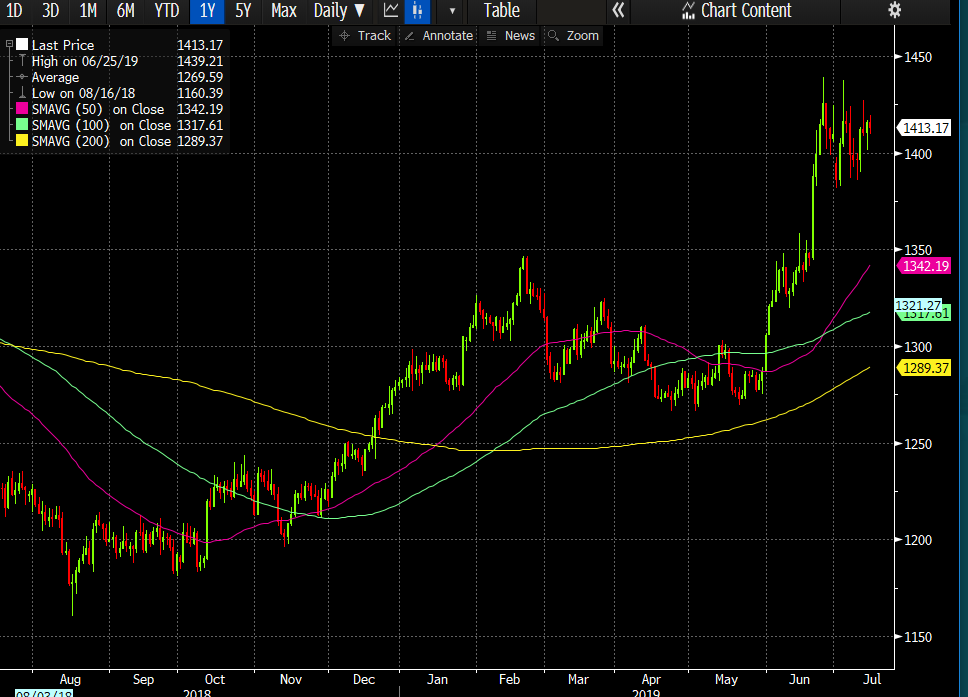
Despite this, the gold price is still trading near the highest level in nearly six years and I do not think that the trend isn’t going to change anytime soon because the Fed has once again adopted the loose monetary policy. The Fed is under pressure to cut the interest rate this year in order to support inflation and this means weaker dollar.
As for the big bets, money managers have scaled back their positions in gold. According to the recent CFTC data, bullish bets dropped to 24,021 from a previous level of 217,142. This is despite the fact that geopolitical tensions are still high. France, Germany and the UK have increased pressure on Iran to act responsively in relation to its commitment (made back in 2015 about the international nuclear agreement).
From a technical perspective, the price is still looking solid. On a daily time frame, the price is trading above the 50-day, 100-day and 200-day moving averages. This confirms that the price is trading in an uptrend and as long as the price stays above this, bulls have very little reason to worry about anything.
EUR/JPY Sell Signals Today
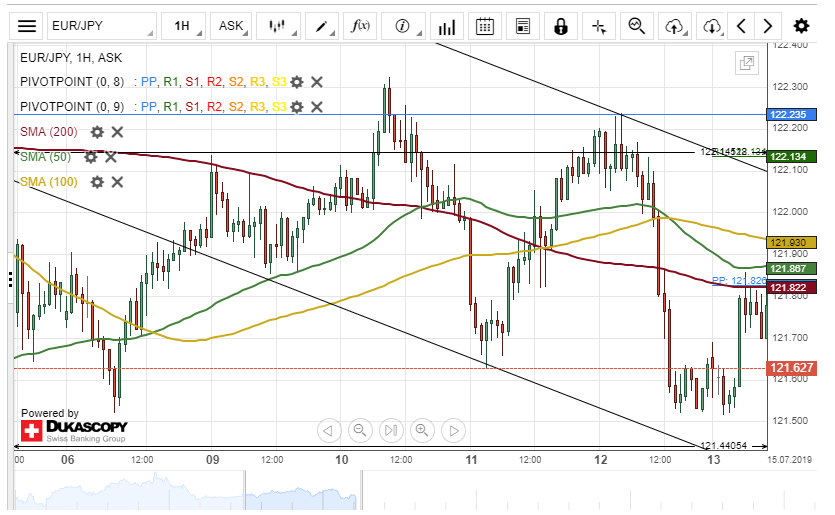
The Eurozone single currency depreciated about 73 base points against the Japanese Yen on Friday. The decline began after the currency pair tested a resistance level formed by the monthly pivot point at 122.23.
Technical indicators flash sell signals on both the smaller and the larger time-frame chart. Therefore, it is likely that the EUR/JPY exchange rate will continue its downward movement within this session.
Although, if the currency exchange rate passes the weekly PP and the combination of the 50-, 100– and 200-hour SMAs today, a surge towards the weekly R1 at 122.13 could occur.
AUD/USD Likely To Maintain Channel
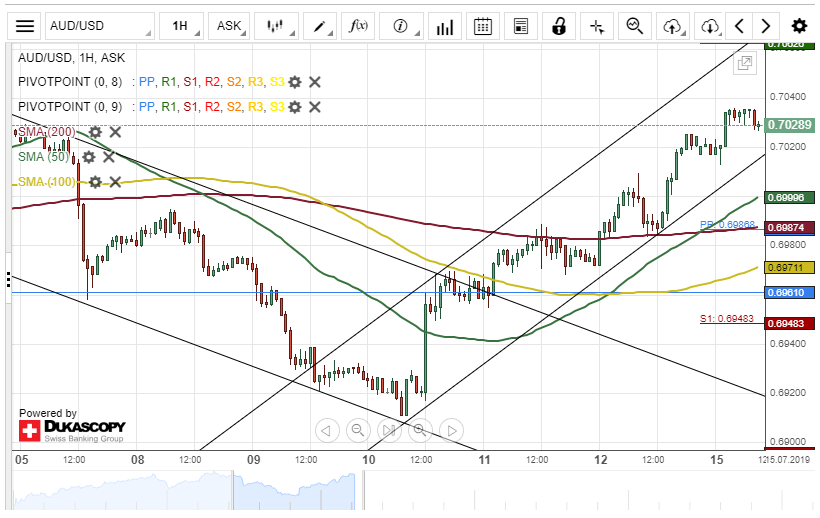
The Australian Dollar has been appreciating gradually against the US Dollar since July 10. The currency pair bounced off from the bottom border of a narrow ascending channel at 0.6911 on July 10 and had since gained about 1.83% in value during the short period.
Most likely, the AUD/USD exchange rate will maintain the narrow ascending channel pattern today.
The currency exchange rate might aim for a swing high at 0.7046 within this session, and thereafter, makes a brief retracement during the following trading session
USD/CAD Decline Likely To Continue
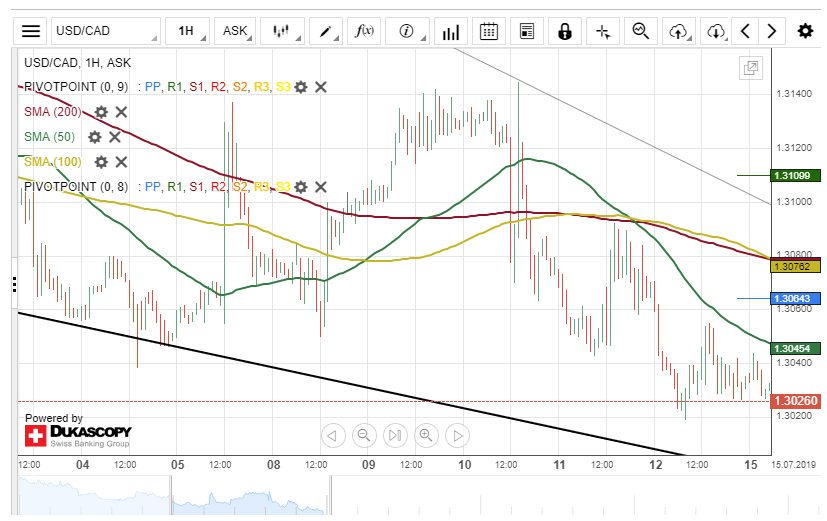
The US Dollar depreciated about 48 base points against the Canadian Dollar on Friday. The currency pair was pressured south by the 50-hour simple moving average during the previous trading session.
Everything being equal, it is likely that the USD/CAD exchange rate will continue its southern movement within this session. The potential target will be near the weekly S1 at 1.2983.
If the support level formed by the weekly S1 holds, a possible upside reversal could occur during the following trading session.
NZD/USD Could Edge Higher
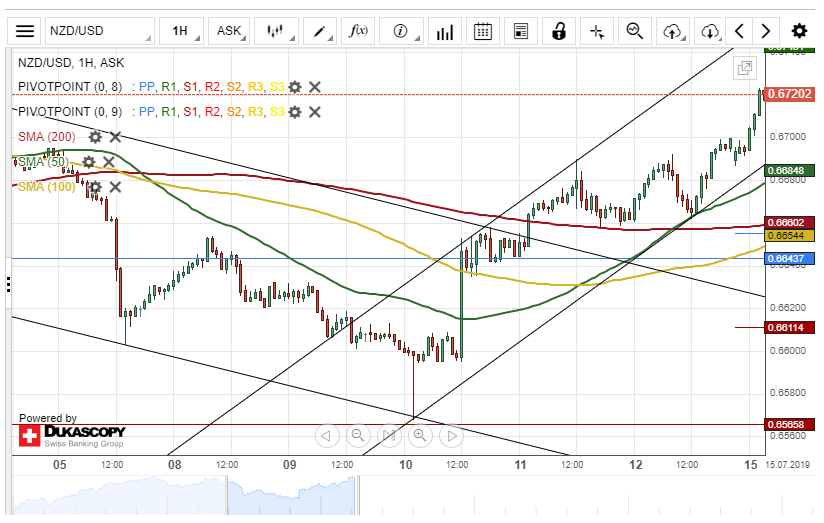
The NZD/USD currency pair has been trading up since July 10 after the pair made a U-turn from the lower boundary of a narrow ascending channel pattern at 0.6565.
As for the near future, it is likely that the New Zealand Dollar will maintain the channel pattern against the US Dollar. The potential target for bullish traders will be the 0.6759 area.
If the resistance level at 0.6759 holds, the currency exchange rate could make a brief retracement down today.
Meanwhile, technical indicators suggest that the pair will continue its upside movement within this session.
China Weak GDP Print, CHF In Demand
China weak GDP Print
Optimistic outlook took a hit today as China's economic growth showed to have slowed to 6.2% y/y in 2Q from 6.4% y/y in 1Q. This was the slowed pace in 27 years (1992). Markets took a bit of comfort in China's decent retail sales, capital spending, and industrial production data. Last week, China's export growth slowed from 1.1% y/y in May to -1.3% in June. Yet the steady pace of slowdown continuing as threats of a trade war and slowing global and domestic demand is taking a toll on China outlook. This fall will increase pressure on the People's Bank of China (PBoC) to further ease and continue with unconventional measures to support the economy. Expectations for the PBoC to wait for signal a new easing bias until the Fed has lowered interest rates are relevant only because the FOMC and forecast 25bp cut, is just around the corner. In reality, the PBoC needs to act and not just with micro tunings such as targeting RRR cuts and medium-term lending facility. Elsewhere, data indicates China has been a net seller of Treasuries for two consecutive months, with total holdings falling to a two year low. Part of this fall is based on revaluation and lower organic demand for USD but there should also consider a political motivation. Clearly, Chinas massive US bond buying operation and low cost funding provides leverage in US-China tariff war.
Safe-haven CHF in demand despite China's upbeat data
There seems to be certain market contradictions happening right now after Chinese data beat estimates this morning. Asian equities are in green territory, with Hong Kong Hang Seng, China mainland CSI 300 and Nikkei 225 rising up to +0.29%, +0.41% and +0.20% respectively, thus pointing to a rising session for equities. Meanwhile the foreign exchange points to similar ends, with trade-reliant currencies grinding higher and safe-haven JPY flat, unlike CHF, which appears to gain traction as shown by EUR/CHF and USD/CHF pairs.
Both USD/CHF and EUR/CHF supports at 0.972 (24/06/2019 low) and 1.10795 (24/06/2019 low) could well be broken if current trend is maintained. There is currently no clear signs of Swiss National Bank market intervention yet, but that could well change if a clear appreciation trend emerges despite optimistic views on the market.