Sample Category Title
Market Morning Briefing: Dollar-Yen Is Almost Stable And While Resistance Near 108.50 Holds
STOCKS
Equities like the Nikkei, Shanghai and DAX remain broadly positive. Dow has room on the upside, but a crucial resistance is coming up which can halt the current rally and trigger a corrective fall. Sensex and Nifty are likely to consolidate sideways with a bearish bias.
Dow (27359.16, +27.13, +0.10%) is inching higher towards 27500 as expected. The level of 27500 is a strong resistance which can trigger a pull-back to 27200-27000 initially. The possibility of this corrective fall extending beyond 27000 towards 26500 or even lower levels cannot be ruled out.
The support in the 12300-12250 zone is holding well as expected and DAX (12387.34, +64.02, +0.52%) has bounced after testing 12300. A strong rise past 12450 is needed to gain momentum and revisit 12600 levels. While 12450 holds, DAX can dip to 12300 again and even test 12250 on the downside.
Nikkei (21525.64, -160.26, -0.74%) has dipped within its 21500-21750 sideways range. We need to wait for a breakout on either side of 21500 or 21750 to get a clear cue on the next leg of move. We prefer the index to break 21750 and rise to 22000.
Shanghai (2940.17, -2.01, -0.07%) is holding well above 2900 and keeps our bullish view intact to break 2950 and rise to 3000 in the coming days. While 2950 holds, it can consolidate sideways between 2900 and 2950 for some more time.
Sensex (38896.71, +160.48, +0.41%) and Nifty (11588.35, +35.85, +0.31%) have inched higher yesterday but seems to lack momentum. The resistance at 39100 on the Sensex and 11650 on the Nifty are likely to hold and keep them in a sideways range of 38400-39100 and 11450-11650 respectively. The broader view remains bearish for the Sensex to break 38400 and the Nifty to decline below 11450.
COMMODITIES
Commodities are overall stable and could see some sideways movement while most of them have crucial resistances above current levels. An eventual dip in the longer term would be preferred after some ranged movement in the near term.
Gold (1414.90) is trading above immediate support at 1410 which if holds could take the price towards 1440 on the upside before coming off from there. However, our view of sideways consolidation within the broad 1380-1440 region remains intact.
Silver (15.39) is seeing a contraction in movement as seen on the daily candles. It could test 15.40/45 on the upside before falling back from there towards 15.10. On the 3-day candles, 15.50 is a crucial resistance and has the potential to push prices towards 15.0 or even 14.50 in the longer run.
Copper (2.7110) has dipped slightly from immediate resistance just below 2.72. while that holds, copper could dip towards 2.66/64 in the next few sessions. However on the weekly candles, there is scope for testing 2.75/80 on the upside within the next 2 weeks.
Brent (66.43) has dipped slightly and could test 64.50 before re-attempting a rise towards 68 again. Above 68, 69-70 could act as important resistances in the longer run.
Nymex (59.45) could test 59.0-58.50 in the near term before rising towards crucial resistance at 62.
FOREX
Dollar Index (96.93) has risen slightly and while above immediate support at 96.50, the index could attempt to test 97.20 in the near term. However, Dollar Index could eventually drop towards 96 in the next 1-2 weeks indicating that any immediate bounce from current levels could be short lived.
Euro (1.1261) is likely to hold below 1.13 in the near term falling back towards 1.1225. A sustained rise above 1.13-1.14 is needed in the longer run to take the Euro higher. Immediate view is bearish while 1.13 holds.
Dollar-Yen (107.94) is almost stable and while resistance near 108.50 holds, Dollar-Yen could fall towards 107.50. Immediate trade is likely to b seen within 107.50-108.50
Euro-Yen (121.57) is trading above immediate support at 121 and could rise towards 122.50 in the near term.
Aussie (0.7037) could face rejection from 0.7050/60 which could push Aussie towards 0.695 again in the near term. View is bearish for the coming sessions.
1.26 is an important resistance above current levels on Pound (1.2516). If that holds, Pound could dip back to 1.25 in the near term. A sustained rise above 1.26 is required to take the Pound higher and initiate a fresh rally towards 1.28. For now watch price action near 1.26
USDCNY (6.8744) could be capped at 6.88 on the upside as mentioned yesterday. An eventual dip towards 6.84/83 could be on the cards for the near term.
USDINR (68.54) dipped slightly yesterday in line with our expectation. Broad range of 68.25-68.80 could work for the near term. While above 68.50, it could re-attempt a test of 68.80 on the upside.
INTEREST RATES
The US and German Yields have come-off after a strong surge last week. Both the US and the German yields can see some dip in the near-term and then possibly reverse higher again. The Indian 10Yr GoI has dipped below a key support and has room to test 6.35% on the downside.
The rally in the US Treasury yields take a breather. The Treasury yields have dipped across tenors. The 2Yr (1.82%), 10Yr (2.08%) and 30Yr (2.61%) were down 4 bps each while the 5Yr (1.84%) was down 3 bps. The 10Yr has support in the 2.05%-2.00%. While this support holds, a strong rise past 2.10% again will pave way for a further rise to 2.20% and even higher levels in the coming weeks. The 5Yr can test its support at 1.80% and can reverse higher targeting 2% on the upside.
The German yields were also down across tenors yesterday. The 2Yr (-0.75%) and 5Yr (-0.60%) were down 3 bps each while the 10Yr (-0.26%) dipped 1 bps. The 30Yr (0.32%) German Yield which had surged at a much faster pace last week was down sharply by 6 bps. The 30Yr can dip further to 0.28%-0.26% and then reverse higher again.
The 10Yr GOI (6.4327%) has declined further as expected and is now trading below the support level of 6.45%. The near-term bearish view remains intact to test 6.35% on the downside after which a bounce is possible.
GBP/USD Recovery Approaching Key Juncture
Key Highlights
- The British Pound recovered recently after trading as low as 1.2439 against the US Dollar.
- GBP/USD is now struggling below the 1.2580 resistance and a bearish trend line on the 4-hours.
- The NY Empire State Manufacturing Index increased from -8.6 to 4.3 in July 2019.
- The UK Claimant count in June 2019 could change by 18.9K, less than the last 23.2K.
GBPUSD Technical Analysis
After a strong decline, the British Pound found support near 1.2440 against the US Dollar. The GBP/USD pair started a short term correction above 1.2500, but it is facing a lot of hurdles on the upside.
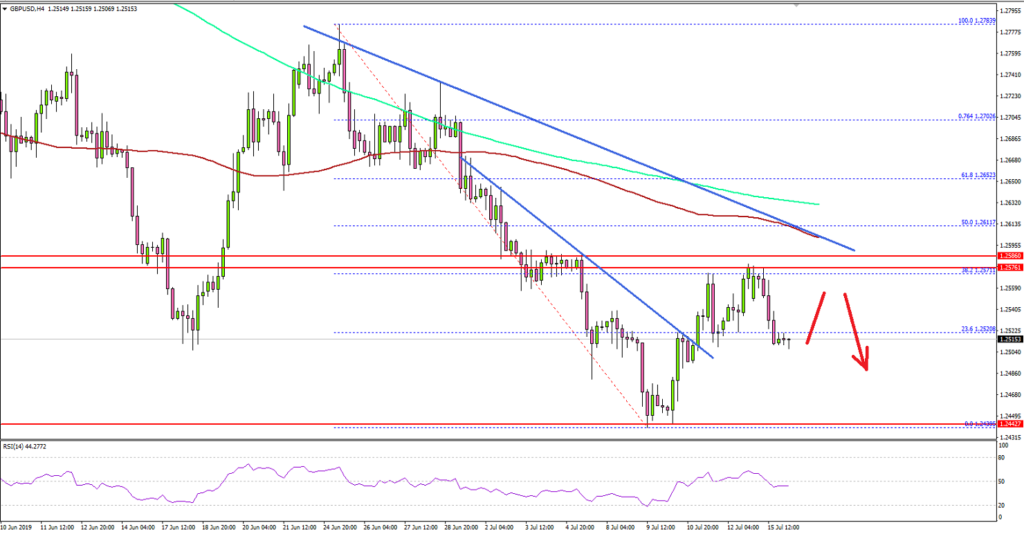
Looking at the 4-hours chart, the pair traded as low as 1.1438 and recently corrected above the 1.2500 and 1.2520 resistance levels. Besides, there was a break above a connecting bearish trend line at 1.2505.
The pair extended its recovery above 1.2540 plus the 23.6% Fib retracement level of the downward move from the 1.2783 high to 1.2439 low. However, the pair struggled to clear the 1.2575-1.2580 resistance area.
Moreover, there is a strong resistance forming near the 1.2580-1.2600 area plus a bearish trend line on the same chart. Besides, the 100 simple moving average (red, 4-hours) is positioned near the 50% Fib retracement level of the downward move from the 1.2783 high to 1.2439 low.
Therefore, the 1.2580 and 1.2600 levels are likely to act as significant resistances if the pair continues to rise. A successful close above 1.2600 and the 100 SMA might start a strong upward move in GBP/USD towards the 1.2650 and 1.2700 levels.
Conversely, if there is no upside break above the 1.2600 resistance, the pair could resume its decline. An immediate support is at 1.2500, below which there is a risk of more losses towards 1.2440.
Fundamentally, the NY Empire State Manufacturing Index for July 2019 was released by the Federal Reserve Bank of New York. The market was looking for a rise from -8.6 to 2.0.
The actual result was better than the market forecast, as the NY Empire State Manufacturing Index climbed higher sharply to 4.3 in July 2019.
The report added:
New orders were little changed, and shipments in-creased. Unfilled orders and inventories continued to move lower, while delivery times were longer. The employment index remained negative, falling to its lowest level in nearly three years.
Overall, GBP/USD could struggle to break the 1.2600 resistance area. Similarly, EUR/USD is facing a strong resistance near the 1.1300 area.
Economic Releases to Watch Today
- UK Claimant Count Change June 2019 – Forecast 18.9K, versus 23.2K previous.
- UK ILO Unemployment Rate May 2019 (3M) – Forecast 3.8%, versus 3.8% previous.
- German ZEW Economic Sentiment Index for July 2019 – Forecast -20.0, versus -21.1 previous.
- US Retail Sales June 2019 (MoM) – Forecast +0.2%, versus +0.5% previous.
Daily Markets Broadcast
Another record high
US indices consolidated and extended recent gains to touch new record highs yesterday. The earnings season gets under way again while phone talks between Washington and Beijing are set to resume this week.
US30USD Daily Chart
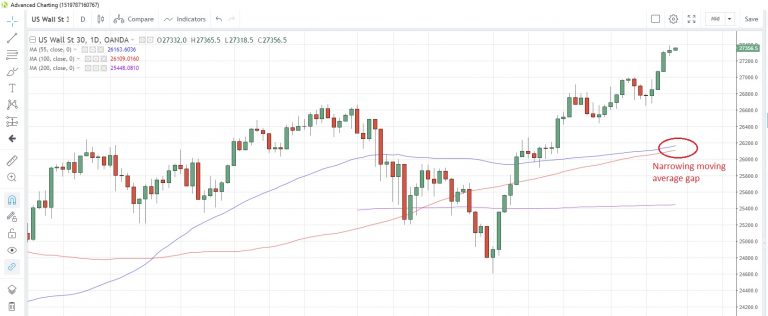
The US30 index extended the recent rally to a fourth day, rising to a new record high. It has started positively this morning
The 100-day moving average at 26,109 and the 55-day average at 26,163 are gradually converging and could crossover by the end of the month
The growth in US retail sales is expected to slow to +0.2% m/m in June after a 0.5% advance in May. Speeches from Fed’s Bostic, Bowman, Powell and Evans are scheduled.
DE30EUR Daily Chart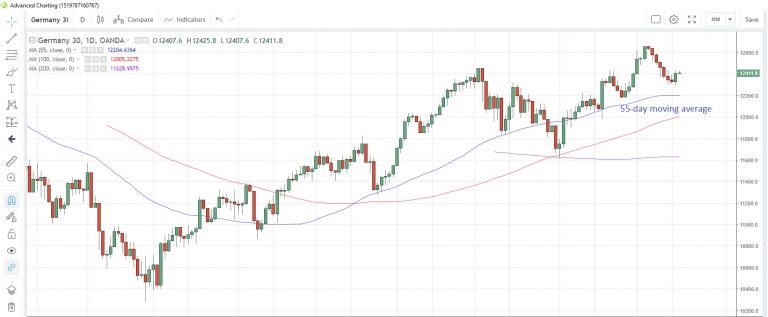
The Germany30 index snapped a seven day losing streak yesterday, boosted by Wall Street’s advance and some positive data points out of China
The index touched the lowest in 2-1/2 weeks before rebounding strongly . The 55-day moving average is at 12,205
The German ZEW sentiment surveys are expected to show a tiny improvement in July, though still with a negative bias. Estimates suggest a move to -20.0 from -21.1 the previous month.
WTICOUSD Daily Chart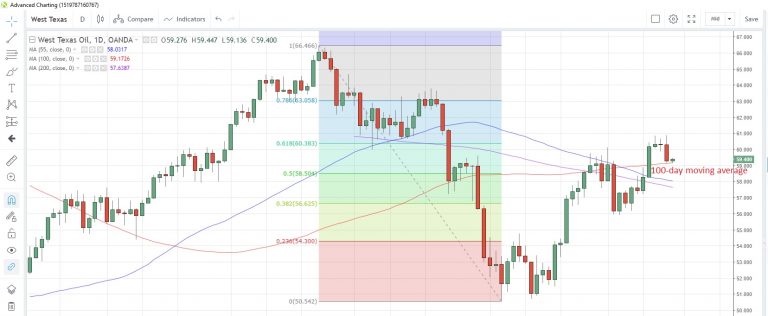
Crude oil prices retreated from 7-1/2 week highs yesterday, losing the most in nine sessions, as the threat from storm Barry, which had halted about 70% of production in the Gulf of Mexico, receded
Prices are currently sitting on the 100-day moving average at $59.17
Weekly stockpiles data from the American Petroleum Institute as at July 12 are due today. Last week saw a hefty drawdown of 8.13 million barrels, which boosted prices.
USD/CAD Canadian Dollar Lower On Lower Oil And Chinese Mixed Data
The Canadian dollar lost 0.15 percent at the start of the trading week versus the dollar. The loonie had little support from oil prices as weather disruptions in the Gulf of Mexico are clearing up.
The battle of the doves last week was won by the Fed, by outdoving the Bank of Canada (BoC) with its more pessimistic rhetoric and with the market fully pricing in a rate cut at the end of the month.
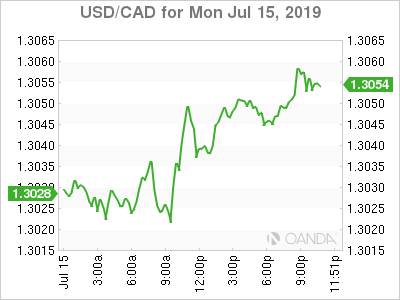
The loonie remains trade sensitive, and with the prolonged US-China trade war in the background, any mention of the USMCA from President Trump that is not a ratification announcement puts the currency on edge. Trump remarked today that if congress doesn’t pass the USMCA, he has a better deal. Given his predilection for tariffs the news was a factor in the loonie’s drop.
The US dollar was mixed on Monday as Chinese data painted a bleak scenario if the US-China trade war drags on for long. Commodity currencies were higher, specially the AUD and NZD as industrial production in China was one of the few highlights.
Chinese growth is on track for a 27 year low with the US-China trade dispute a major factor, but the Asian giant is also hit by weaker domestic demand and concerns of a frail financial system. Exports have been hit by the US tariffs and this disappointing data could be used as leverage by the US when trade talks pick up again in the short term.
Earnings season has begun, and investors are on the lookout for downgraded guidance from US companies to gauge how deep is the consumer feeling the US-China trade war.
The market anticipates the Fed to cut at least two times in 2019, with the first one most likely to come at the end of the month as per the FedWatch tool from the CME.
Oil prices fell on Monday after the weather disruptions will be temporary with operations in the Gulf of Mexico already getting back to work. Oil was caught in the mixed data from China. Higher industrial production was a positive for crude as it translates to higher demand for energy, but the overall growth slowdown of the economy was a negative.
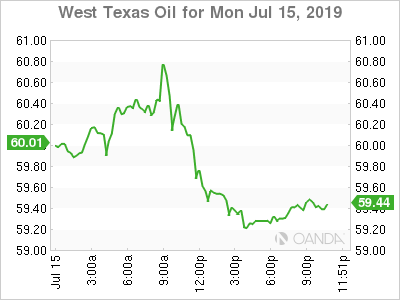
Iran issued a diplomatic speech where President Rouhani said that if US sanctions are lifted, they are ready to hold talks. This is a departure from the more aggressive tone of the previous week as the closure of Strait of Hormuz was mentioned.
Crude has been trading higher as supply disruptions for weather and geopolitical issues have influenced the pricing after the OPEC+ extended its production cut deal into 2020.
Gold keeps rising as the US dollar remains weak on the probability of an upcoming rate cut. The Fed was in full dove mode last week, with a 25 basis points fully priced in, but there could be a bigger cut if pressure from the White House for lower rates sooner rather than later.
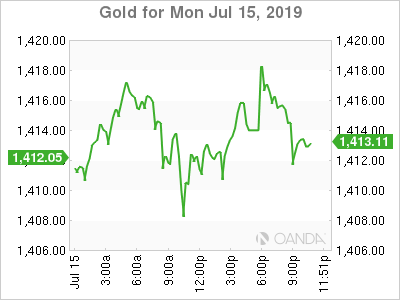
The yellow metal was not immune to the volatility after the Chinese economic data was released, but at the end of the day its status as a safe haven as a softer earnings season begins is keeping the metal above the $1,410 price level.
Trader anxiety was in full display as the US stock market was mixed on soft China GDP news and the start of what could be a terrible earnings season. Even though the US-China trade war has managed to avoid hitting consumers directly, there will be more negative guidance as there seems to be no deal in sight.
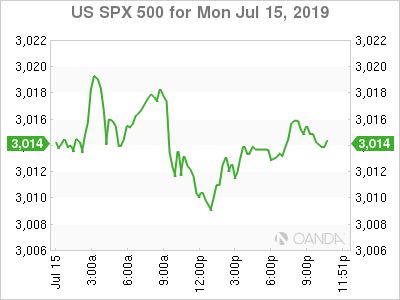
The U.S. Federal Reserve is expected to cut rates, and the overall dovish central bank contingent is keeping stocks hitting record highs, despite the data. The Fed will go the full 180 on rates, after hiking four times in 2018.
NZDUSD Faces More Strength On Corrective Upside Pressure
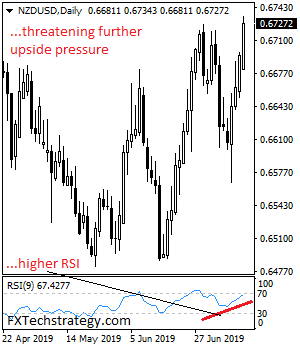
NZDUSD faces more strength on corrective upside pressure as more gain is likely in the days ahead. Resistance comes in at the 0.6750 level where a break will turn attention to the 0.6800 level. A break of here will have to happen to create scope for a move higher towards the 0.6850 level. Further out, resistance resides at the 0.6900 level. Its daily RSI is bullish and pointing higher suggesting further upside. Support stands at the 0.6700 level. Further down, the 0.6650 level comes in as the next downside target and then the 0.6600 level. All in all, NZDUSD faces more strength on corrective upside pressure
Eco Data 7/16/19
[php_everywhere instance="1"]
Canada: Home Sales Dip Modestly in June
- Existing home sales dipped 0.2% (m/m) in June, following May's 3% gain. This was only the second monthly decline this year, with the first being a weather-induced plunge in February.
- In Vancouver, sales declined by 5%. However, this only partially reversed May's 24% surge. Sales were mixed in other markets in B.C., increasing in Fraser Valley and Okanagan-Mainline (both up +2% m/m) and falling in Victoria (-2% m/m).
- Performances were weaker in the oil-producing provinces in June, with sales lower in Calgary (-4% m/m) and Edmonton (-0.3% m/m). However, sales were up in both markets in the second quarter overall. Sales also fell in Regina (-4% m/m) and Saskatoon (-3% m/m) during the month.
- Sales inched higher in Toronto (+0.2% m/m), the fourth straight monthly gain, as healthy fundamentals are supporting activity. Notably, single-detached sales are higher on a year-to-date basis in Toronto (through May), marking a stark contrast to the past few years. Excluding Toronto, sales were higher in Ontario, boosted by gains in London (+7% m/m) and Barrie (+5% m/m).
- Sales advanced 4% month-on-month in Quebec and were 11% higher year-over-year, as a robust economy continues to boost demand.
- Across the volatile Atlantic Provinces, sales were lower in each of New Brunswick (-6% m/m), Nova Scotia (-11% m/m), PEI (-0.6% m/m), and Newfoundland and Labrador (-23% m/m).
- National new listings edged 0.8% higher month-on-month in June, stoked by gains in Ontario (+2% m/m) and Quebec (1% m/m).
- Across Canada, markets remained balanced, with the sales-to-listings ratio at 57.1% in June. Markets remained in seller's territory in Ontario (ratio at 60.3%, down one tick from May). Conditions remained relatively tight in Quebec (ratio at 66.6%), New Brunswick (60.5%), Nova Scotia (58.3%) and PEI (63.2%). In contrast, markets are oversupplied relative to historical norms in Alberta (51.3%), B.C. (48.8%), Saskatchewan (41.1%), Manitoba (54.6%) and Newfoundland and Labrador (31.5%).
- The average home price increased 1.3% month-on-month in May, marking the fourth straight monthly gain. On a year-over-year basis, prices were up 1.8%, driven by gains in Ontario (7%) and Quebec (4%).
- In contrast to the annual gain in average home prices, the quality-adjusted MLS home price index declined 0.3% y/y. Markets in Alberta and B.C. continue to weigh on price growth. Indeed, benchmark prices dropped on a year-over-year basis in Calgary (-4%), Edmonton (-3%), Regina (-4%) and Saskatoon (-1%). In Vancouver, prices are down 10% year-over-year – the weakest showing in a decade. In contrast, price growth remained strong in Montreal (+7% y/y) and Ottawa (+8% y/y), amid tight markets and rising demand. Prices are creeping higher in Toronto, advancing 4.0% year-on-year in June, up from 3.0% in May and the fastest price growth since 2017.
Key Implications
- Home sales took a modest breather in June, which is perhaps a mild disappointment given that mortgage rates also edged lower in the month. However, note that declines observed in some major markets followed strong gains in prior months. As such, some payback was likely in order. Moreover, the broader picture remains one of improvement, with sales 5% higher year-over-year, compared to a 6% decline during the same time in 2018.
- Moving forward, home sales will likely continue to trend higher in the second half, supported by a solid job market, strong population growth, low borrowing costs, further distance from past restrictive policies and supportive measures for first-time homebuyers.
- Today's report caps a decent second quarter for housing activity, with sales rising 5% from their weather-impacted first quarter drop. This is yet another sign that economic growth rebounded in Q2. With a second quarter improvement in GDP growth looking like a done deal, attention shifts to third quarter growth prospects. The Bank of Canada has forecast a modest 1.5% rate for Q3, setting the bar low for growth to jump over.
New Zealand Inflation May Leave Door Open for Monetary Easing
The Reserve Bank of New Zealand (RBNZ) has clearly stated in June that further monetary easing might be needed over time to help the central bank to meet its inflation and employment objectives. On Monday at 2245 GMT the Consumer Price Index (CPI) report is likely to show that inflation has heated up in the second quarter, but not sufficiently to scrap the need for more stimulus.
The headline CPI is forecast to rebound from 0.1% to 0.6% quarter-on-quarter in the April-June period, which could push the annual measure to 1.7% from 1.5% previously. The latter would match the central bank’s inflation estimate of 1.7% for this year but not the 2.0% midpoint of its 1-3% target, calling for a more relaxed monetary policy as temporary factors such as higher fuel prices may have underpinned the price increase.
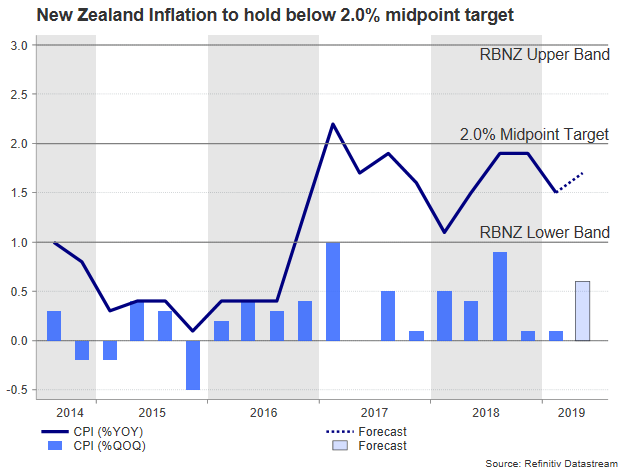
While a rebound in headline inflation could be food for thought for those who believe that the Reserve Bank of New Zealand (RBNZ) will deliver a second rate cut in August, the complicated situation on the global trade front is rather clouding the outlook for the risk-sensitive kiwi economy. Given that China is New Zealand’s largest trading partner, particularly in dairy and meat products, and a key source of tourism and foreign investment, any additional barrier to China’s trade activities would theoretically weigh on China’s growth and thus slowdown its overseas purchases – unless the kiwi currency depreciates enough to keep domestic products competitive.
In truth, the aggressive US-Sino trade war has yet to hurt New Zealand’s trade terms with China as recent data showed that the trade surplus between the countries continued to strengthen by the end of May. In addition to a depreciated kiwi currency, the fiscal and monetary support in China have likely provided some comfort to businesses. Nevertheless, with the rest of the data being on the back-foot, including GDP growth, house sales, consumer confidence and manufacturing PMI at a time when the global economy is losing strength, the RBNZ could reduce borrowing costs as soon as in August to avoid a sharper growth deceleration in case the trade war escalates further.
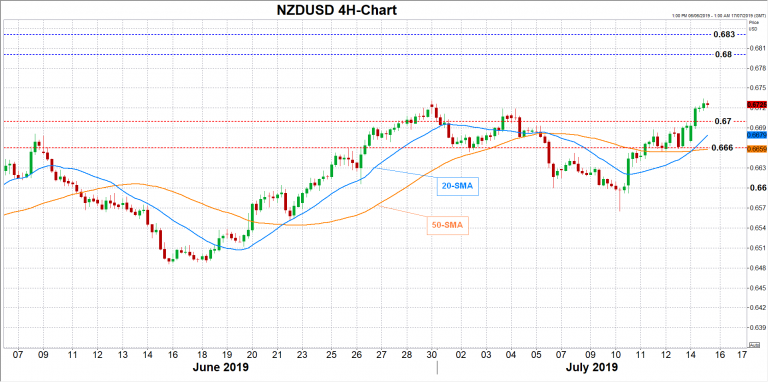
Since the inflation report is not available as often as in other major economies, the data are expected to bring volatility to the kiwi during the Asian session. A lower-than-expected CPI reading – especially in the core CPI measures – would raise the already elevated stakes for a 25 bps rate cut at the next policy meeting in August, consequently pressuring NZDUSD back into the 0.67-0.6660 area.
A beat in the data could help the pair to reach resistance near 0.6770 but would still leave options for further monetary easing open as only an annual inflation at 2.0% or higher would make the RBNZ hesitant. A bigger upside surprise in CPI numbers may also drive the pair towards the 0.68-0.6830 restrictive region.
It is also worth noting that the employment report due on August 6th and a day before the policy meeting would provide further direction on the RBNZ’s strategy. Any weakness in inflation or employment data will probably lead to additional stimulus.
Sunset Market Commentary
Markets
Core bonds eke out some gains today with Bunds outperforming US Treasuries. The German economy ministry said that the weak level of orders and deteriorating business sentiment suggest that weakness in the manufacturing sector will persist. Traded volumes are extremely low even given Summer conditions, so we don’t draw strong conclusions from the price action. The strength can’t be rhymed with gains on stock markets and/or higher oil prices. Citigroup kicked off Q2 earnings season with a small beat, while July Empire Manufacturing Business sentiment rebounded more as forecast in July (4.3 from -8.6 vs 2.0 expected). The German yield curve bull flattens with yields down 1.6 bps (2-yr) to 4.6 bps (30-yr). US yields decline by 0.6 bps (2-yr) to 1.4 bps (10-yr). 10-yr yield spreads changes vs Germany narrow by up to 6 bps. Greece marginally underperforms its peripheral neighbors after the Hellenic Republic’s announcement of the near term launch of a new 7-yr GGGB via syndication (likely tomorrow). Spanish bonds don’t react to the political deadlock. Socialist PM Sanchez said that all coalition/support talks with Podemos leader Iglesias were in vain. Sanchez’ Socialists won’t be able to gain next week’s parliamentary majority in a confidence week with centre right Partido Popular and Ciudadanos unlikely to abstain. In that case, the constitutional clock starts the countdown to a new snap election unless the premier wins parliamentary approval within two months.
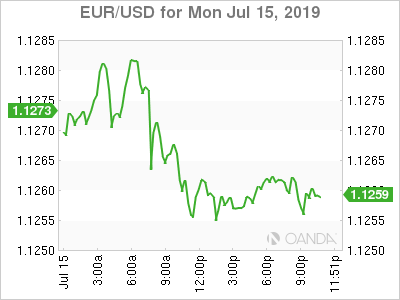
Markets had a taste of the 2019Q2 earnings season today with Citigroup beating estimates. The dollar briefly ‘jumped’ after the release. The impact of a better than expected NY Empire Manufacturing (4.3 vs. 2) stayed very limited as important subseries (new orders, employment) showed it isn’t all puppies and sunshine. Investors also await the earnings season for more guidance before engaging in any directional positions. Dollar trading developed in extremely thin ranges (intraday spread of a meagre 20 pips) as a result. EUR/USD is trading sideways around 1.126. The trade weighted dollar (DXY) ekes out small gains into the high 96.8 area. USD/JPY’s attempt to settle above 108 currently fails.
EUR/GBP retreated from recent highs near 0.90 over the past few days. Sterling’s reprieve didn’t last long however. The currency again faced moderate selling pressure today even though there weren’t any key data releases. Neither could sterling benefit from Gina Miller’s pledge to take the UK government to court should the next prime minister try to suspend Parliament to force a no-deal Brexit. Miller is a pro-EU campaigner, known for winning the legal fight over the parliamentary meaningful vote end of 2016. Anyway, sterling is back in the defensive although we don’t want to read too much in today’s technically driven and low-volume trading session. EUR/GBP is hovering back close to 0.90, completely erasing all of Friday’s losses. Cable took a dive to below 1.253 (from 1.258).
News Headlines
Turkish central bank governor Murat Uysal, who was promoted after President Erdogan sacked governor Cetinkaya last week, said that the country has room to maneuver on monetary policy. Recent improvements in inflation (expectations) created the space for a rate cut, he argued.
NY Fed governor Williams urged that the financial industry can’t afford to wait to shift away form Libor rates: Don’t wait for term rates to get your house in order. “Engage with this issue now and understand what it means for your operations. Recognize where your exposure lies and deal with the contracts that mature after 2021 that lack robust fallback language.”
USD/JPY Mid-Day Outlook
Daily Pivots: (S1) 107.60; (P) 108.11; (R1) 108.40; More...
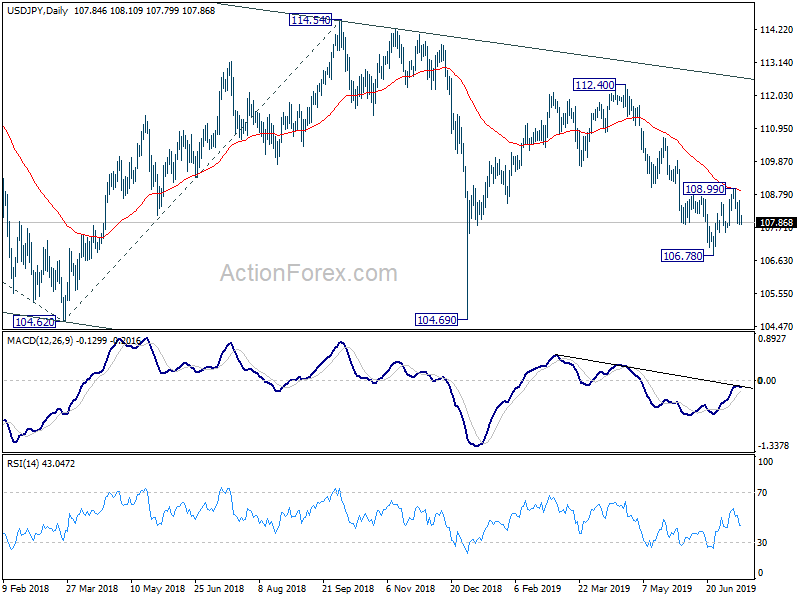
Intraday bias in USD/JPY remains mildly on the downside at this point. Corrective rebound from 107.54 should have completed at 108.99, after rejection by 55 day EMA. Further fall should be seen and break of 107.53 support will likely send USD/JPY through 106.78 to resume the decline from 112.40. For now, near term outlook will remain bearish as long as 108.99 resistance holds.
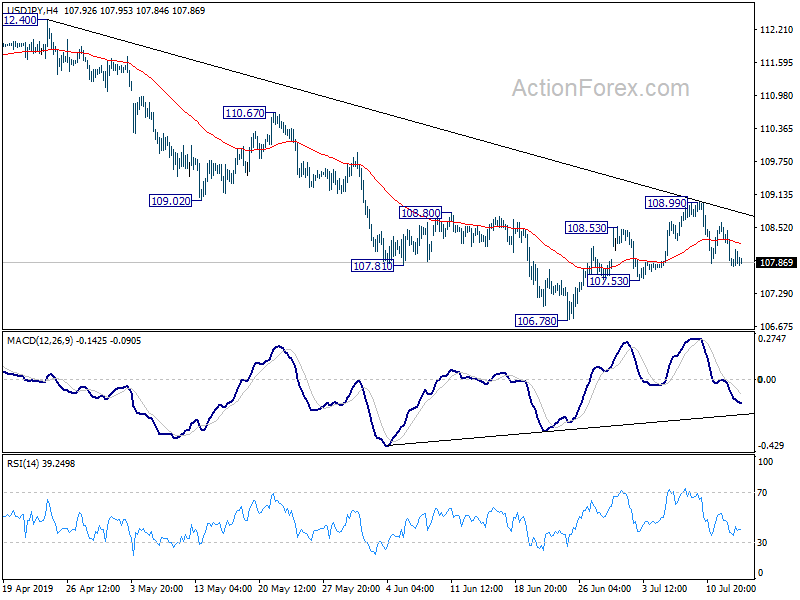
In the bigger picture, decline from 118.65 (Dec 2016) is still in progress, with the pair staying inside long term falling channel. Break of 104.62 will target 100% projection of 118.65 to 104.62 from 114.54 at 100.51. For now, we'd expect strong support above 98.97 (2016 low) to contain downside to bring rebound. In any case, break of 112.40 is needed to the first serious sign of medium term bullishness. Otherwise, further decline will remain in favor in case of rebound.