

Sample Category Title
USD/CHF Mid-Day Outlook
Daily Pivots: (S1) 0.9816; (P) 0.9862; (R1) 0.9888; More...
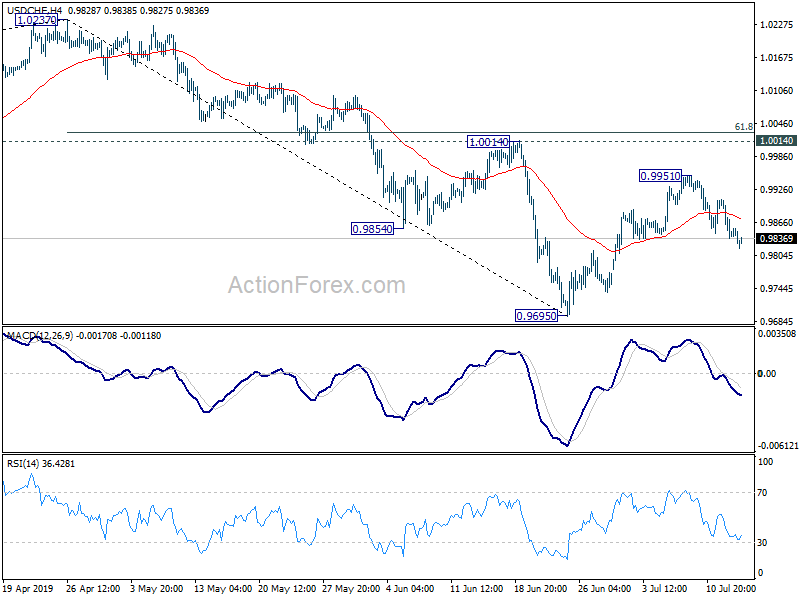
Intraday bias in USD/CHF remains mildly on the downside for the moment. Corrective rebound from 0.9695 should have completed at 0.9951, after rejection by 55 day EMA. Deeper fall should be seen back to retest 0.9695 low first. On the upside, above 0.9951 will extend the rebound from 0.9695. In that case, upside should be limited by 61.8% retracement of 1.0237 to 0.9695 at 1.0030.
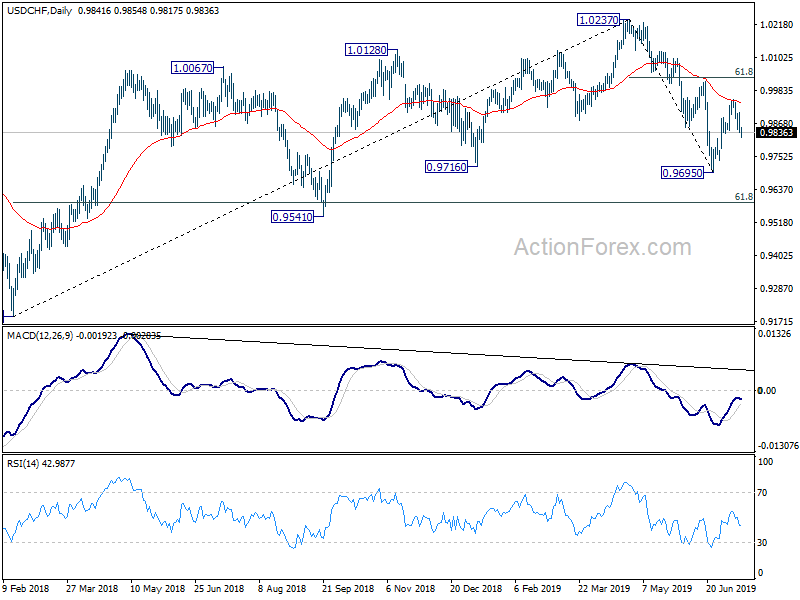
In the bigger picture, up trend from 0.9186 (2018 low) should have completed at 1.0237 already. Deeper decline would be seen to 61.8% retracement of 0.9186 to 1.0237 at 0.9587 and below. For now, USD/CHF is seen as in long term range pattern between 0.9186 and 1.0342. Hence, we'd pay attention to bottoming signal below 0.9587. However, sustained break of 1.0014 will revive medium term bullishness and turn focus back to 1.0237 high.
EUR/USD Mid-Day Outlook
Daily Pivots: (S1) 1.1248; (P) 1.1261; (R1) 1.1285; More...
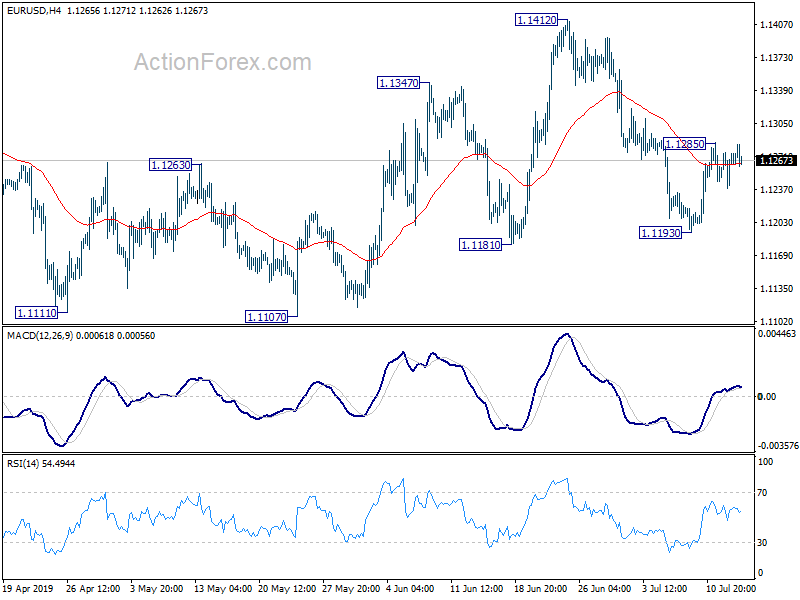
EUR/USD is staying in range below 1.1285 and intraday bias stays neutral first. Further rally remains mildly in favor. On the upside, above 1.1285 will extend the rise from 1.1193 to 1.1412 resistance next. On the downside, below 1.1193 will resume the fall from 1.1412 to retest 1.1107 low.
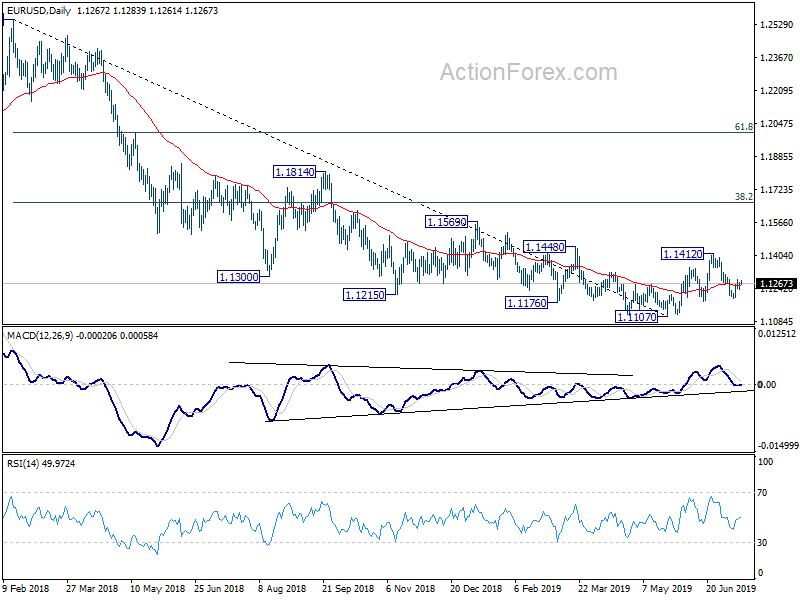
In the bigger picture, bullish convergence condition in daily and weekly MACD suggests that 1.1107 is a medium term bottom. However, rejection by 55 EMA retains medium term bearish. Outlook will be neutral for now. On the downside, break of 1.1107 will resume the down trend from 1.2555 (2018 high) to 78.6% retracement of 1.0339 to 1.2555 at 1.0813. Meanwhile, break of 1.1412 will resume the rebound to 38.2% retracement of 1.2555 to 1.1107 at 1.1660.
GBP/USD Mid-Day Outlook
Daily Pivots: (S1) 1.2536; (P) 1.2558; (R1) 1.2596; More....
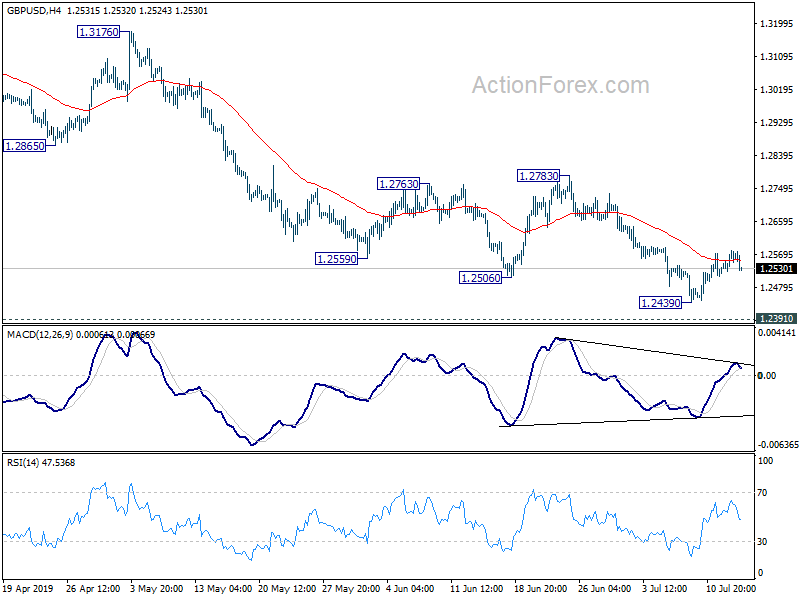
GBP/USD fails to sustain above 4 hour 55 EMA and dips mildly. But downside is held well above 1.2439 temporary low. Intraday bias remains neutral first. In case of another recovery, upside should be limited below 1.2783 resistance to bring fall resumption. On the downside, break of 1.2439 would resume the decline from 1.3381 to retest 1.2391 low. Firm break there will resume larger down trend.
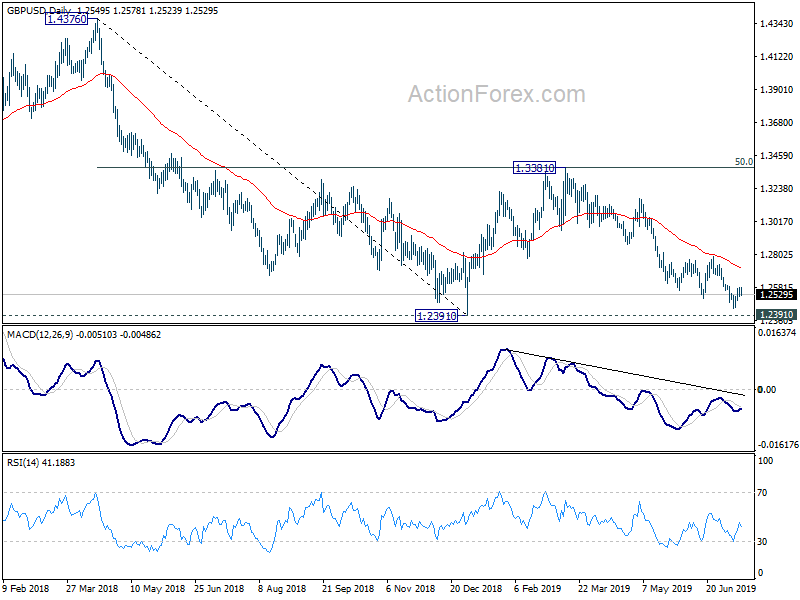
In the bigger picture, down trend from 1.4376 (2018 high) is still in progress. Break of 1.2391 would target a test on 1.1946 long term bottom (2016 low). For now, we don't expect a firm break there yet. Hence, focus will be on bottoming signal as it approaches 1.1946. In any case, medium term outlook will stay bearish as long as 1.3381 resistance holds, in case of strong rebound.
Dollar Shrugs Solid Manufacturing Data, Sterling Leads Euro Lower
Commodity currencies remain the strongest ones for today with help from mild risk appetite. Dollar is trying to recover on stronger than expected manufacturing data, but no follow through buying is seen yet. The greenback will need more positive data release to offset recent selling pressure. On the other hand, Sterling is leading Euro lower today. In particular, the Pound looks rather vulnerable ahead of important economic data this week, including employment, CPI and retail sales.
Technically, EUR/GBP bounces off 0.8954 minor support today. Thus, there is no indicate of near term reversal yet. Recent rise might extend through 0.9010 temporary top. But we'd continue to expect strong resistance from 0.9101 to limit upside. With selloff in the Pound, GBP/JPY is heading back to 135.07 temporary low and break will resume recent decline. AUD/USD is still eying 0.7047 resistance to confirm rally resumption.
In Europe, currently, FTSE is up 0.44%. DAX is up 0.48%. CAC is up 0.17%. German 10-year yield is down -0.0316 at -0.242. Earlier in Asia, Hong Kong HSI rose 0.29%. China Shanghai SSE rose 0.40%. Singapore Strait Times dropped -0.28%. Japan was on holiday.
US Empires State Manufacturing index rose 12.9 pts to 4.3
US Empires State Manufacturing General Business Outlook improved to 4.3 in July, up 12.9 pts from -8.6. Looking at some details, new orders were little changed, and shipments increased. Unfilled orders and inventories continued to move lower, while delivery times were longer. The employment index remained negative, falling to its lowest level in nearly three years. Input price increases continued to moderate somewhat, while the pace of selling price increases remained modest. Indexes assessing the six-month outlook indicated that firms were fairly optimistic about future conditions.
Trump said China's slowest growth in 27 yrs was because of US tariffs
Trump claimed that China's growth slowing to worst in 27 years was a result of his tariffs, that prompted companies to leave China. And, this is why China wants to make a trade deal with him. He hailed his tariffs are brining in billions of dollar, and they pay by "devaluing & pumping".
In his tweet, Trump said: China's 2nd Quarter growth is the slowest it has been in more than 27 years. The United States Tariffs are having a major effect on companies wanting to leave China for non-tariffed countries. Thousands of companies are leaving. This is why China wants to make a deal with the U.S., and wishes it had not broken the original deal in the first place. In the meantime, we are receiving Billions of Dollars in Tariffs from China, with possibly much more to come. These Tariffs are paid for by China devaluing & pumping, not by the U.S. taxpayer!
Germany Economy Ministry expects weak basic economic trend for Q2
Germany's Economy Ministry said in the monthly report that the industrial economy continues to develop "sluggishly" as "headwind" from foreign demand remains "palpable". Additionally, current data suggests a "calmer" pace in the service sector. And this indicates a "weak basic economic trend" for Q2.
The report further noted that "after the cautious development in the second quarter, the buoyant forces could again come to bear stronger if the external environment calmed down again." But there are "significant downside risks" due to trade conflicts, Brexit and geopolitical tensions.
Global business activity expectations dropped decade low, marked deterioration in US
Markit Global Business Outlook Survey dropped from 24 in February to 18 in in July, hitting the lowest since data were first collected in 2009. The survey was carried out three times per year, and if shows net balance of global firms predicting rising output in the coming year. US has seen the biggest slide in business optimism apart from Brazil, down to 16. Confidence ticked higher in Eurozone to 27, but remained closed to six-year lows. UK also improved slightly 32, joint second-weakest since 2009. Japan's reading dropped to three-year low at 11.
Chris Williamson, Chief Business Economist at IHS Markit, said: "The global business mood has darkened to the gloomiest since the height of the financial crisis in 2009. Escalating trade tensions have fuelled the downturn in optimism, exacerbating wider worries about slowing economic growth in key markets.... The big change since earlier in the year has been a marked deterioration of optimism among US companies, alongside a slide in business optimism in China, indicating how trade war tensions are hurting both economies. In contrast, sentiment picked up slightly in the eurozone and UK, albeit remaining worryingly subdued."
China Q2 GDP slowed to 27-year low, but June data beat expectations
GDP growth slowed to 6.2% yoy in Q2, down from Q1's 6.4% yoy, matched expectations. That's also the slowest pace in at least 27 years. However, quarterly growth actually accelerated to 1.6% qoq, up from Q1's 1.4% qoq and beat expectation of 1.5% qoq.
Also June's data come in stronger than expected. But it remains to be seen if the momentum towards the end of the quarter could sustain. Headwinds from US tariffs and weaker global growth would still likely drag down China's growth ahead.
Fixed assessment investment, excluding rural, rose 5.8% ytd yoy in June, up from 5.6% and beat expectation of 5.6%. Industrial production rose 6.3% yoy in June, up from 5.0% and beat expectation of 5.2%. Retail sales jumped 9.8% yoy, up from 8.6% yoy and beat expectation of 8.5% yoy. Surveyed unemployment rate rose from 5.0% to 5.1%.
Suggested readings on China:
- Chinese Economy Weakest in Almost Three Decades. Growth Could Fall Below 6% by Year-End.
- Perspective on Asia: China GDP and Investment Update June Quarter 2019
GBP/USD Mid-Day Outlook
Daily Pivots: (S1) 1.2536; (P) 1.2558; (R1) 1.2596; More....
GBP/USD fails to sustain above 4 hour 55 EMA and dips mildly. But downside is held well above 1.2439 temporary low. Intraday bias remains neutral first. In case of another recovery, upside should be limited below 1.2783 resistance to bring fall resumption. On the downside, break of 1.2439 would resume the decline from 1.3381 to retest 1.2391 low. Firm break there will resume larger down trend.
In the bigger picture, down trend from 1.4376 (2018 high) is still in progress. Break of 1.2391 would target a test on 1.1946 long term bottom (2016 low). For now, we don't expect a firm break there yet. Hence, focus will be on bottoming signal as it approaches 1.1946. In any case, medium term outlook will stay bearish as long as 1.3381 resistance holds, in case of strong rebound.
Economic Indicators Update
| GMT | Ccy | Events | Actual | Forecast | Previous | Revised |
|---|---|---|---|---|---|---|
| 23:01 | GBP | Rightmove House Prices M/M Jul | -0.20% | 0.30% | ||
| 02:00 | CNY | GDP Y/Y Q2 | 6.20% | 6.20% | 6.40% | |
| 02:00 | CNY | Fixed Assets Ex Rural YTD Y/Y Jun | 5.80% | 5.60% | 5.60% | |
| 02:00 | CNY | Industrial Production Y/Y Jun | 6.30% | 5.20% | 5.00% | |
| 02:00 | CNY | Retail Sales Y/Y Jun | 9.80% | 8.50% | 8.60% | |
| 02:00 | CNY | Surveyed Jobless Rate Jun | 5.10% | 5.00% | ||
| 06:30 | CHF | Producer & Import Prices M/M Jun | -0.50% | 0.00% | 0.00% | |
| 06:30 | CHF | Producer & Import Prices Y/Y Jun | -1.40% | -0.90% | -0.80% | |
| 12:30 | USD | Empire State Manufacturing Jul | 4.3 | 2 | -8.6 |
GBPNZD Continues Bearish Trend; Accelerates on Break of Swing Low
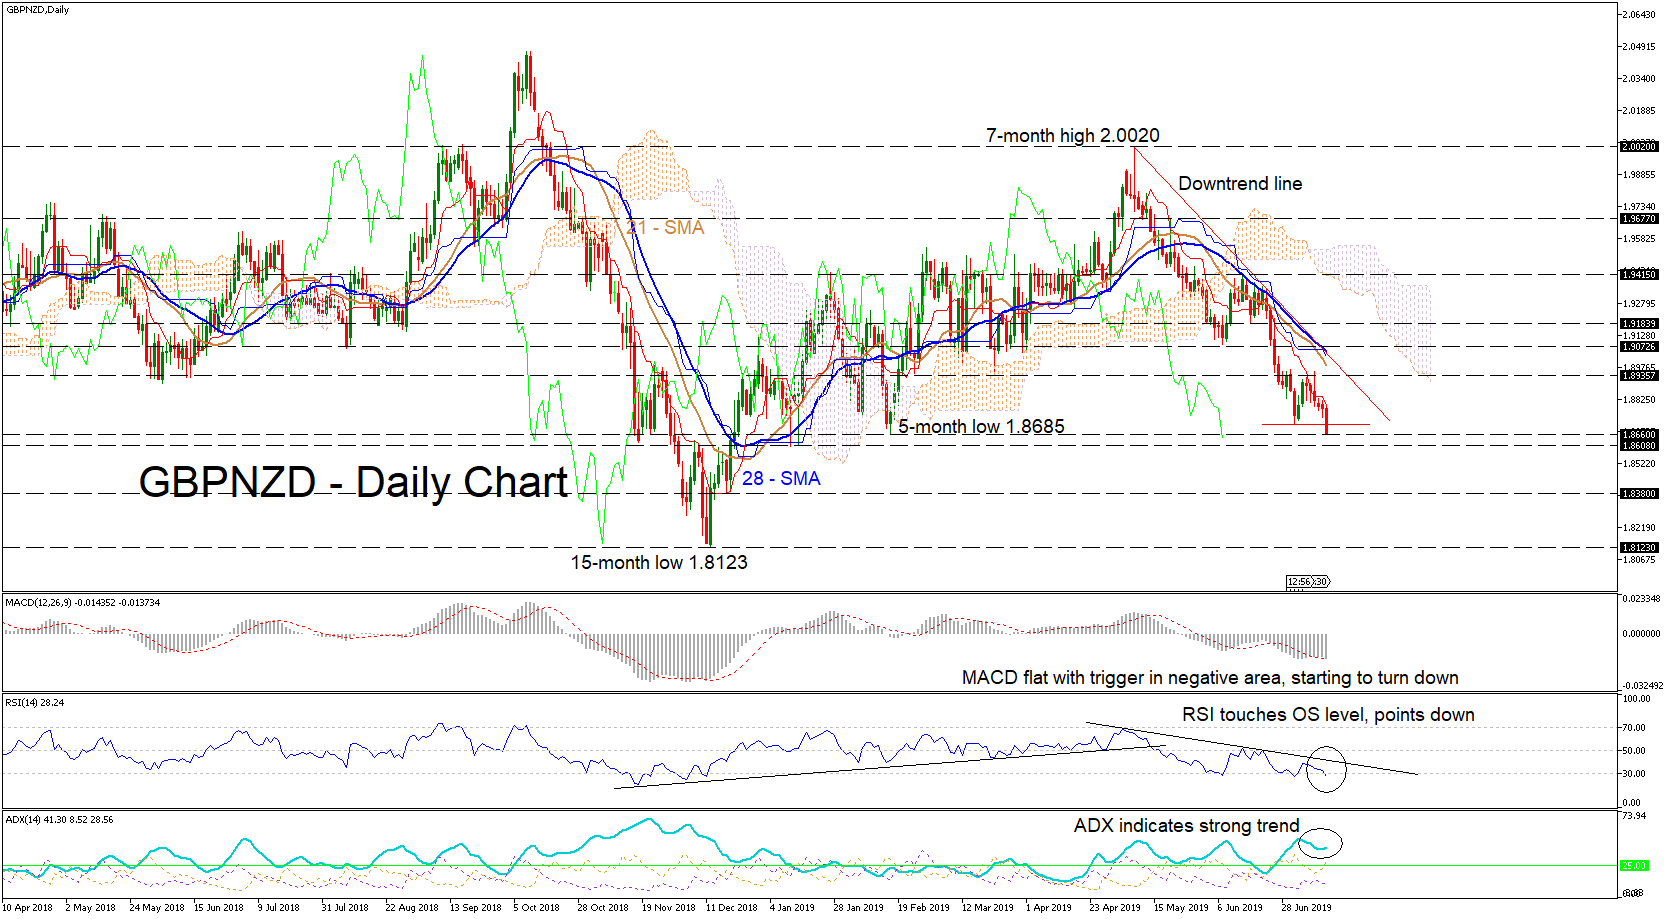
GBPNZD, consumed by a two-month downtrend from a seven-month high of 2.0020, had sellers today grab the reins once again to restart another bearish rally south.
The momentum indicators confirm the persisting down move, with MACD starting to turn down to cross the trigger line, in the negative area, and the RSI agreeing, as it moves south towards the oversold area below 30. The ADX validates that the trend has substantial strength, coupled by the short- and medium-term 21- and 28-day simple moving averages, and further by the chikou span and the moving averages of the ichimoku indicator.
If sellers can keep up the bearish bias, the price will see some immediate friction at the 1.8608 support, which if it gives way, could see a collapse of the price to 1.8380, before a test of the fifteen-month low of 1.8123. A crash through 1.8123 could bring a long-term bearish outlook.
On the other hand, for a shift to the upside, the pair’s current flirt with the five-month low of 1.8685 will have to first conquer the sellers, pushing the price to its initial encounter of the 1.8936 resistance, before ultimately attempting an important test to try to break above the downtrend line, culminating with the two moving averages and a resistance of 1.9073.
In conclusion, the bearish bias in the pair seems to be here to stay for the short- and coming medium-term.
European Update – Investors Unconvinced by Data
Mixed picture across Europe
Its been a mixed start to trade on Monday, with Chinese data initially giving a boost to the basic resource sector and sentiment on the whole.
The data was a mixed bag which may explain why it took a little time to settle in. On the one hand, the country has experienced it’s slowest quarter of growth in 27 years, on the other we saw some encouraging beats on the accompanying releases.
This was particularly true of the industrial production number which was more than 1% higher and is giving a boost to basic resource stocks. Ultimately, the trade war is clearly taking its toll but importantly, the slowdown is being managed well at the moment which is perhaps a relief. Of course, things could still get better before they improve so we have to bear that in mind.
Earnings recession to add to Q2 gloom
Stock markets may be at record highs in the US but there’s a very different feeling going into this earnings season than we’ve experienced the last few years. After a year of incredible earnings growth, we’re now facing down the barrel of an earnings recession, with a drop of almost 3% expected.
That will only further support the case for rate cuts from the Federal Reserve, especially if second quarter growth turns out to be as bad as people fear. We kick things off with focus on the banks this week which should offer some great insight into the economic outlook and impact of lower interest rates to come on earnings.
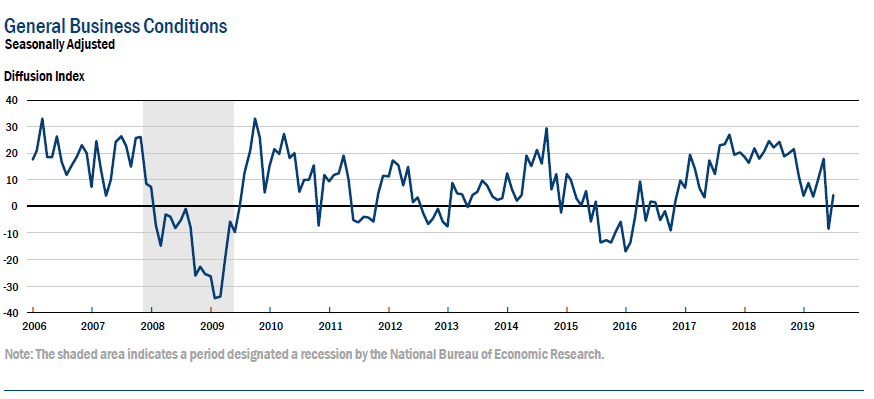
US Empires State Manufacturing index rose 12.9 pts to 4.3
US Empires State Manufacturing General Business Outlook improved to 4.3 in July, up 12.9 pts from -8.6. Looking at some details, new orders were little changed, and shipments increased. Unfilled orders and inventories continued to move lower, while delivery times were longer. The employment index remained negative, falling to its lowest level in nearly three years. Input price increases continued to moderate somewhat, while the pace of selling price increases remained modest. Indexes assessing the six-month outlook indicated that firms were fairly optimistic about future conditions.
Trump said China’s slowest growth in 27 yrs was because of US tariffs
Trump claimed that China's growth slowing to worst in 27 years was a result of his tariffs, that prompted companies to leave China. And, this is why China wants to make a trade deal with him. He hailed his tariffs are bringing in billions of dollar, and they pay by "devaluing & pumping".
In his tweet, Trump said: "China's 2nd Quarter growth is the slowest it has been in more than 27 years. The United States Tariffs are having a major effect on companies wanting to leave China for non-tariffed countries. Thousands of companies are leaving. This is why China wants to make a deal with the U.S., and wishes it had not broken the original deal in the first place. In the meantime, we are receiving Billions of Dollars in Tariffs from China, with possibly much more to come. These Tariffs are paid for by China devaluing & pumping, not by the U.S. taxpayer!"
https://twitter.com/realDonaldTrump/status/1150717475421663233
Bitcoin – $10,000 Coming Under Pressure
Another day, another 10% move
Bitcoin remains as volatile as ever, falling more than 10% on Sunday to hover above $10,000.
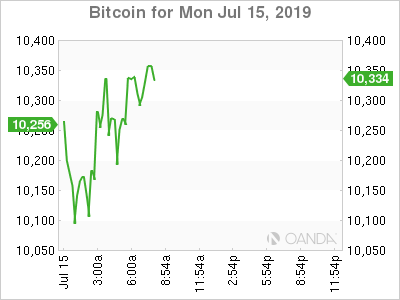
A cryptocurrency exchange reported a theft of $32m over the weekend, while a Chinese mining firm was raided after stealing $3m in electricity. As is often the case, it’s not clear whether these stories contributed to the sell-off or if they even get the same attention they once would.
What is clear is that price action is not settling down and no matter which way we turn from here, that could well continue. The $9,500-10,000 area has been tested overnight but is finding a way to hold on for now.
A break of this could put some pressure on prices, with $9,000 being the next key level below, while a failure to do so could reinvigorate the hodlers and those that think it’s not a case of if it will $20,000 but how soon.
Perspective on Asia: China GDP and Investment Update June Quarter 2019
June quarter GDP as expected. Investment continues to struggle for momentum
As expected, China GDP rose by 6.2% over the year to June 2019. A step-down from 6.4%yr in March 2019 and December 2018, the result puts the economy on track to achieve full-year growth at the bottom end of authorities’ 6.0–6.5% 2019 target range.
Net exports’ contribution to growth started 2019 on a particularly strong footing, contributing 1.5ppts in year-to-date terms at March. Unsurprisingly, three months later, this contribution has throttled back to 1.3ppts as the pull-forward of export activity to get ahead of US tariffs drew to a close. As we move through the second half, this contribution should diminish further.
This trend places the focus for growth on consumption and investment.
Compared to this time last year, the contribution from total consumption is materially weaker, at 3.8ppts versus 5.3ppts in 2018. We cannot definitively say that this deceleration is entirely due to the household sector as public consumption is also included. However, given the weakness evident in the NBS PMI employment series, it seems safe to assume households are under pressure and have become more cautious in their spending over the past year.
Corroborating this view, year-to-date growth in retail sales was 8.4%yr at June 2019, 1ppt below June 2018, and 2ppts below June 2017.
Turning then to investment, the sector’s addition to real GDP growth in 2019 (1.2ppts) is roughly 1ppt below the average contribution of 2018 and 2017. Further, with year-to-date investment growth at June on par with the average of the past year (5.8%yr), momentum clearly remains hard to come by.
A major concern for the investment outlook remains the variability of outcomes across industry.
Of the weaker industries, a lack of progress accelerating growth in manufacturing (3.0%yr) and utilities (–0.5%yr) best highlight China’s challenges. This is because the former speaks to the scale of the ‘uncertainty’ headwind created by US tariffs, the latter the equally-important legacy of authorities’ quality investment reforms of 2017 and 2018.
While we expect investment growth to firm through the second half thanks to improved credit availability and lower interest costs, the above headwinds will persist. They also emphasize that risks to the activity view are set to remain skewed to the downside for the foreseeable future.
We continue to look for full-year growth of 6.1% in 2019 and 6.0% in 2020.