

Sample Category Title
Silver: White Metal Trading On A Stronger Footing This Morning
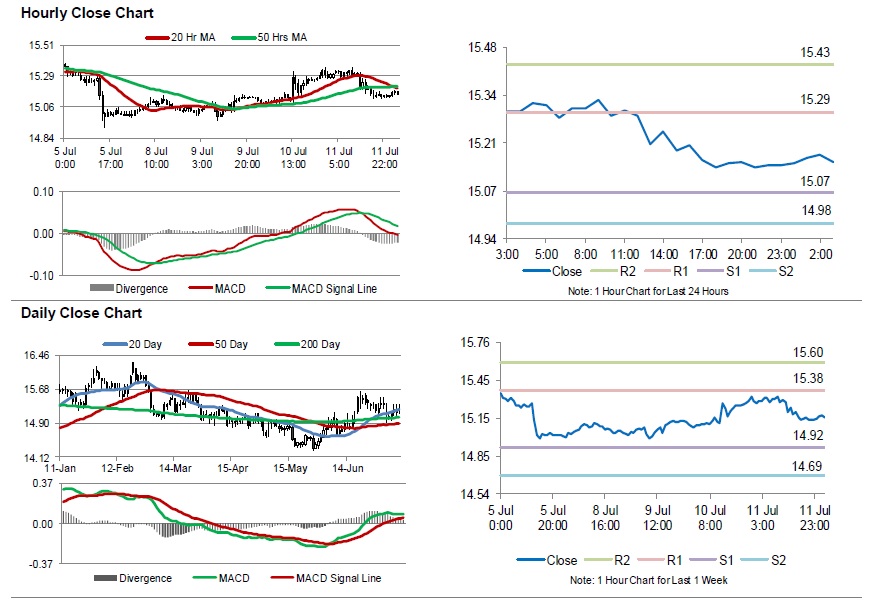
For the 24 hours to 23:00 GMT, Silver declined 0.95% against the USD and closed at USD15.15 per ounce, tracking losses in gold prices.
In the Asian session, at GMT0300, the pair is trading at 15.16, with silver trading 0.07% higher against the USD from yesterday’s close.
The pair is expected to find support at 15.07, and a fall through could take it to the next support level of 14.98. The pair is expected to find its first resistance at 15.29, and a rise through could take it to the next resistance level of 15.43.
The white metal is trading below its 20 Hr and 50 Hr moving averages.
Crude Oil: Oil Trading Higher, Ahead Of Baker Hughes Weekly Rig Count Data
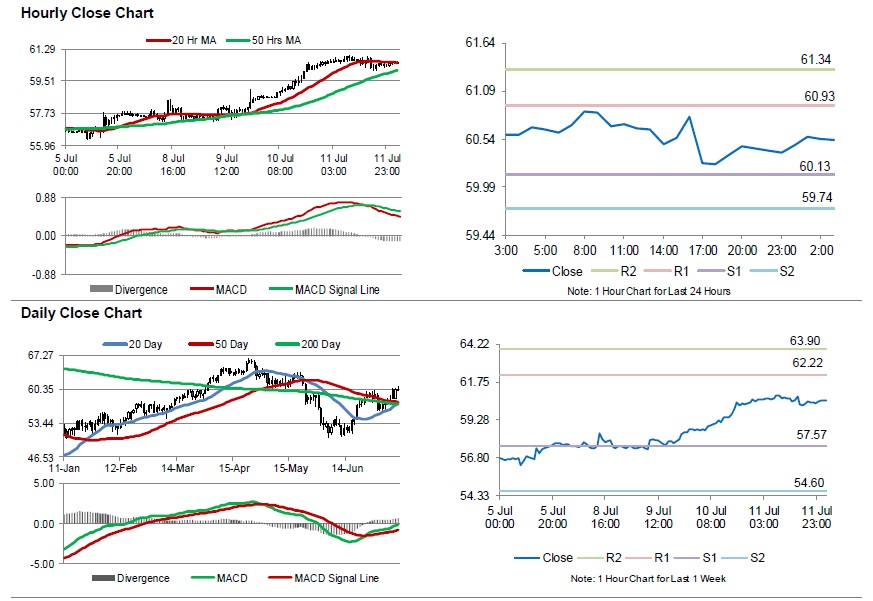
For the 24 hours to 23:00 GMT, Crude Oil declined 0.07% against the USD and closed at USD60.38 per barrel after Organization of the Petroleum Exporting Countries, in its monthly report trimmed its global demand forecast by 1.3 million barrels per day to an average of 29.3 million barrels per day for 2020.
In the Asian session, at GMT0300, the pair is trading at 60.53, with oil trading 0.25% higher against the USD from yesterday’s close.
The pair is expected to find support at 60.13, and a fall through could take it to the next support level of 59.74. The pair is expected to find its first resistance at 60.93, and a rise through could take it to the next resistance level of 61.34.
Crude oil is showing convergence with its 20 Hr moving average and trading above its 50 Hr moving average.
Aussie Rises As China Trade Data Delayed
Data after market close
Traders in Asia eagerly awaited the June trade data out of China, only to find the wait extended and extended. Latest rumours from the financial press suggest that they will released around 0700GMT later today. Pessimist might assume that the delay in releasing the data until after local markets have closed is a result of very poor numbers.
Recent surveys imply that export fell 2.0% y/y in June while imports crashed 4.5% y/y, resulting in a wider trade surplus of $44.7 billion from $41.7 billion in May.
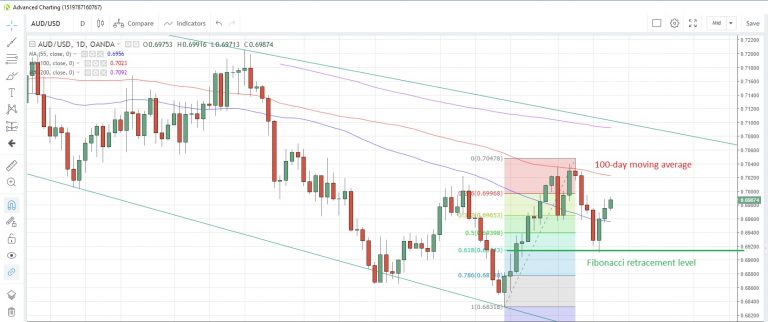
AUD/USD has risen for three straight days and is edging toward the 100-day moving average at 0.7023. That moving average has capped prices on a closing basis since April 22. Support will likely be found at the 61.8% Fibonacci retracement of the June-July rally at 0.6915.
AUD/USD Daily Chart
Singapore economy unexpectedly shrinks
The Singapore economy contracted 3.4% q/q in the second quarter, the largest contraction in about seven years, data released today showed. Economists had anticipated a milder slowdown to +0.1% from +3.8% in the last quarter of 2018. On an annualised basis, growth was a mere +0.1%, the slowest in a decade. The decline was mostly attributed to the manufacturing sector, which shrank 3.4% y/y as a result f the ongoing US-China trade frictions. Construction output was +2.2% y/y while services output grew 1.2%.
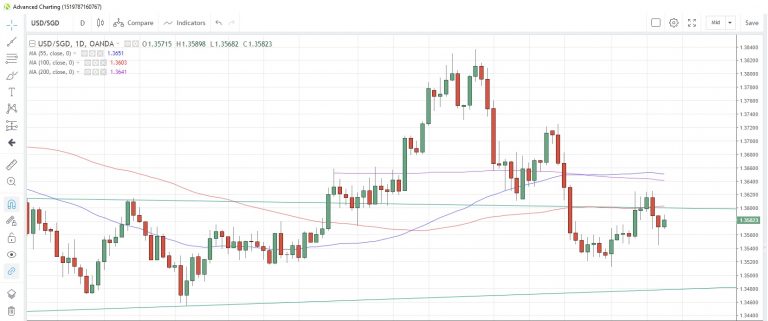
The Singapore dollar weakened mildly after the data, with USD/SGD rising to 1.3577 from 1.3571 at the open. The FX pair touched the lowest in eleven days yesterday amid broader US dollar weakness after Powell’s two days of testimony.
USD/SGD Daily Chart
Slow calendar to close the week
Final Japan industrial production data for may is seen holding steady with a 2.3% m/m increase, the same as in April. Capacity utilisation is expected to rise just 0.2% after a 1.6% gain the previous month. Germany’s wholesale price index is seen rising 0.2% m/m and 1.3% y/y while the Euro-zone May industrial production probably rebounded to +0.2% m/m following a 0.5% decline in April.
There’s not much data for the US session, with June producer prices and a speech from Fed’s Evans scheduled.
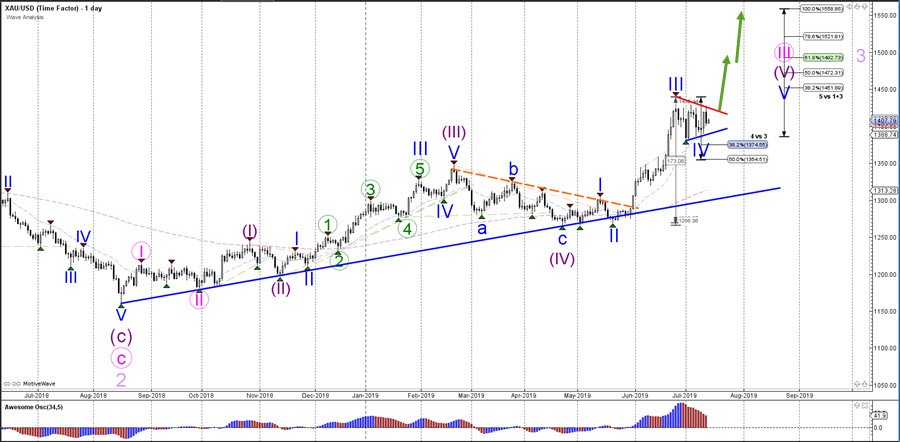
XAU/USD Pullback Before New Bullish Break And Uptrend
The XAU/USD triangle chart pattern is respecting the shallow Fibonacci retracement levels of wave 4 vs 3 which is typical behavior for a wave 4 (blue) pattern. A bullish breakout above the resistance trend line (red) would confirm the uptrend continuation towards the Fibonacci targets of waves 5 whereas an unexpected break below the 50% Fib would indicate that the bullish momentum is losing its steam. At the moment a new bull run on XAU/USD is becoming increasingly more likely.
The XAU/USD seems to have completed a bearish ABC pattern (green) within the wave 4 (blue) pattern. The recent bullish momentum is probably indicating the restart of the uptrend via wave 1 (green). The current pullback is therefore a wave 2 (green) as long as price stays do not break below the bottom of wave 1, which would invalidate the wave 1-2 pattern (green). The same idea is valid for this chart as well: a bullish breakout could indicate the start of an uptrend via a potential wave 3 (green) pattern.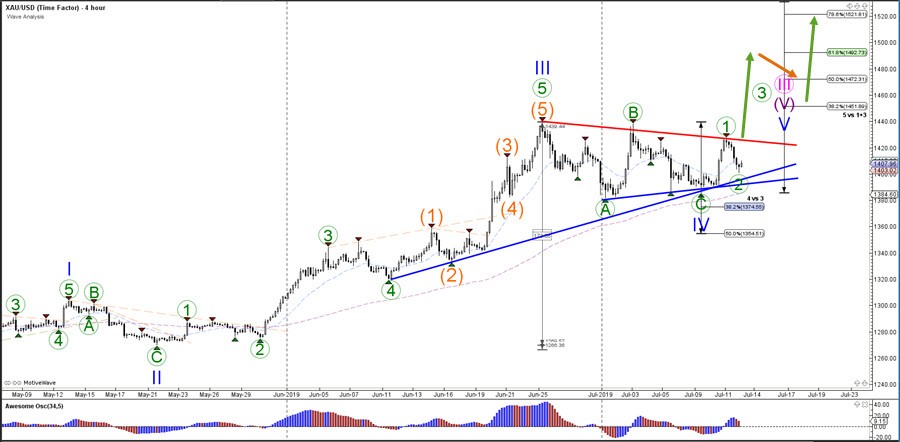
Elliott Wave View: Right Side In XLF Remains Higher
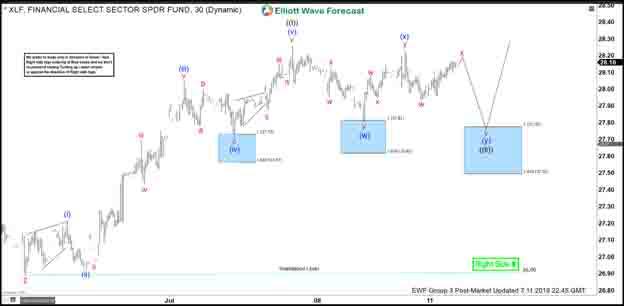
Financial Sector ETF (XLF) shows a bullish sequence from December 26, 2018 low favoring further upside. Short term Elliott Wave view suggests the pullback to 26.9 on June 25, 2019 low ended wave 2. The ETF has rallied higher within wave 3 with the internal subdivided as a 5 waves impulse Elliott Wave structure. Up from 26.9, wave (i) ended at 27.21 and wave (ii) pullback ended at 26.93. The instrument then resumed higher in wave (iii) towards 28.05, wave (iv) pullback ended at 27.71, and wave (v) ended at 28.27. The 5 waves move higher ended wave ((i)) of 3 in higher degree.
Wave ((ii)) pullback is in progress to correct cycle from June 25, 2019 low before the rally resumes. Internal of wave ((ii)) is unfolding as a double three Elliott Wave structure where wave (w) ended at 27.81 and wave (x) ended at 28.23. Expect the ETF to extend 1 more leg lower towards 27.5 – 27.78 to end wave (y) of ((ii)) before a 3 waves bounce at least. We don’t like selling XLF and expect buyers to appear in 3, 7, or 11 swing as far as pivot at 26.9 low stays intact in the first degree.
XLF 1 Hour Elliott Wave Chart
AUD/USD And NZD/USD Signaling Upside Continuation
AUD/USD found support above the 0.6900 level and recently climbed above 0.6950. Similarly, there were decent gains in NZD/USD above the 0.6600 and 0.6640 resistance levels.
Important Takeaways for AUD/USD and NZD/USD
- The Aussie Dollar started a strong recovery after trading as low as 0.6910 against the US Dollar.
- There was a break above a major bearish trend line with resistance near 0.6955 on the hourly chart of AUD/USD.
- NZD/USD also started a decent upward move after it settled above the 0.6600 pivot level.
- There was a clear break above a key bearish trend line with resistance near 0.6610 on the hourly chart.
AUD/USD Technical Analysis
In the past few days, the Aussie Dollar declined steadily below 0.7000 against the US Dollar. The AUD/USD pair broke the 0.6950 support level before it found support above the 0.6900 level.
A swing low was formed near 0.6910 on FXOpen and the pair recently started a decent recovery. It broke the 0.6920 and 0.6925 resistance levels to start the recent recovery. Later, there was a close above the 0.6950 resistance and the 50 hourly simple moving average.
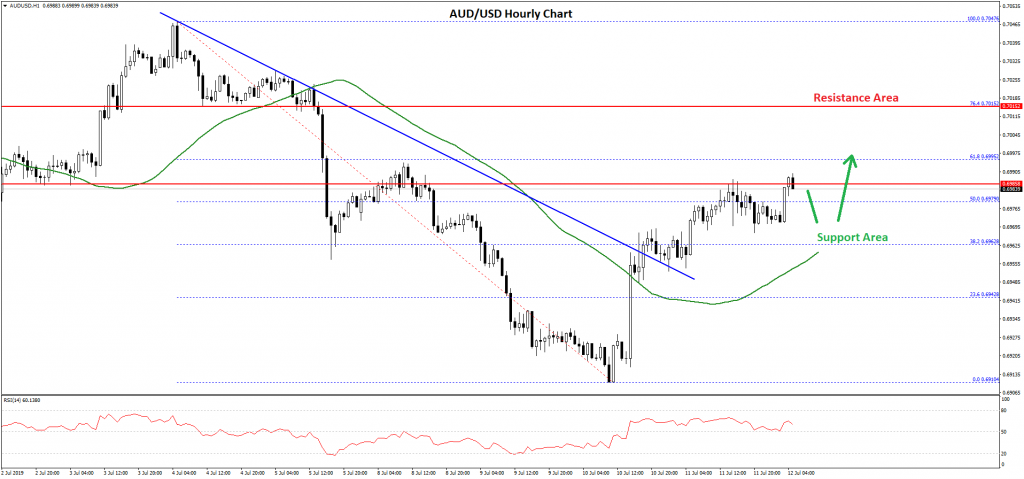
Besides, the pair successfully broke a major bearish trend line with resistance near 0.6955 on the hourly chart. It opened the doors for more gains above the 0.6970 level.
The pair climbed above the 50% Fib retracement level of the last major decline from the 0.7047 high to 0.6910 low. However, there are a few important resistances on the upside near the 0.6990 and 0.7000 levels.
The 61.8% Fib retracement level of the last major decline from the 0.7047 high to 0.6910 low is also near the 0.6990 level. Therefore, if there is an upside break above the 0.7000 level, the pair could continue to rise.
The next major resistance above 0.7000 is near the 0.7040 and 0.7050 levels. On the downside, there is a strong support forming near the 0.6955 level and the 50 hourly simple moving average.
Therefore, if there is a downside break below 0.6950 and the 50 hourly simple moving average, AUD/USD could start a fresh decline.
NZD/USD Technical Analysis
The New Zealand Dollar also followed a similar path and started a decent recovery after trading close to the 0.6550 level against the US Dollar. The NZD/USD pair traded as low as 0.6567 and recently recovered above the 0.6600 level.
After there was a close above the 0.6600 level and the 50 hourly simple moving average, the pair gained bullish momentum. During the rise, the pair broke a few important resistances near the 0.6640 level.
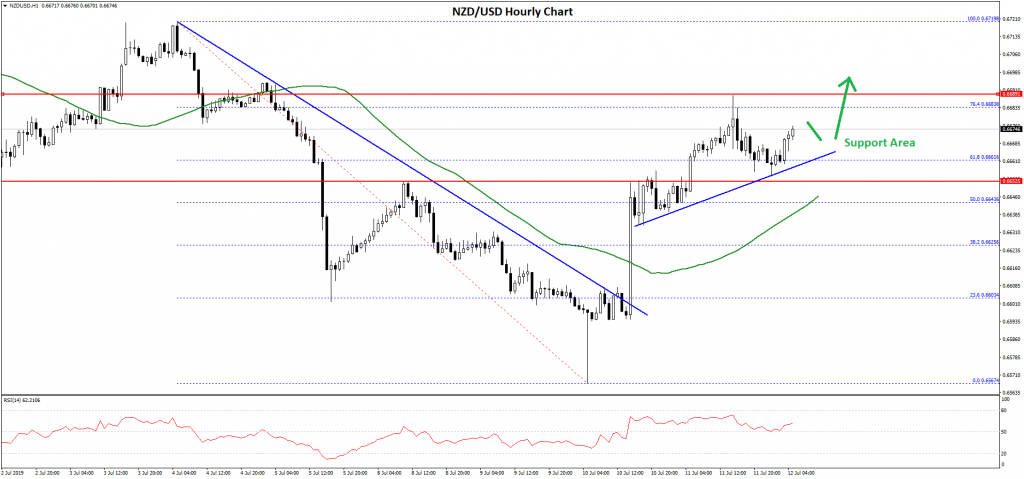
There was a clear break above a key bearish trend line with resistance near 0.6610 on the hourly chart. The pair even climbed above the 61.8% Fib retracement level of the last major drop from the 0.6719 high to 0.6567 low.
However, the pair seems to be facing resistance near the 0.6690 and 0.6700 levels. The 76.4% Fib retracement level of the last major drop from the 0.6719 high to 0.6567 low is also acting as a resistance.
If there is an upside break above the 0.7000 level, the pair could continue to rise towards the 0.7020 and 0.7040 levels in the near term.
On the downside, there is a connecting bullish trend line forming with support near 0.6660. If NZD/USD trades below 0.6660 and 0.6650, it could start a fresh decline.
Market Morning Briefing: Pound Sustains Above 1.2500
STOCKS
Dow has surged and keeps our bullish view intact.DAX remains weak in the near-term but the supports near current level can limit the downside and trigger a reversal. Nikkei and Shanghai can consolidate sideways before moving further higher. Sensex and Nifty consolidate in the near term before we see a fresh fall.
Dow (27088.08, +227.88, +0.85%) surged breaking above 27000 and keeps our bullish view intact to test 27200 and 27500 on the upside.
DAX (12332.12, -41.29, -0.33%) fell further and is heading towards the 12300-12250 support zone as expected. We expect the DAX to reverse higher from this support zone and resume its overall uptrend targeting 12800-13000 over the medium term.
Nikkei (21653.13, +9.60, +0.04%) remains higher above 21500 and is inching higher towards 21700-21750 as expected. A strong break above 21750 will pave way for 22000 and 22250. But while 21750 holds, a sideways range move between 21500 and 21750 can be seen for some more time.
Shanghai (2919.28, +1.51, +0.05%) as expected is consolidation in a narrow range between 2900-2950. The bias is bullish for it to break 2950 and rise to 3000 in the coming days.
Contrary to our expectation for a fall Sensex (38823.11, +266.07, +0.69%) and Nifty (11582.90, +84, 0.73%) have risen yesterday. However the price action indicates lack of strength in the upmove which leaves the broader view negative. Sensex and Nifty can consolidate for some time in the range of 38400-39100 and 11450-11650 respectively. Thereafter they can fall to 38100-38000 (Sensex) and 11400-11350 (Nifty) in the coming weeks.
COMMODITIES
Weak dollar continues to keep the commodity prices higher. Commodities like gold, silver and copper can consolidate in the near term before moving further higher. Oil on the other hand looks positive in the near term and can inch higher.
Gold (1408) has come-off sharply from 1427. As mentioned yesterday gold can consolidate between 1380 and 1440 for some time. A strong break above 1440 is needed to trigger a fresh rally going forward.
Silver (15.15) is getting support near 15.10 and can rise to 15.40-15.50 as mentioned yesterday. A break above 15.50 take it further higher to 15.70. But a pull-back from 15.50 can take it down to 15-14.90 and keep it range bound between 14.90 and 15.50 for some time.
Copper (2.69) remained higher and stable. As mentioned yesterday, while above 2.65 a sideways consolidation between 2.65 and 2.70 is possible in the near-term with the bias being bullish to break the range on the upside and rise to 2.73-2.75.
Brent (66.93) tested 67.7 as expected and has come-off from there. However, the support at 66.40 is holding well and keeps the near-term outlook positive to test 68-68.25 on the upside.
Nymex WTI (60.59) can rise to 62 in the near-term while it remains above 59.50. As mentioned yesterday, a strong break above 61 will trigger this rise.
FOREX
Dollar continues to remain weak as the rate cut expectations continue to weigh on the greenback. The Euro, Aussie, Yen and Pound looks strong in the near-term for further rise. Dollar-Rupee can trade between 68.25 and 68.50 with the broader bias being negative to test 68 on the downside eventually.
Dollar Index (96.95) seems to be lacking strength and looks vulnerable to break its support at 96.75 and fall to 96.5 and 69.25 in the coming sessions.
Dollar-Yen (108.35) has bounced sharply but the resistance at 108.5 is holding well as expected. This keeps our bearish view intact for a fall to 107 in the coming days. A decisive break below 108 will trigger this fall.
Euro-Yen (122.07) has bounced negating the dip to 121.3-121 expected yesterday. The cross remains mixed within its broad 121-123.5 and has equal chances of moving towards either end of the range from current levels.
The pull-back from 0.6980 on the Aussie (0.6989) that was expected yesterday seems to be not happening. Aussie looks bullish in the near-term to test 0.7025 on the upside.
Pound (1.2539) sustains above 1.2500 and can rise to 1.2600 as mentioned yesterday. Thereafter the broader downtrend is likely to resume
USDCNY (6.87) fell to 68.30 breaking below 68.50 as expected yesterday. It can remain range bound between 68.25-68.50 in the near term. The upside can extend to 68.60-68.75 in case of a break above 68.50. However, the broader view remains bearish to test 68 on the downside eventually.
INTEREST RATES
The US Treasury yields were mixed yesterday. Pick up in the US inflation saw the far-end yields moving higher while the near-end failed to cheer the data. The US Core-CPI rose 2.13% (YoY) for the month of June from 2% in the previous month. The Federal Reserve Chairman on Wednesday in his testimony had said that inflation is likely to remain weak that could pave way for a more accommodative policy. So the inflation picking up in June could be short-lived which will keep the possibilities high of a rate cut coming from the Fed in the near future.
The US 10Yr (2.13%) and 30Yr (2.65%) jumped 3bps and 6bps respectively following the inflation data while the 2Yr (1.86%) and 5Yr (1.89%) fell 7bps and 2bps respectively. The dip in the yields which we were expecting yesterday seems to be not happening. The 30Yr looks may rise further to 2.70% and 2.75% while it remains above 2.60%. The 10Yr on the other hand has room to test 2.20% or even higher levels.
The German yields fell in the near-end while the far-end continues to move higher as expected. The 2Yr (-0.74%) and 5Yr (-0.58%) were down 2bps and 1bps respectively while the 10Yr (-0.23%) and 30Yr (0.36%) were up 6bps and 3bps respectively. The 30Yr has resistance near current levels and can come dip to 0.30% and 0.28%. The 10Yr however has little room on the upside to test -0.20% and -0.18%.
The 10Yr GoI (6.4926%) has dipped further as expected and is hovering above a crucial support level of 6.48%. A break below 6.48% can take the 10Yr GoI further lower to 6.35% in the near-term.
USD/JPY Showing Signs Of Weakness Below 108.50
Key Highlights
- The US Dollar topped near 109.00 and recently declined against the Japanese Yen.
- USD/JPY traded below a major bullish trend line with support near 108.25 on the 4-hours chart.
- The US CPI in June 2019 increased 0.1% (MoM), whereas the market was expecting no change.
- The US Producer Price Index is likely to remain flat in June 2019 (MoM).
USDJPY Technical Analysis
The US Dollar traded higher in the past few days above 108.00 and 108.50 against the Japanese Yen. However, the USD/JPY pair struggled to clear the 109.00 resistance and recently started a downside correction.
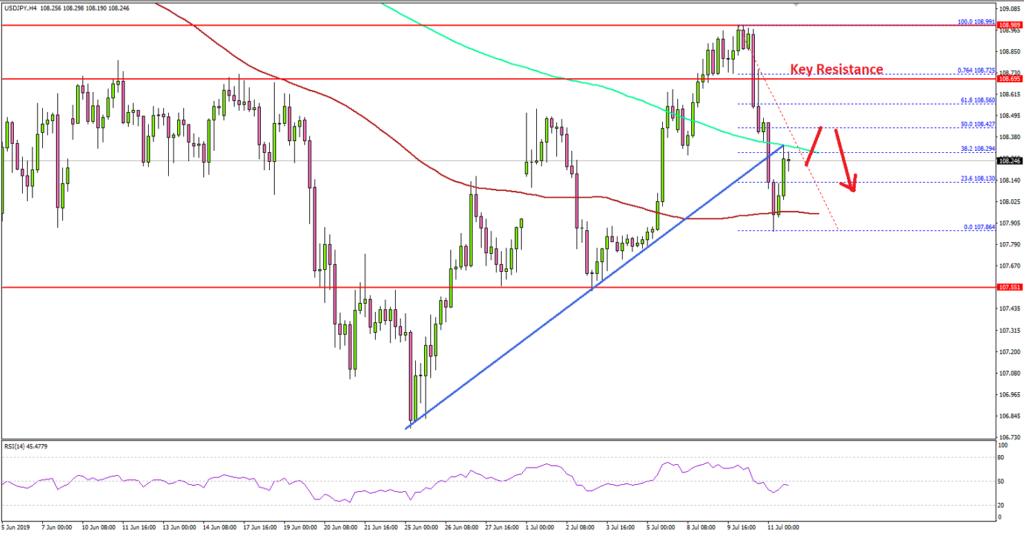
Looking at the 4-hours chart, the pair topped near the 108.99 level and traded below the 108.50 support area. Moreover, the pair traded below a major bullish trend line with support near 108.25.
It opened the doors for more losses below the 108.00 level and the 200 simple moving average (green, 4-hours). The pair traded towards the 107.80 support and corrected higher above the 23.6% Fib retracement level of the slide from the 108.99 high to 107.86 low.
However, the previous supports near 108.40 and 108.50 are likely to act as resistances and prevent a fresh increase. Should there be a close above 108.50, the pair might retest the 109.00 resistance.
Conversely, there is a risk of an extended decline below the 107.80 support level. The main support is near the 107.55 level, below which the pair may even slide towards 107.00.
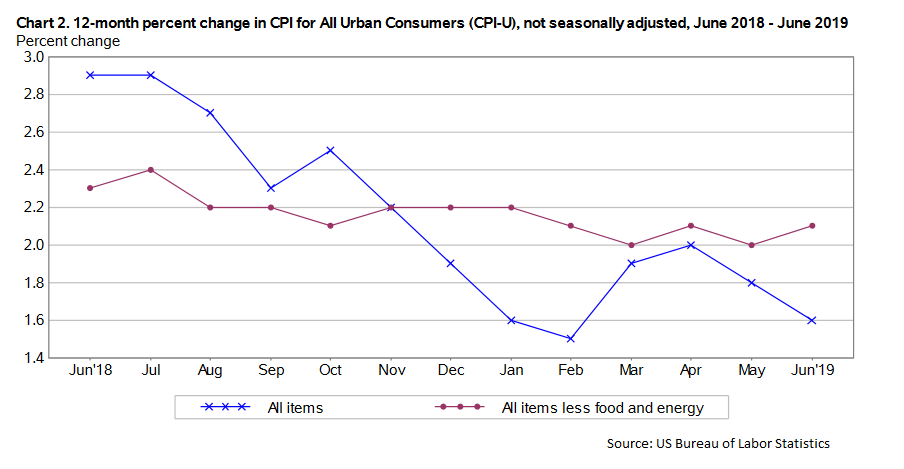
Fundamentally, the Consumer Price Index for June 2019 was released by the US Bureau of Labor Statistics. The market was looking for a no change compared with the previous month.
The actual result was above the market forecast, as there was a 0.1% rise in the CPI in June 2019. Looking at the yearly change, there was a 1.6% rise, similar to the forecast, but down from the last 1.8%.
The report added:
The energy index fell 2.3 percent as all of the major energy component indexes declined. The food index was unchanged as the index for food away from home rose but the index for food at home declined.
Overall, USD/JPY broke a few key supports and it seems like it could extend losses before starting a fresh increase towards the 109.00 level.
Economic Releases to Watch Today
- Euro Zone Industrial Production May 2019 (MoM) – Forecast +0.2%, versus -0.5% previous.
- US Producer Price Index June 2019 (MoM) – Forecast 0%, versus +0.1% previous.
- US Producer Price Index June 2019 (YoY) – Forecast +1.6%, versus +1.8% previous.
Daily Markets Broadcast
Wall Street attempts new record highs
It was a mixed performance by US indices yesterday. The US30 index hit a new record high but both the SPX500 and the NAS100 failed to advance beyond Wednesday’s highs. German shares under-performed amid profit warnings. China trade data are due today.
US30USD Daily Chart
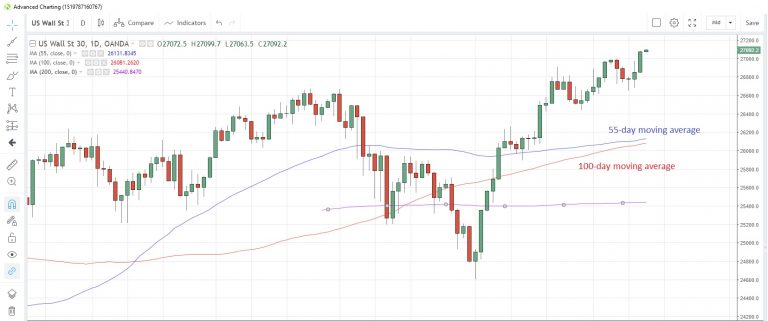
The US30 index rose the most in three weeks yesterday, climbing above the 27,000 mark for the first time, and early moves this morning have taken the index even higher
The 100-day moving average at 26,081 is edging closer to the 55-day average at 26,131
US inflation rose more than expected in June, which questioned the validity of a Fed rate cut this month. Today we see producer prices for the same month, while Fed’s Evans is scheduled to speak.
DE30EUR Daily Chart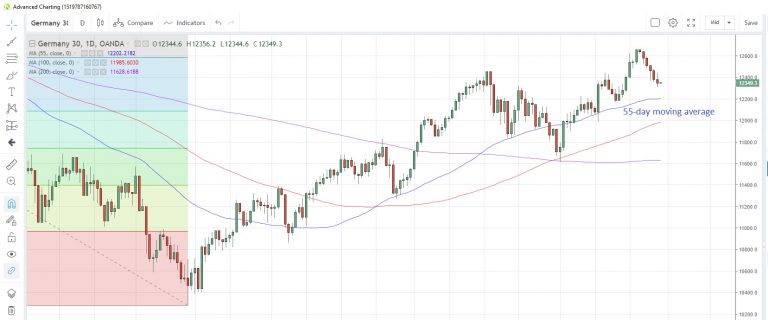
The Germany30 index fell for a sixth straight day yesterday, the longest losing streak since October last year, as the cloud of Deutsche Bank hit sentiment and more companies issued profit warnings
The index touched the lowest in two weeks, edging toward the 55-day moving average at 12,202
German consumer prices were unchanged from the initial reading in June, but the harmonized indices were revised higher. Wholesale prices are expected to rise 0.2% m/m and 1.3% y/y in June, surveys show.
CN50USD Daily Chart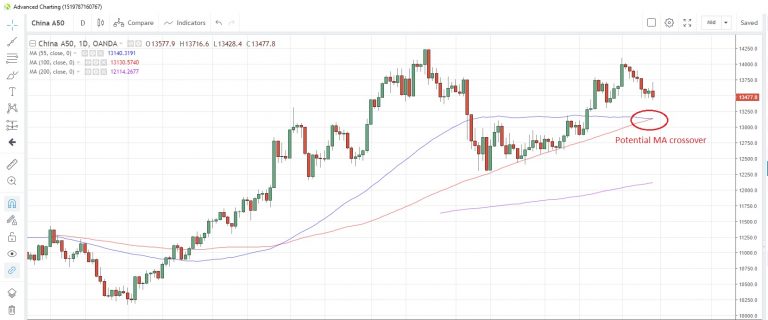
The China50 index slid to the lowest level in two weeks yesterday amid a lack of news in the US-China trade talks. Trump accused China of not complying with an agreement to increase its purchases of US agricultural products. China has no documentation of that agreement
The 55-day moving average at 13,140 looks poised to move below the 100-day moving average at 13,130. That would be the first time since February 26
China’s trade data for June are due at 1000hrs Singapore time. Exports are seen down 2.0% y/y, imports down 4.5% y/y resulting in a widening of the trade surplus to $44.7 billion. New loans for July could be released today. The are expected to increase by 1.7 trillion yuan.
Eco Data 7/12/19
[php_everywhere instance="1"]